Lana Rhoades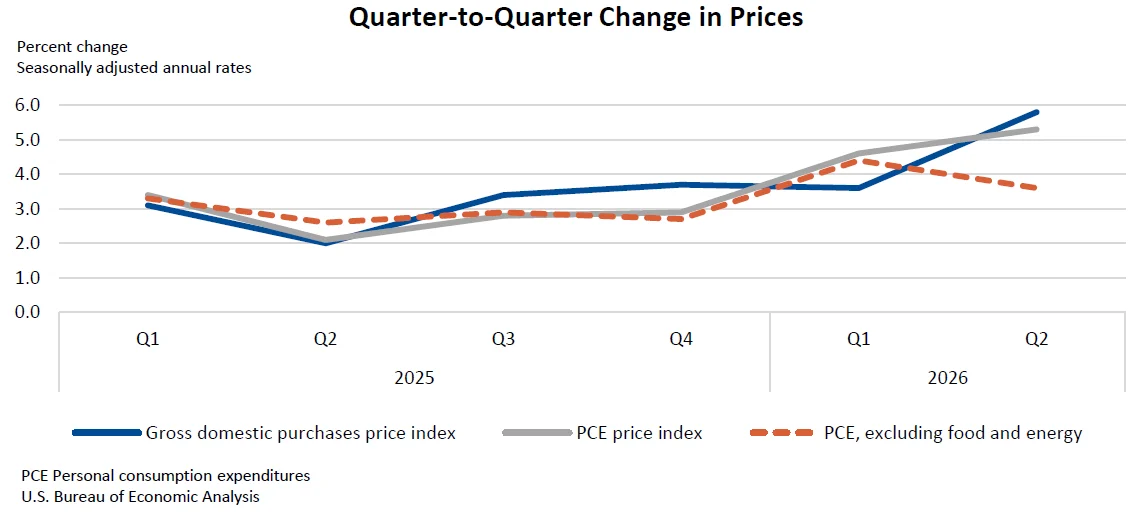
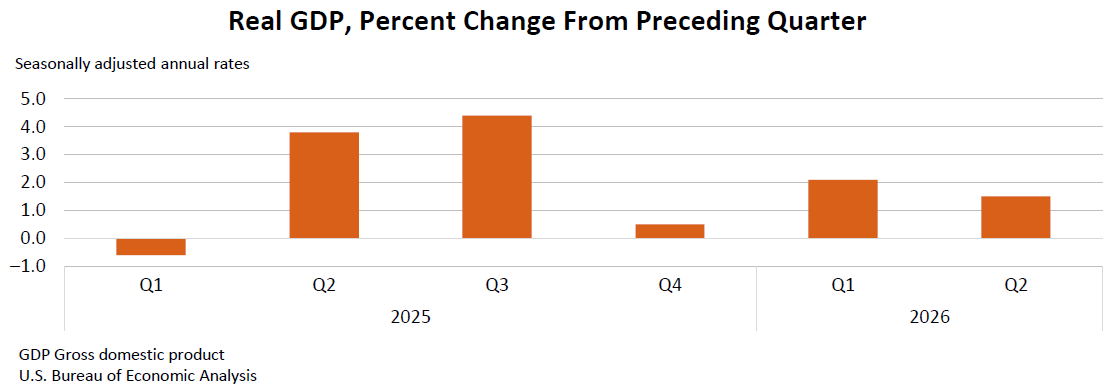
The U.S. economy experienced a moderation in its growth trajectory during the second quarter of 2026, with real gross domestic product (GDP) increasing at an annual rate of 1.5 percent, according to the second estimate released by the U.S. Bureau of Economic Analysis (BEA). This figure represents a slowdown from the 2.1 percent growth recorded in the first quarter of the year. The revised data indicates a slight recalibration of the initial projections, highlighting the dynamic nature of economic indicators and the importance of subsequent analyses.
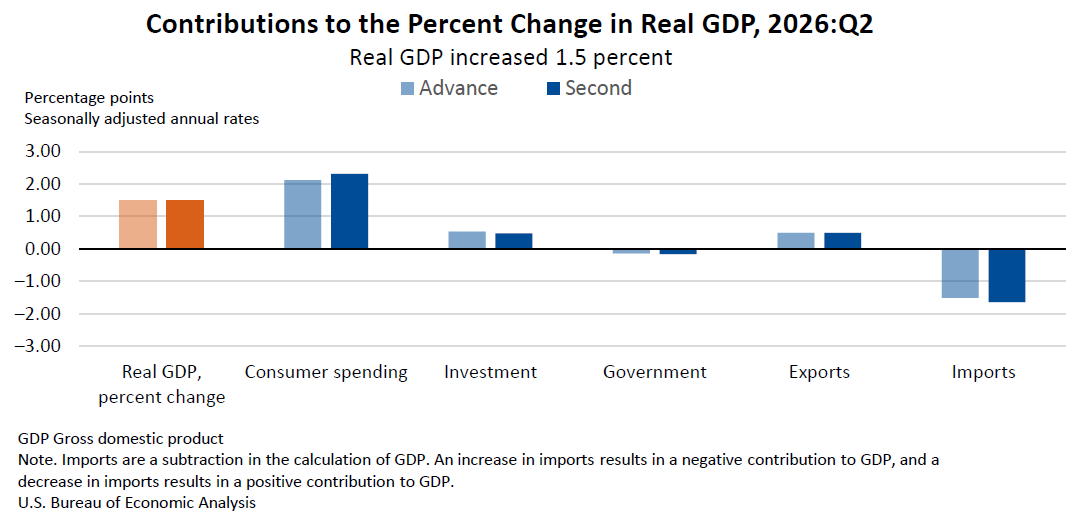
The BEA’s comprehensive report, which scrutinizes the intricate components of economic activity, points to a mixed bag of contributing factors for the second-quarter performance. While consumer spending, exports, and investment demonstrated positive momentum, their upward influence was tempered by a contraction in government spending. Furthermore, an increase in imports, which are subtracted in GDP calculations, also acted as a drag on overall growth. The BEA noted that the second estimate largely aligns with the advance estimate, with an upward revision to consumer spending being counterbalanced by an upward revision to imports, underscoring the intricate interplay of various economic forces.
Key Drivers of Economic Activity in Q2 2026
The second quarter’s economic landscape was shaped by several key trends. Consumer spending, a perennial engine of U.S. economic growth, continued to expand, providing a foundational strength. This was complemented by a rise in exports, suggesting a robust demand for American goods and services in the international market. Investment, encompassing business spending on equipment, software, and structures, also contributed positively, signaling a degree of confidence in future economic prospects among businesses.
However, the overall growth narrative was complicated by a decline in government spending. This could reflect a variety of factors, including the winding down of specific government initiatives, fiscal consolidation efforts, or shifts in budgetary priorities. The increase in imports also played a role, indicating that a portion of domestic demand was met by goods and services produced abroad, thereby reducing the net contribution of trade to GDP.
A Look Back: Q1 Performance and Deceleration
To understand the second quarter’s moderation, it is essential to contextualize it against the backdrop of the first quarter. The robust 2.1 percent growth in Q1 had painted a picture of a steadily expanding economy. The deceleration observed in Q2 was primarily attributed to a notable downturn in government spending. Additionally, investment and exports, which had contributed positively in the first quarter, experienced a slowdown in their pace of growth. Consumer spending, while still a positive contributor, accelerated its pace in the second quarter, providing some offset to the decelerating components. The net effect of these shifts resulted in the observed lower GDP growth rate for the second quarter.
Private Domestic Demand Remains Strong
Despite the overall GDP deceleration, an important measure of underlying economic strength, real final sales to private domestic purchasers, showed considerable resilience. This metric, which aggregates consumer spending and gross private fixed investment, increased by a robust 4.2 percent in the second quarter. This revision upwards from the previous estimate suggests that the core private sector of the economy remains dynamic and is driving significant economic activity, independent of government outlays and net trade. This strong performance in private demand indicates a healthy appetite for goods and services among households and businesses.
Inflationary Pressures Persist
The second quarter also saw persistent inflationary pressures, as indicated by the price index for gross domestic purchases, which increased by 5.8 percent. This represents a slight upward revision from the initial estimate. The personal consumption expenditures (PCE) price index, a key inflation gauge closely watched by the Federal Reserve, rose by 5.3 percent. Even when excluding volatile food and energy components, the core PCE price index saw a significant increase of 3.6 percent. These figures suggest that inflationary forces remain a prominent feature of the economic environment, potentially influencing future monetary policy decisions. The upward revisions in these price indices indicate that the cost of goods and services across the economy is rising at a slightly faster pace than initially anticipated.
Gross Domestic Income and the Average Measure
In addition to real GDP, the BEA also tracks real gross domestic income (GDI), which measures the income side of economic activity. Real GDI increased by 2.2 percent in the second quarter, a notable acceleration from the 1.2 percent growth in the first quarter. GDI provides an alternative perspective on economic health, reflecting the total income earned by all residents of the United States. The BEA emphasizes the importance of examining both GDP and GDI, as they can provide complementary insights. The average of real GDP and real GDI, a measure designed to smooth out potential discrepancies between the output and income approaches, increased by 1.8 percent in the second quarter, up from 1.7 percent in the first quarter. This average suggests a more consistent, albeit moderate, expansion across both measures of economic activity.
Corporate Profits Show Strong Gains
Corporate profits from current production demonstrated a significant surge in the second quarter, increasing by $400.9 billion. This stands in stark contrast to the $74.4 billion increase observed in the first quarter. This substantial rise in corporate profitability could be attributed to a combination of factors, including resilient consumer demand, successful cost management by businesses, and potentially the pass-through of higher prices to consumers. Strong corporate profits can have ripple effects throughout the economy, potentially leading to increased investment, hiring, and shareholder returns.
Contextualizing the Data: A Historical Perspective
The moderation in Q2 GDP growth, while a slowdown from Q1, is not necessarily an anomaly. Economic growth rates naturally fluctuate, influenced by a multitude of domestic and global factors. The post-pandemic recovery period has been characterized by periods of strong expansion followed by periods of recalibration. Understanding the current trend requires looking at broader economic cycles and the specific policy environment.
The period leading up to the second quarter of 2026 has seen a complex interplay of fiscal stimulus measures, supply chain adjustments, and evolving consumer behavior. While the immediate aftermath of the pandemic saw a surge in demand as economies reopened, the current phase may reflect a normalization of these trends, coupled with the ongoing impact of inflation and monetary policy adjustments.
Broader Economic Implications and Expert Analysis
The reported 1.5 percent GDP growth rate for Q2 2026 suggests an economy that is expanding, but at a more measured pace. This could be interpreted by policymakers as a sign that the economy is moving towards a more sustainable growth path, away from the potentially overheating conditions of earlier periods. However, the persistent inflation, particularly in core PCE, remains a key concern.
"The deceleration in GDP growth is notable, especially following a stronger first quarter," commented Dr. Eleanor Vance, a senior economist at the Sterling Institute for Economic Research. "While the resilience in private domestic demand is encouraging, the continued upward pressure on prices warrants close attention. The BEA’s revised figures provide a more nuanced picture, highlighting the tug-of-war between robust consumer activity and the dampening effects of government spending contraction and rising import costs."
The strong performance of corporate profits could be seen as a positive signal for the business sector, potentially supporting future capital expenditures and job creation. However, the sustainability of these profit margins in the face of potential shifts in consumer spending patterns and ongoing inflationary pressures will be a critical factor to monitor.
Looking Ahead: Annual Updates and Future Releases
The BEA also announced the schedule for its 2026 annual updates to national, industry, and regional economic data. For the first time, these updates will commence on the same day, September 30, 2026, consolidating a wide range of critical economic statistics. This coordinated release will include updates to GDP, gross domestic income, GDP by industry, monthly personal income and outlays, and related statistics within the National Income and Product Accounts (NIPAs) and Industry Economic Accounts. Additionally, the Regional Economic Accounts will be updated with GDP by state and county, and personal income by state and county. This comprehensive annual update is expected to provide a more complete and refined picture of the U.S. economy’s performance over the past year.
The next release of GDP data, scheduled for September 30, 2026, at 8:30 a.m. EDT, will include the third estimate for the second quarter of 2026, along with data on industries, corporate profits, state GDP, and state personal income. This upcoming release will incorporate further refinements to the Q2 data and provide initial insights into the third quarter’s economic activity.
Technical Notes and Data Revisions
The technical notes accompanying the BEA’s release shed light on the sources of revision between the advance and second estimates. The 1.5 percent annual growth rate for real GDP in the second quarter was a slight downward revision of less than 0.1 percentage point. This revision stemmed from an upward revision to consumer spending, which was counteracted by an upward revision to imports. Such revisions are standard as the BEA gathers more comprehensive data from various sources. The BEA provides detailed links to various data tables within its Interactive Data Application, allowing for in-depth exploration of these economic indicators.
The BEA also clarified the treatment of U.S. territories, Puerto Rico, and the Northern Mariana Islands in its statistical reporting. In the NIPAs, these territories are included in the "rest of the world" category, a treatment that differs from the International Transactions Accounts (ITAs), where they are considered part of the United States. This distinction is important for understanding the precise scope of the reported economic figures.
The ongoing analysis of GDP and its components is crucial for understanding the health and direction of the U.S. economy. The second quarter of 2026, with its moderated growth and persistent inflationary pressures, presents a complex economic picture that will continue to be closely scrutinized by policymakers, businesses, and individuals alike. The BEA’s commitment to providing timely and accurate data remains essential for informed decision-making in this dynamic economic landscape.