Lana Rhoades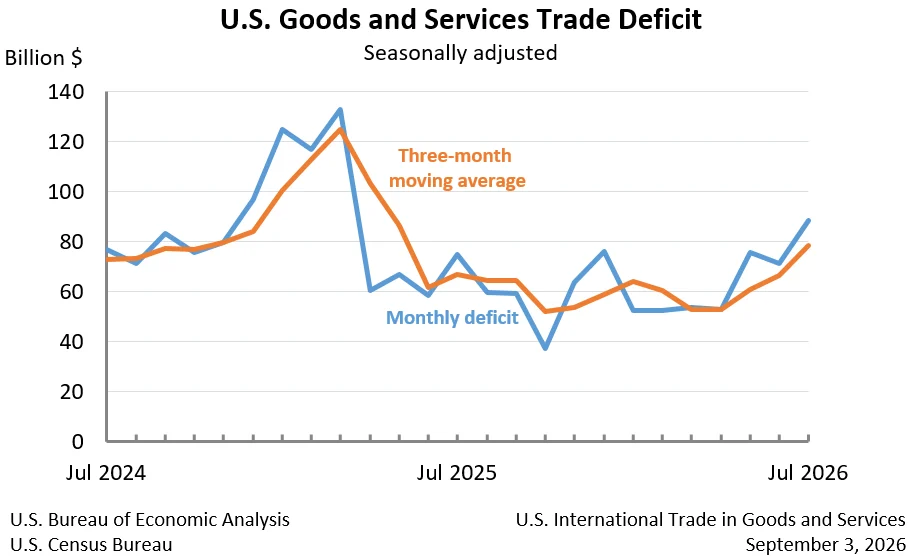
The United States experienced a significant widening of its trade deficit in July, reaching $88.6 billion, a substantial increase of $17.4 billion from the revised $71.2 billion deficit recorded in June. This marks a notable shift in the nation’s international trade balance, with imports outpacing exports more significantly than in the preceding month. The latest figures, released jointly by the U.S. Census Bureau and the U.S. Bureau of Economic Analysis, indicate a complex interplay of global economic forces influencing American commerce.
July Trade Imbalance: A Closer Look
In July, U.S. exports of goods and services totaled $310.7 billion, representing a decrease of $6.6 billion from June’s figures. This downturn in exports was driven by a $6.2 billion drop in goods exports, bringing them to $201.0 billion, and a $0.4 billion decrease in services exports, which settled at $109.7 billion. On the import side, the picture was reversed, with total goods and services imports rising by $10.8 billion to $399.3 billion. Imports of goods saw a substantial increase of $11.4 billion, reaching $320.6 billion, while imports of services experienced a slight decline of $0.6 billion to $78.7 billion.
The July increase in the overall goods and services deficit was primarily fueled by a widening deficit in goods, which escalated by $17.6 billion to $119.6 billion. This was partially offset by a modest increase in the services surplus, which grew by $0.2 billion to $31.0 billion.
Underlying Trends and Revisions
These monthly fluctuations are part of a broader trend that warrants closer examination. While the July figures paint a picture of a widening deficit, the year-to-date data presents a more nuanced perspective. For the first seven months of 2026, the cumulative goods and services deficit decreased by $188.4 billion, or 29.6 percent, compared to the same period in 2025. This significant year-to-date improvement is attributed to a robust 12.0 percent increase in exports, amounting to $237.2 billion, while imports saw a more modest rise of 1.9 percent, or $48.8 billion. This suggests that while monthly figures can be volatile, underlying trends over longer periods may indicate a more positive trajectory for the U.S. trade balance.
It is important to note that the data for January through June 2026 has undergone revisions. The Census Bureau and the Bureau of Economic Analysis incorporated more comprehensive and updated quarterly and monthly data, which can lead to adjustments in previously reported figures. These revisions are a standard part of the statistical reporting process, aimed at ensuring the highest degree of accuracy in economic indicators.
Moving Averages Offer a Smoother Perspective
To mitigate the impact of short-term volatility, economists often look at three-month moving averages. For the three months ending in July, the average goods and services deficit increased by $11.9 billion to $78.5 billion. This figure represents a notable increase compared to the three months ending in June. On a year-over-year basis, the average goods and services deficit for the three months ending in July saw an increase of $11.7 billion from the same period in 2025. This suggests that while the year-to-date trend shows improvement, recent months have seen a reversal, leading to a higher average deficit.
Deeper Dive into Goods and Services
The trade in goods, which constitutes the larger portion of the U.S. trade balance, showed a significant deterioration in July. The deficit in goods widened considerably, driven by both falling exports and rising imports. Exports of goods, on a Census basis, decreased by $5.9 billion, with an additional $0.3 billion reduction attributed to net balance of payments adjustments. Conversely, imports of goods on a Census basis surged by $12.0 billion, with a $0.6 billion decrease in net balance of payments adjustments.
In contrast, the services sector continued to exhibit a surplus, although it saw a slight decrease in July. The services surplus, while still contributing positively to the overall trade balance, only grew by $0.2 billion to $31.0 billion. This stability in the services sector, despite a minor decline in exports and a more significant decline in imports, highlights its resilience.
Real vs. Nominal Trade Balances
Analyzing trade in real terms, adjusted for price changes, provides another layer of understanding. The real goods deficit, measured in 2017 dollars on a Census basis, increased by $12.0 billion, or 12.7 percent, in July. This rise in the real deficit was slightly less pronounced than the 17.7 percent increase observed in the nominal deficit, suggesting that a portion of the nominal increase was due to price fluctuations rather than solely an increase in the volume of trade.
Trade Balances by Country and Region
The detailed country-specific data offers insights into the U.S. trade relationships. In July, on a Census basis, the U.S. recorded trade surpluses with several key partners, including the Netherlands ($7.8 billion), South and Central America ($6.6 billion), Hong Kong ($3.1 billion), and the United Kingdom ($2.5 billion). Significant deficits were observed with Mexico ($27.5 billion), Vietnam ($23.3 billion), Taiwan ($18.1 billion), and China ($15.2 billion).
Quarterly data, which is released with a one-month lag, provides a broader picture of trade flows. For the second quarter of 2026, the U.S. maintained substantial surpluses with countries like the Netherlands ($29.6 billion), South and Central America ($21.7 billion), and Singapore ($15.9 billion). However, significant deficits persisted with Vietnam ($61.2 billion), Taiwan ($53.1 billion), Mexico ($52.7 billion), and China ($32.3 billion). The trade relationship with China, in particular, continues to be a focal point, with a substantial deficit that has remained a subject of ongoing economic and political discussion.
Potential Implications and Expert Commentary
The widening trade deficit in July, driven by increased imports and decreased exports, could have several implications for the U.S. economy. A persistent and growing trade deficit can signal a potential drag on economic growth, as more domestic demand is being met by foreign production. It can also contribute to a depreciation of the U.S. dollar over time, as the demand for foreign currency to pay for imports increases.
Economists are likely to closely monitor these trends to assess their impact on U.S. manufacturing, employment, and overall economic stability. While the year-to-date data shows improvement, the recent uptick in the deficit raises questions about the sustainability of export growth and the continued strength of import demand.
"The July data presents a mixed signal," commented a senior economist at a leading financial institution who preferred to remain anonymous due to company policy. "The year-to-date improvement is encouraging, suggesting underlying strengths in U.S. exports. However, the sharp increase in the deficit in July, primarily driven by a surge in imports of goods, warrants attention. It could indicate a stronger domestic demand for imported goods, or perhaps a slowdown in key export markets impacting U.S. sales abroad."
Future Outlook and Data Release Schedule
The U.S. Census Bureau and the Bureau of Economic Analysis will release the next update on U.S. International Trade in Goods and Services for August 2026 on Tuesday, October 6, 2026. This upcoming release will provide further insights into whether the July trends were a temporary deviation or the beginning of a new pattern.
In a minor procedural note, with the August 2026 release, references to "Nauru" will be updated to "Naoero" to reflect the country’s recent name change, aligning with recognition by the U.S. Department of State and the International Organization for Standardization.
The full schedule of upcoming economic indicator releases from the Census Bureau is available on its Economic Briefing Room website, and from the BEA on its news schedule. These releases are crucial for businesses, policymakers, and investors seeking to understand the dynamics of the U.S. economy and its place in the global marketplace.