Lana Rhoades
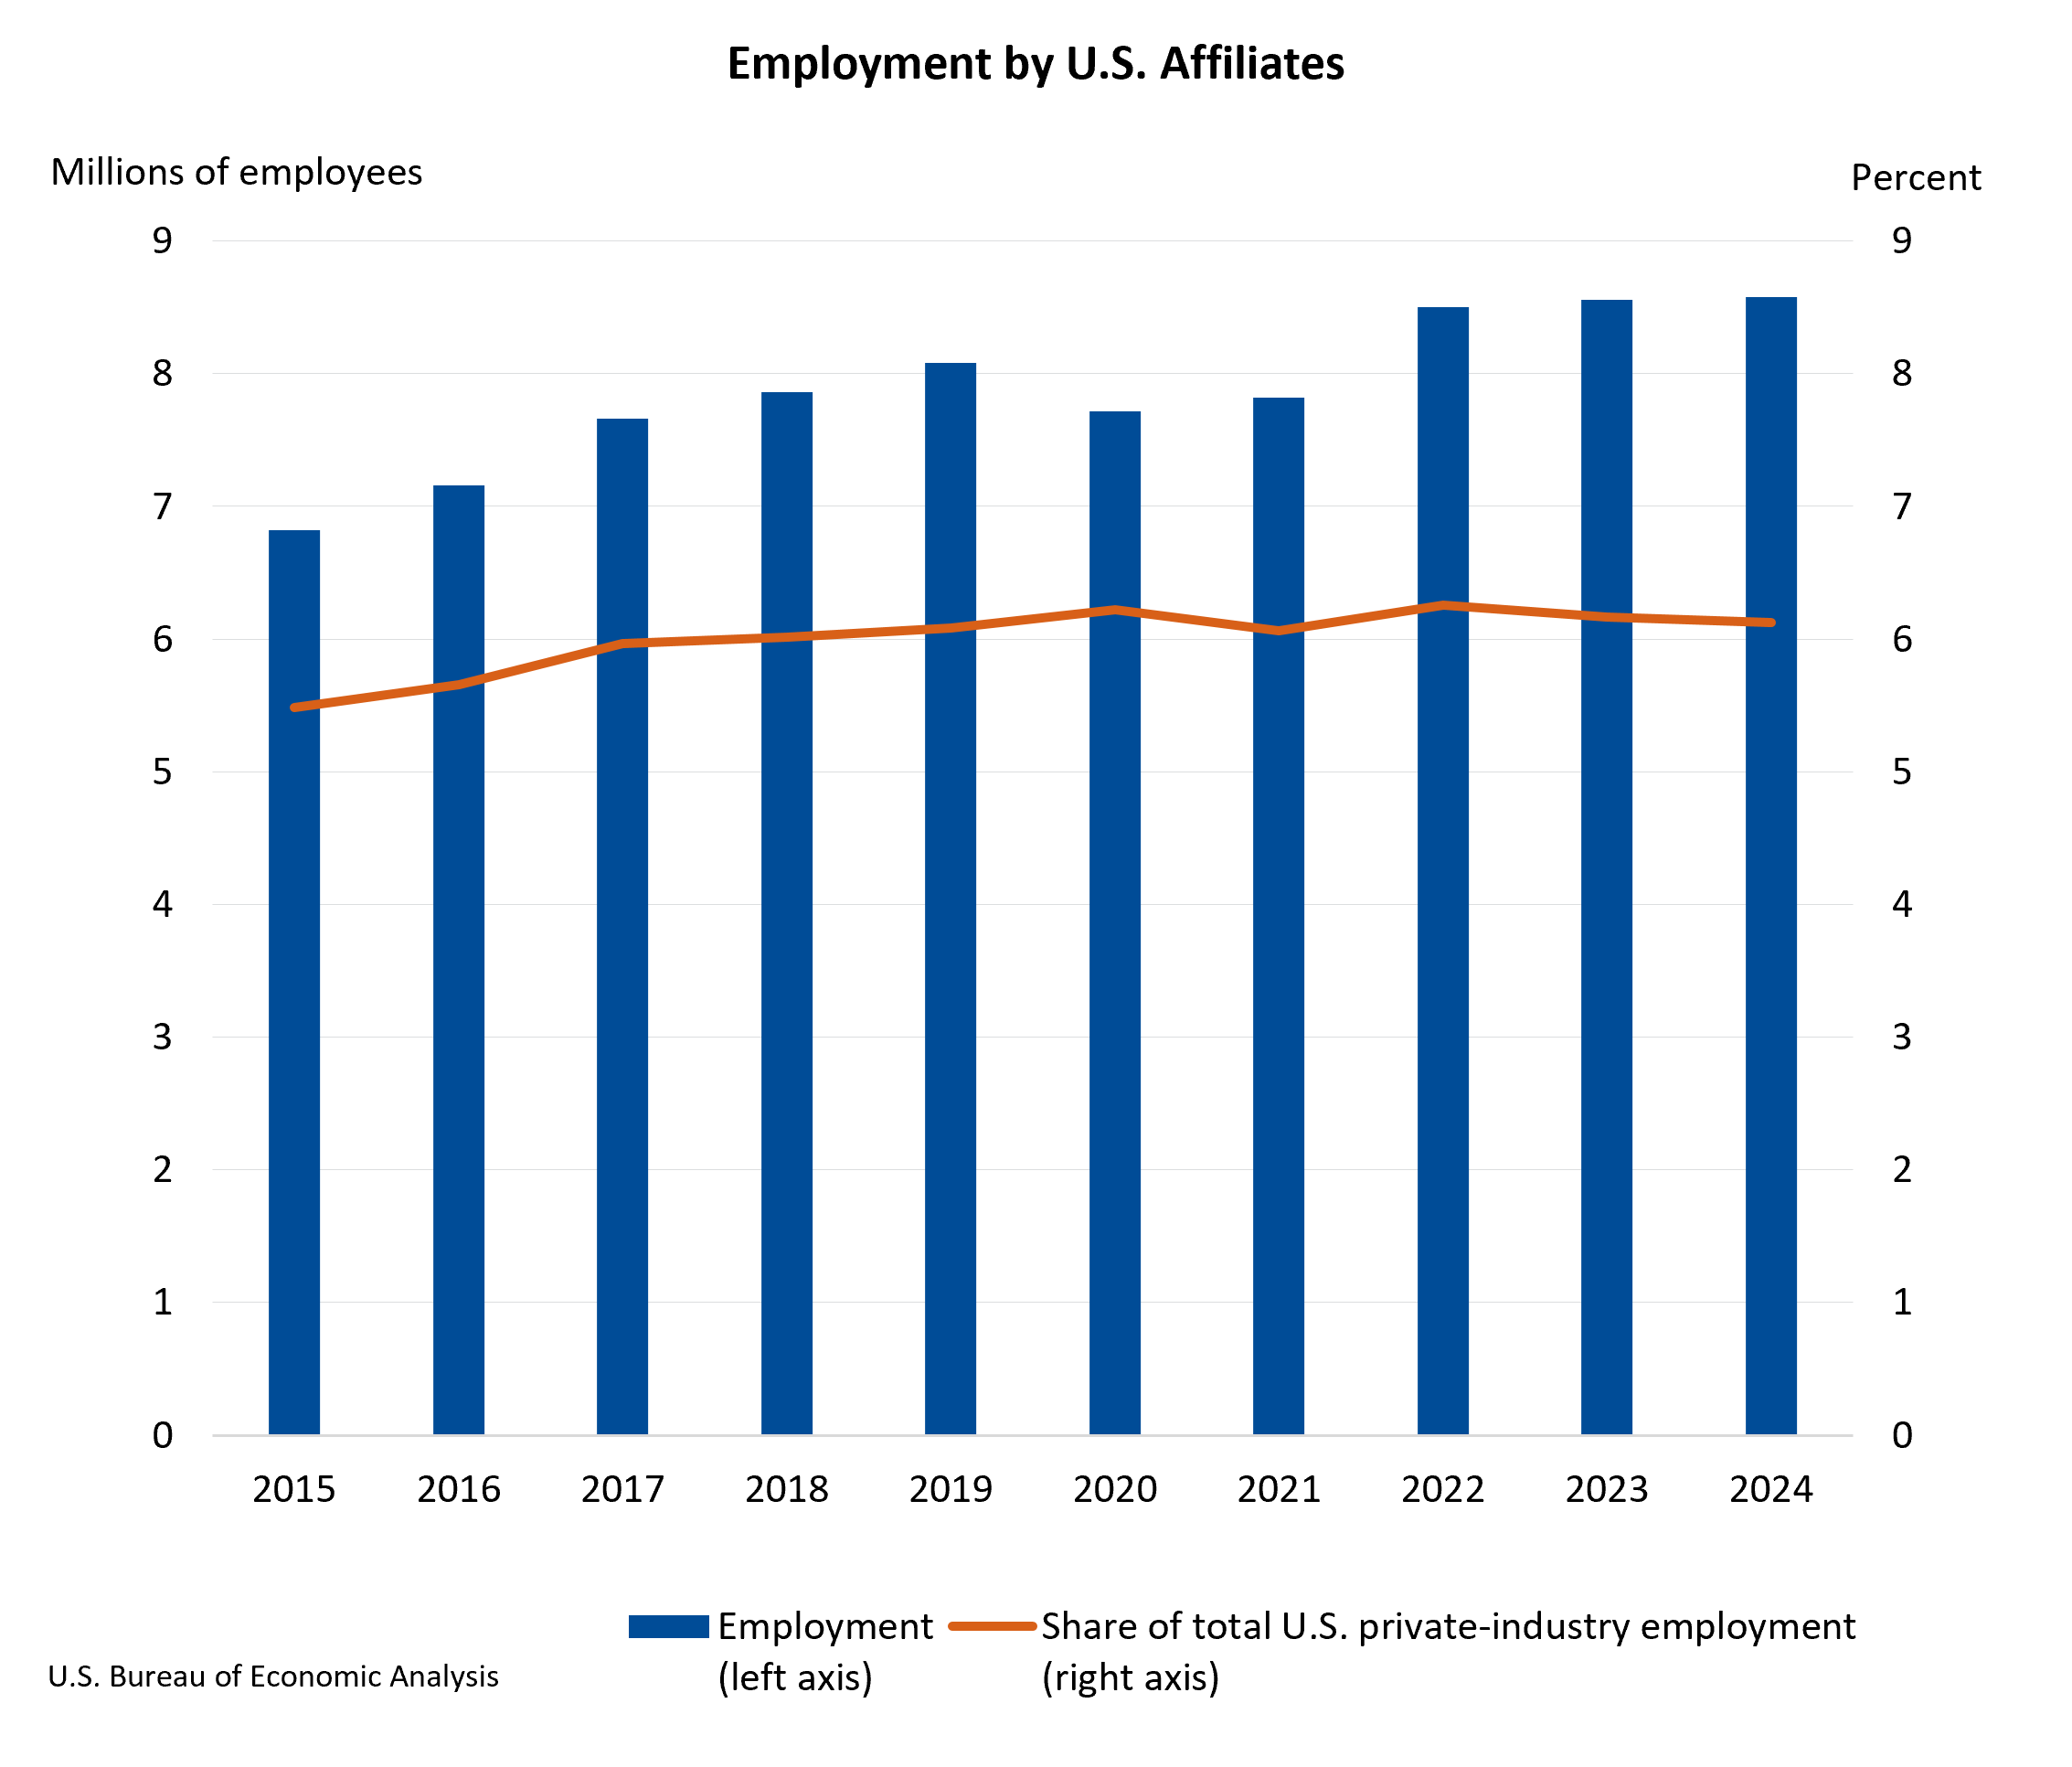
Majority-owned U.S. affiliates of foreign multinational enterprises (MNEs) provided employment for 8.57 million workers across the United States in 2024, a modest increase of 0.2 percent from the 8.56 million recorded in the preceding year. This data, released by the U.S. Bureau of Economic Analysis (BEA), offers a snapshot of the significant role foreign investment plays in the American labor market. While the number of jobs grew incrementally, the share of total private-industry employment held by these affiliates saw a slight dip, falling from 6.2 percent in 2023 to 6.1 percent in 2024.
The manufacturing and retail trade sectors emerged as the largest employers of workers within these foreign-owned U.S. operations. Geographically, the United Kingdom, Japan, and Germany stood out as the principal countries of ultimate beneficial ownership (UBO) for the U.S. affiliates contributing most significantly to employment figures. These statistics underscore the deep integration of foreign direct investment (FDI) into the fabric of the U.S. economy, impacting job creation and sector-specific growth.
Economic Contribution and Investment Trends
Beyond employment, the economic footprint of these U.S. affiliates is substantial. Their current-dollar value added, a key metric representing their direct contribution to the nation’s Gross Domestic Product (GDP), surged by 4.3 percent to reach $1.52 trillion in 2024. This figure signifies a robust economic output from these foreign-controlled entities. However, similar to employment, their share of total U.S. business-sector value added experienced a marginal decrease, moving from 6.8 percent in 2023 to 6.7 percent in 2024. This slight contraction in relative share, despite absolute growth, warrants a closer examination of broader economic trends and the performance of domestic businesses.
Investment in tangible assets remains a strong indicator of foreign companies’ commitment to their U.S. operations. Expenditures for property, plant, and equipment by these affiliates saw a healthy increase of 3.3 percent, amounting to $328.0 billion in 2024. This continued investment suggests a long-term strategy of expansion and infrastructure development by foreign MNEs within the United States.
Furthermore, the commitment to innovation is reflected in research and development (R&D) activities. R&D performed by U.S. affiliates experienced a significant increase of 5.3 percent, reaching $95.5 billion. This substantial investment highlights the crucial role foreign-owned companies play in driving innovation within the U.S., accounting for an impressive 12.4 percent of total U.S. business R&D in 2024. This data point is particularly noteworthy as it indicates that foreign investment is not solely focused on production and sales but also on advancing technological frontiers and intellectual capital within the United States.
Geographic Distribution of Employment
The distribution of employment generated by these majority-owned U.S. affiliates is concentrated in key states, reflecting the broader economic landscape of the nation. California led the pack with 885,200 jobs, followed by Texas with 717,400, and New York with 556,700. In each of these leading states, the manufacturing sector was the primary driver of employment within the foreign-affiliated companies. This concentration underscores the ongoing importance of manufacturing as a source of jobs, even as the economy diversifies. The data also suggests that states with large economies and diverse industrial bases tend to attract more significant investment and, consequently, create more jobs through foreign-owned enterprises.
Historical Context and Data Revisions
The statistics released by the BEA are part of an ongoing effort to track the impact of foreign direct investment. The BEA regularly updates its data to reflect the most current and comprehensive information available. For the 2023 fiscal year, the BEA has revised its preliminary estimates, incorporating newly available and updated source data. The initial preliminary estimates for 2023, released in December 2025, indicated 8,661.8 thousand employees. However, the revised estimate now stands at 8,556.9 thousand employees, representing a downward revision.
Similarly, value added for 2023 was revised from a preliminary estimate of $1,469.1 billion to $1,456.3 billion. Expenditures for property, plant, and equipment also saw a revision from $322.7 billion to $317.6 billion. In contrast, research and development expenditures for 2023 were revised upward from a preliminary $87.8 billion to $90.6 billion. These revisions are a standard part of the statistical process, aiming to provide the most accurate representation of economic activity. The BEA’s commitment to refining its data collection and analysis methods, including its updated disclosure avoidance method employing coarsening techniques like rounding and aggregation, allows for the publication of more granular data while safeguarding respondent confidentiality.
Analysis and Implications
The data from the BEA provides valuable insights into the dynamics of foreign direct investment in the United States. The slight increase in employment, while positive, also highlights the competitive nature of the global economy. The marginal decrease in the share of total private-industry employment suggests that while foreign-owned businesses are growing, domestic businesses may be growing at a faster rate or that overall private-sector employment growth is outpacing that of foreign affiliates. This could be influenced by various factors, including shifts in domestic economic policy, the performance of U.S. companies, and the global economic climate.
The continued strength in capital expenditures and R&D spending by these affiliates is a significant positive indicator. It signals a long-term commitment from foreign investors to not only operate but also to innovate and expand their presence in the U.S. market. This investment in R&D is particularly crucial for the United States’ global competitiveness, as it contributes to technological advancement, job creation in high-skilled sectors, and the development of intellectual property.
The concentration of employment in key states like California, Texas, and New York is not surprising, given these states’ robust economies, large consumer markets, and established infrastructure. The prominence of the manufacturing sector in these states, even in the context of foreign-owned affiliates, underscores its enduring importance. However, it also raises questions about regional economic disparities and the need for policies that encourage investment and job creation in other parts of the country.
Top Contributing Nations
The United Kingdom, Japan, and Germany consistently rank as the largest contributors to employment through their U.S. affiliates. This reflects long-standing trade and investment relationships between these nations and the United States. The stability and depth of these relationships provide a foundation for continued foreign investment. Understanding the specific sectors and types of investments made by companies from these countries can offer further insights into their strategic priorities within the U.S. market. For instance, Japanese automotive companies have a significant presence in the U.S., contributing substantially to manufacturing employment. German companies, particularly in the automotive and chemical sectors, also represent a major source of FDI and jobs. British companies, across a range of sectors including finance and pharmaceuticals, also play a vital role.
Future Outlook and Data Availability
The BEA’s release schedule indicates that preliminary statistics for the 2025 activities of U.S. affiliates of foreign MNEs are anticipated in the Spring of 2027. This forward-looking data will provide further insights into emerging trends and the evolving landscape of foreign investment in the United States. The BEA’s commitment to providing comprehensive data, including detailed breakdowns by industry, country, and state, is invaluable for policymakers, researchers, and businesses seeking to understand the complex interplay of global investment and the U.S. economy.
The comprehensive data tables available on the BEA website offer a wealth of information beyond the highlights presented here. These tables allow for in-depth analysis of sales, balance sheet and income statement items, compensation of employees, trade flows, and much more. This granular data empowers stakeholders to conduct detailed analyses and make informed decisions based on the most up-to-date economic intelligence. The ongoing modifications to certain data tables, particularly those concerning affiliate counts, reflect the BEA’s continuous efforts to refine its data presentation and ensure its relevance and accessibility.
The United States continues to be a premier destination for foreign direct investment, driven by its large consumer market, skilled workforce, and stable economic and legal framework. The data on U.S. affiliates of foreign MNEs serves as a crucial barometer of this investment’s impact, providing a nuanced picture of job creation, economic contribution, and strategic investment trends. As the global economic landscape continues to evolve, close monitoring of these statistics will be essential for understanding the ongoing role of foreign enterprise in shaping the American economy.