Lana Rhoades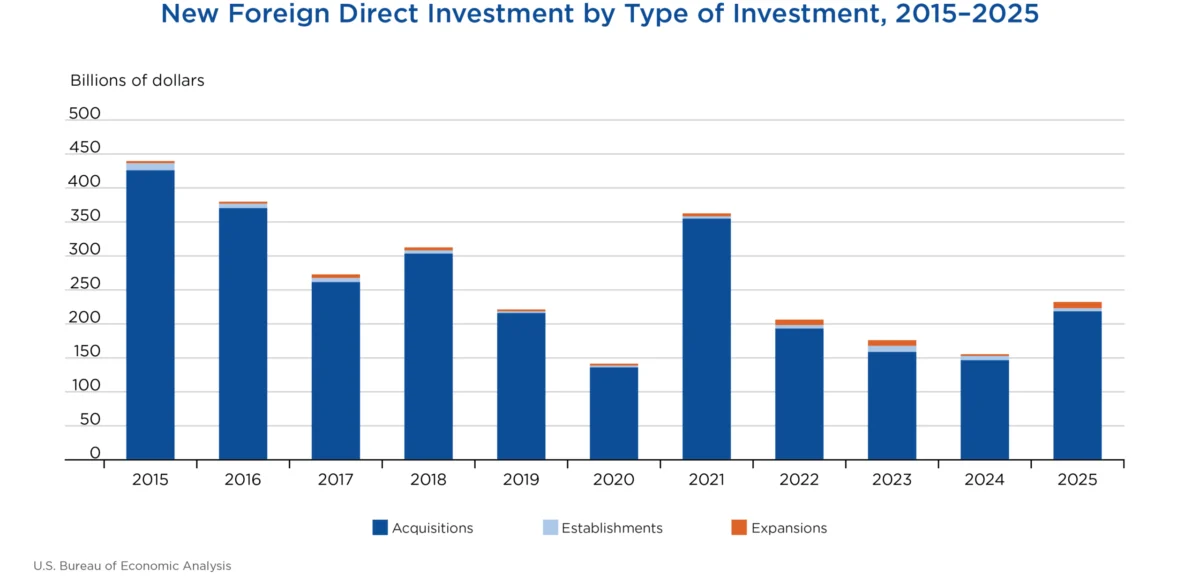
Expenditures by foreign direct investors to acquire, establish, or expand U.S. businesses surged to a remarkable $232.2 billion in 2025, marking a significant 49.5 percent increase, or $76.8 billion, from the previous year’s levels. Preliminary statistics released by the U.S. Bureau of Economic Analysis (BEA) underscore a robust appetite among international entities for engaging with the American economic landscape, with the acquisition of existing U.S. businesses continuing to represent the dominant mode of investment. This substantial inflow of capital signals continued confidence in the U.S. market and its potential for growth and returns.
The lion’s share of these foreign direct investment (FDI) expenditures in 2025 was directed towards acquisitions, totaling $218.4 billion. This figure alone highlights the attractiveness of established U.S. companies as targets for foreign ownership and strategic integration. In parallel, the establishment of new U.S. businesses through FDI accounted for $4.6 billion, demonstrating a commitment to organic growth and the creation of new economic ventures. Furthermore, expansions of existing foreign-owned businesses within the United States contributed $9.2 billion, indicating a strategy of deepening investment and scaling operations for entities already present in the market. When considering planned future expenditures alongside initial outlays, the total projected investment, encompassing both first-year commitments and subsequent phases, reached an even more substantial $284.5 billion. This forward-looking figure suggests a sustained and potentially escalating level of FDI in the coming years.
The impact of this surge in foreign investment extends directly to job creation and economic opportunity. In 2025, employment at newly acquired, established, or expanded foreign-owned businesses in the United States reached an impressive 213,100 employees. This figure represents new jobs or the retention and potential growth of jobs within these entities, contributing to overall U.S. employment figures and fostering economic well-being across various communities.
Key Sectors and Geographic Drivers of Investment
Analysis of the BEA data reveals distinct patterns in the sectors and origins of this significant FDI. By industry, the publishing sector attracted the largest share of new direct investment in 2025, with expenditures totaling $50.7 billion. This was closely followed by the chemicals manufacturing sector, which garnered $45.4 billion, and the plastics and rubber products manufacturing sector, with $19.0 billion. Collectively, the manufacturing sector as a whole represented a substantial portion of the total FDI, accounting for $121.8 billion, or 52.5 percent of all new direct investment expenditures. This dominance by manufacturing underscores its continued importance as a hub for global industrial investment.
On a country-by-country basis, Japan emerged as the leading investor in the U.S. market in 2025, with a substantial $50.5 billion in expenditures. Germany followed as the second-largest investor, contributing $26.7 billion, and Canada ranked third with $23.5 billion. Examining investment by broader geographic regions, Europe proved to be the most significant source of new FDI, contributing $116.6 billion, or 50.2 percent of all new investment. The Asia and Pacific region was the second-largest investing region, with expenditures amounting to $71.9 billion, indicating a broad and diverse base of international investors.
At the state level, California continued its trend of attracting significant foreign investment, receiving $59.7 billion in first-year investment expenditures. Texas followed with $21.5 billion, and Pennsylvania secured the third-highest level of investment with $20.9 billion. These leading states likely benefit from a combination of factors, including robust economies, skilled workforces, favorable business environments, and established infrastructure.
Greenfield Investments: Cultivating New U.S. Ventures
Beyond acquisitions, the BEA data also provides insights into "greenfield" investments – expenditures specifically aimed at establishing new U.S. businesses or expanding existing foreign-owned ones from the ground up. In 2025, greenfield investment expenditures totaled $13.8 billion. Within this category, the transportation and warehousing sector led, attracting $3.6 billion in greenfield investment. This was followed by computers and electronics products manufacturing ($2.0 billion) and chemicals manufacturing ($1.8 billion).
Regionally, investors from the Asia and Pacific region were the primary drivers of greenfield investment, contributing $8.3 billion. Australia led this regional push with $3.0 billion, followed by South Korea ($2.2 billion) and Japan ($1.7 billion). At the state level, Louisiana emerged as a key destination for greenfield investment, receiving $3.0 billion, with Arizona close behind at $2.7 billion, and Texas at $1.9 billion. Planned total expenditures for greenfield investments initiated in 2025, including both initial outlays and future commitments, reached $66.1 billion, signaling a long-term vision for growth in these newly established or expanded operations.
Employment Dynamics: A Closer Look at Workforce Impact
The employment generated by new foreign direct investment in 2025 paints a detailed picture of the labor market effects. Current employment at acquired enterprises stood at 211,700. When considering the planned employment for newly established businesses upon full operation, as well as anticipated job growth from expansions, the total planned employment associated with this wave of FDI reached 232,400. This indicates a net positive outlook for job creation stemming from these foreign investments.
By industry, plastics and rubber parts manufacturing provided employment for the largest number of current employees (21,800), followed by transportation equipment manufacturing (17,300) and primary and fabricated metals manufacturing (16,400). Examining employment by country of origin for investors, Mexico accounted for the largest number of current employees in foreign-owned businesses, with 54,600. Canada followed with 29,500 employees, and the United Kingdom with 26,800. At the state level, California once again led in terms of current employment resulting from new investment, with 37,200 employees. Illinois followed with 17,600 employees, and Texas with 16,500.
Revisions to 2024 Data Highlight Ongoing Trends
The BEA also released updated figures for 2024, indicating a previous underestimation of FDI activity. First-year expenditures for new foreign direct investment in the United States in 2024 were revised upwards from a previously published $151.0 billion to $155.3 billion. This revision reflects an increase in acquisitions of U.S. businesses, which were adjusted from $143.0 billion to $146.4 billion, and a notable rise in expansions of existing U.S. businesses, which were revised from $1.8 billion to $2.5 billion. Planned total expenditures for 2024 were also revised upwards, from $157.0 billion to $164.0 billion, with similar adjustments for acquisitions and expansions. These revisions suggest that the momentum of foreign investment in the U.S. has been building over a longer period than initially reported, reinforcing the positive trends observed in the 2025 data.
Context and Analysis of FDI Trends
The robust performance of foreign direct investment in 2025 can be attributed to a confluence of factors. The United States continues to be viewed as a stable and attractive market with a large consumer base, advanced technological infrastructure, and a well-developed legal and financial system. Global economic conditions, while subject to fluctuations, may also have created opportunities for international companies to seek diversification and growth in established markets. Furthermore, strategic initiatives by the U.S. government aimed at attracting foreign investment, coupled with the relatively favorable business environment, likely play a role in these positive trends.
The significant proportion of investment directed towards acquisitions suggests that foreign investors may be leveraging existing market knowledge, established customer bases, and operational efficiencies of U.S. companies to achieve quicker market penetration and returns. Conversely, the growth in greenfield investments, though smaller in absolute terms, indicates a commitment to long-term development and the creation of new economic ecosystems within the U.S.
The leading roles of Japan, Germany, and Canada, as well as Europe and the Asia-Pacific region, highlight established economic ties and strategic interests of these nations in the U.S. economy. The concentration of investment in states like California, Texas, and Pennsylvania points to the enduring appeal of large, diverse, and economically dynamic regions within the United States.
Implications for the U.S. Economy
The sustained inflow of foreign direct investment carries significant implications for the U.S. economy. Beyond the immediate job creation, FDI brings new capital, technology, management expertise, and access to international markets. This can lead to increased productivity, innovation, and competitiveness across various sectors. The expansion of industries such as manufacturing and chemicals, driven by foreign capital, can bolster domestic production capabilities and potentially reduce reliance on imports.
The BEA’s updated disclosure avoidance methods, which utilize coarsening techniques like rounding and aggregation, aim to enhance data transparency while maintaining respondent confidentiality. This approach allows for the publication of more granular data, providing a clearer picture of FDI trends and their impact.
As the BEA prepares to release its next set of findings for 2026 in June 2027, the current data for 2025 serves as a strong indicator of the U.S. economy’s continued attractiveness to global investors. The trend suggests that foreign direct investment will remain a vital component of U.S. economic growth, job creation, and technological advancement in the foreseeable future. The detailed industry, country, and state-level data provided by the BEA will be crucial for policymakers, businesses, and researchers seeking to understand and leverage these evolving investment patterns.
The BEA will continue to publish detailed data tables related to these findings, offering further insights into first-year and planned total expenditures, greenfield investments, and employment figures across various dimensions. These comprehensive datasets are available in the "Supplemental Data" section of the BEA’s website, providing a valuable resource for in-depth analysis.