Lana Rhoades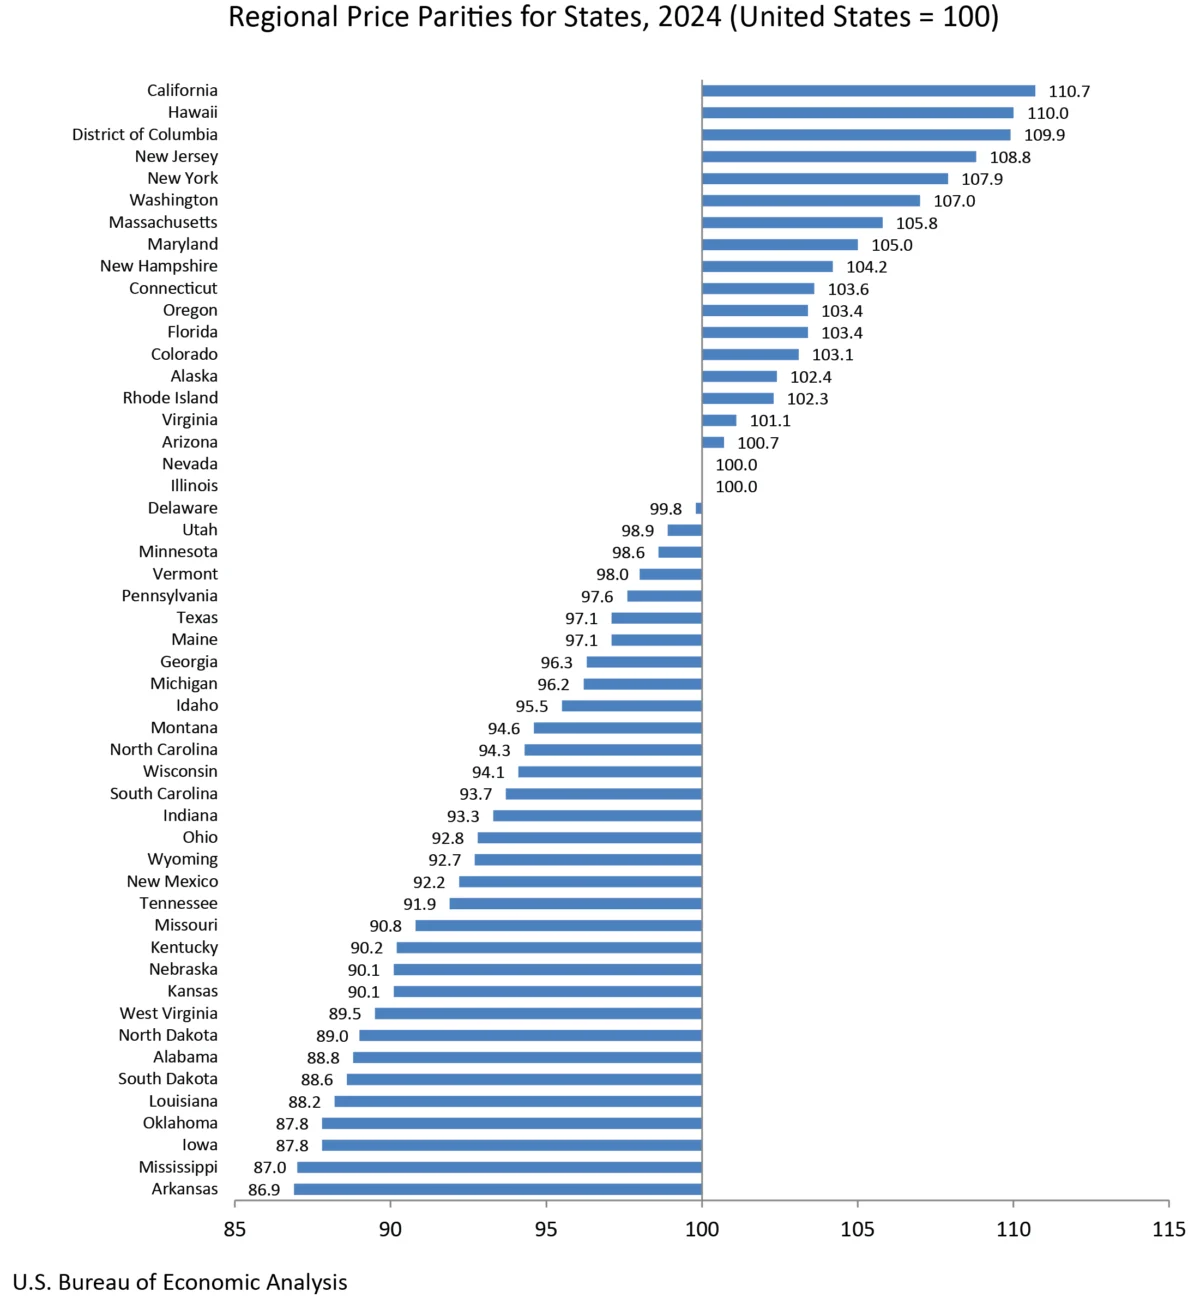
Today, the U.S. Bureau of Economic Analysis (BEA) unveiled its latest annual statistics on real personal consumption expenditures (PCE), real personal income, and regional price parities (RPPs) for all 50 states and the District of Columbia for the year 2024. This significant release offers a detailed snapshot of the economic landscape across the nation, highlighting variations in consumer behavior, income growth, and the cost of living, and also announces key changes in data presentation and publication.
Key Findings: Real Personal Consumption Expenditures
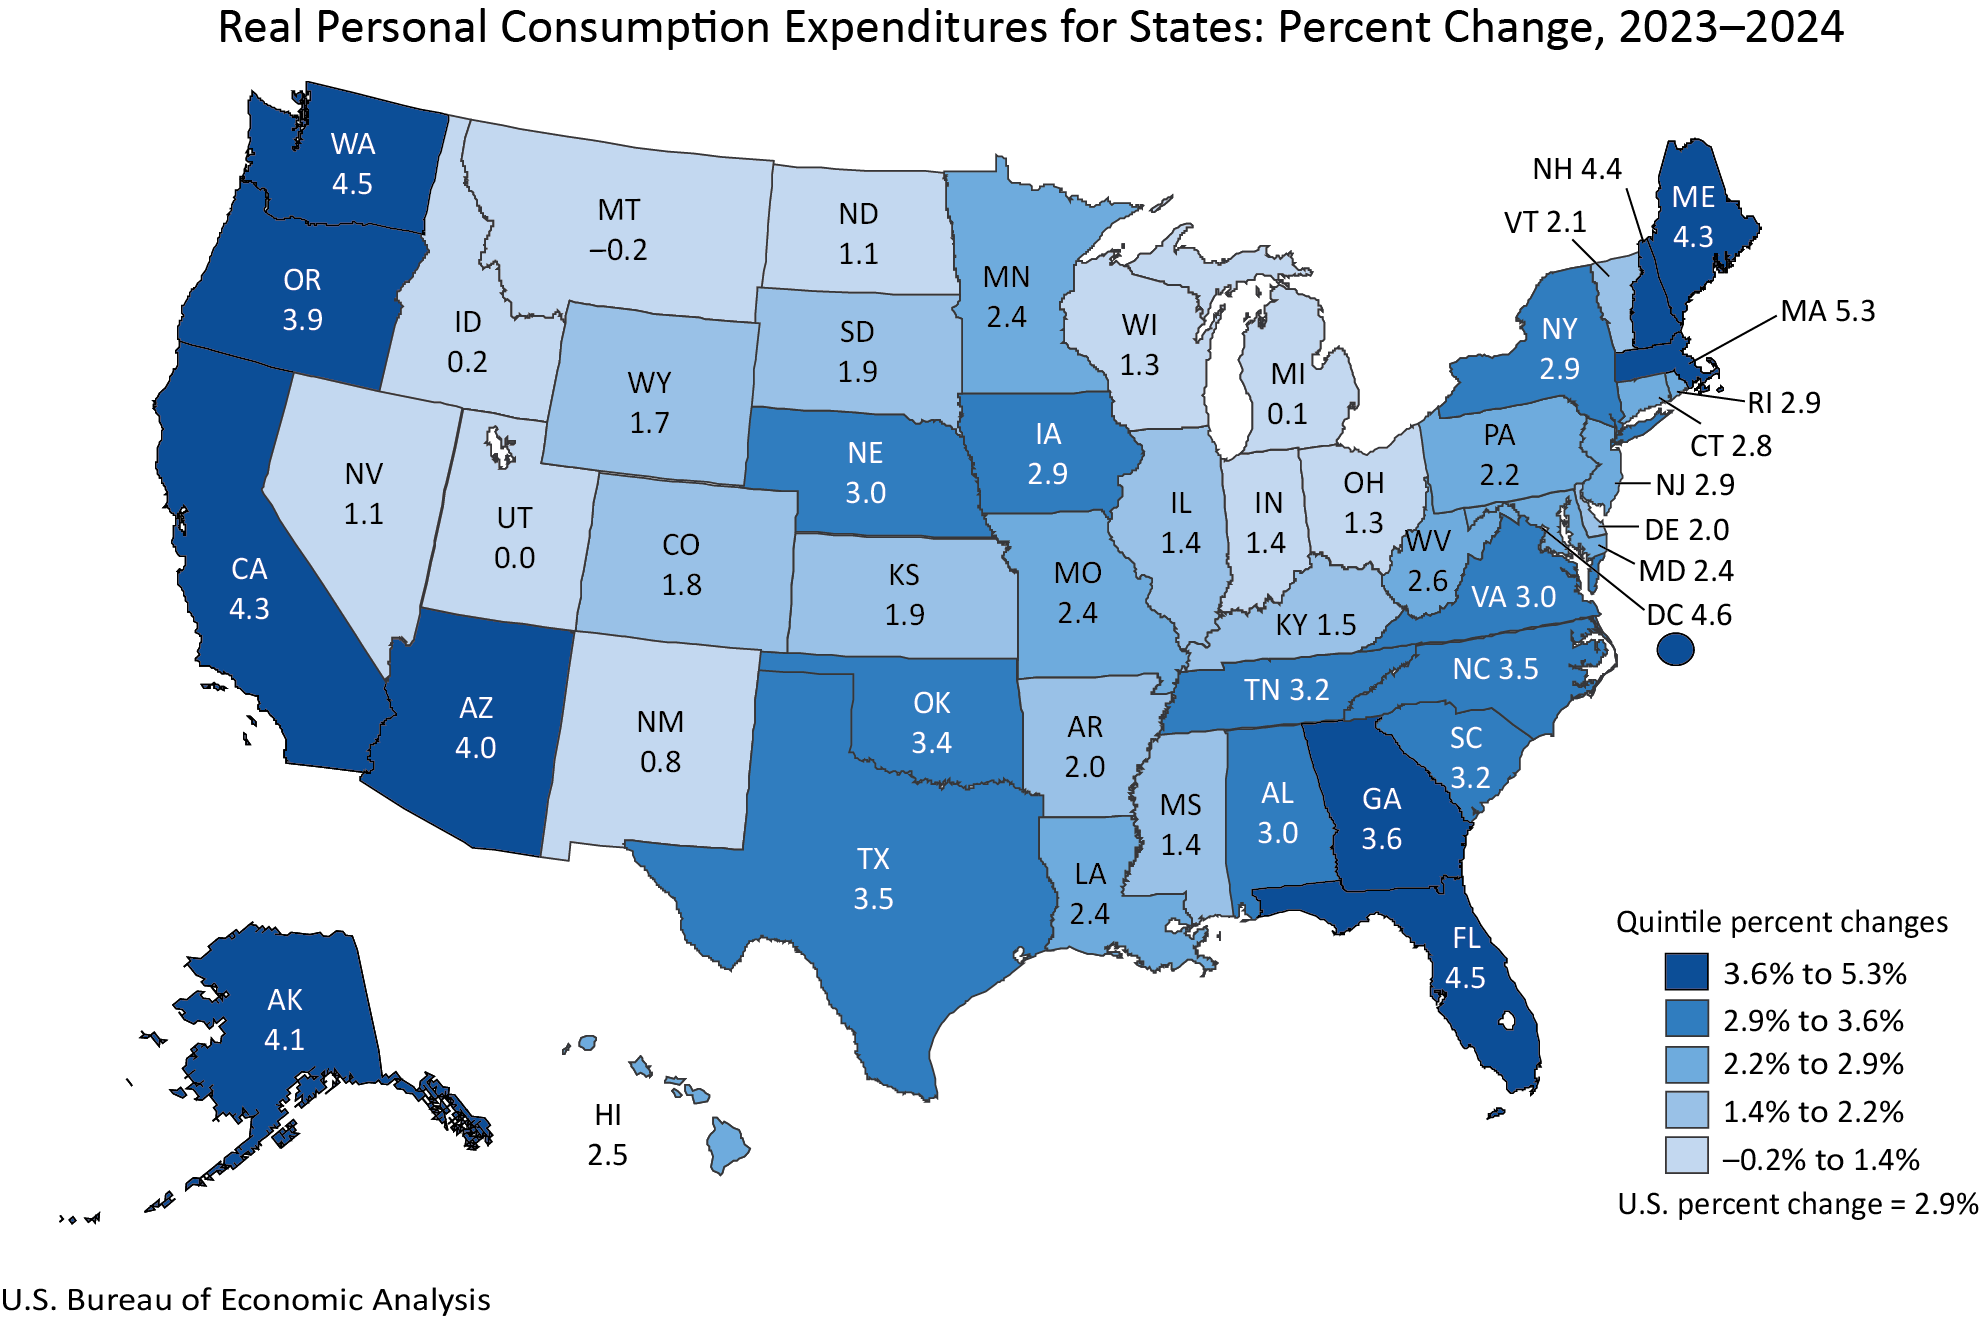
The data reveals a broadly positive trend in real personal consumption expenditures, a crucial indicator of consumer demand and economic vitality. In 2024, a substantial 48 states and the District of Columbia experienced an increase in real PCE. This widespread growth suggests a robust national appetite for goods and services, even as individual state performances varied.
Massachusetts emerged as a leader in this growth, registering an impressive 5.3 percent increase in real PCE. This strong showing indicates a dynamic economic environment within the state, likely fueled by a combination of factors such as a thriving technology sector, a strong job market, and potentially increased disposable income among its residents.
In contrast, Montana recorded a slight decrease of 0.2 percent in real PCE. While modest, this decline warrants attention and could signal localized economic challenges or shifts in consumer spending patterns within the state.
Nationally, real PCE saw an increase of 2.9 percent in 2024. This growth outpaced the national PCE price index, which rose by 2.6 percent. The fact that real PCE grew faster than inflation means that the actual volume of goods and services purchased by consumers increased. This divergence is further underscored by the increase in current-dollar PCE, which rose by 5.6 percent. This means that while prices did increase, consumer spending in dollar terms grew even more significantly, suggesting increased purchasing power or a greater volume of transactions.
The BEA’s regional estimates of real PCE are derived by adjusting current-dollar estimates with both the corresponding regional price parity (RPP) and the national PCE price index. This methodology ensures that the figures reflect changes in the actual quantity of goods and services consumed, stripping away the impact of inflation and regional price differentials. Understanding these nuances is critical for policymakers and businesses seeking to grasp the true health of consumer demand at the state level.
Real Personal Income Shows Widespread Gains
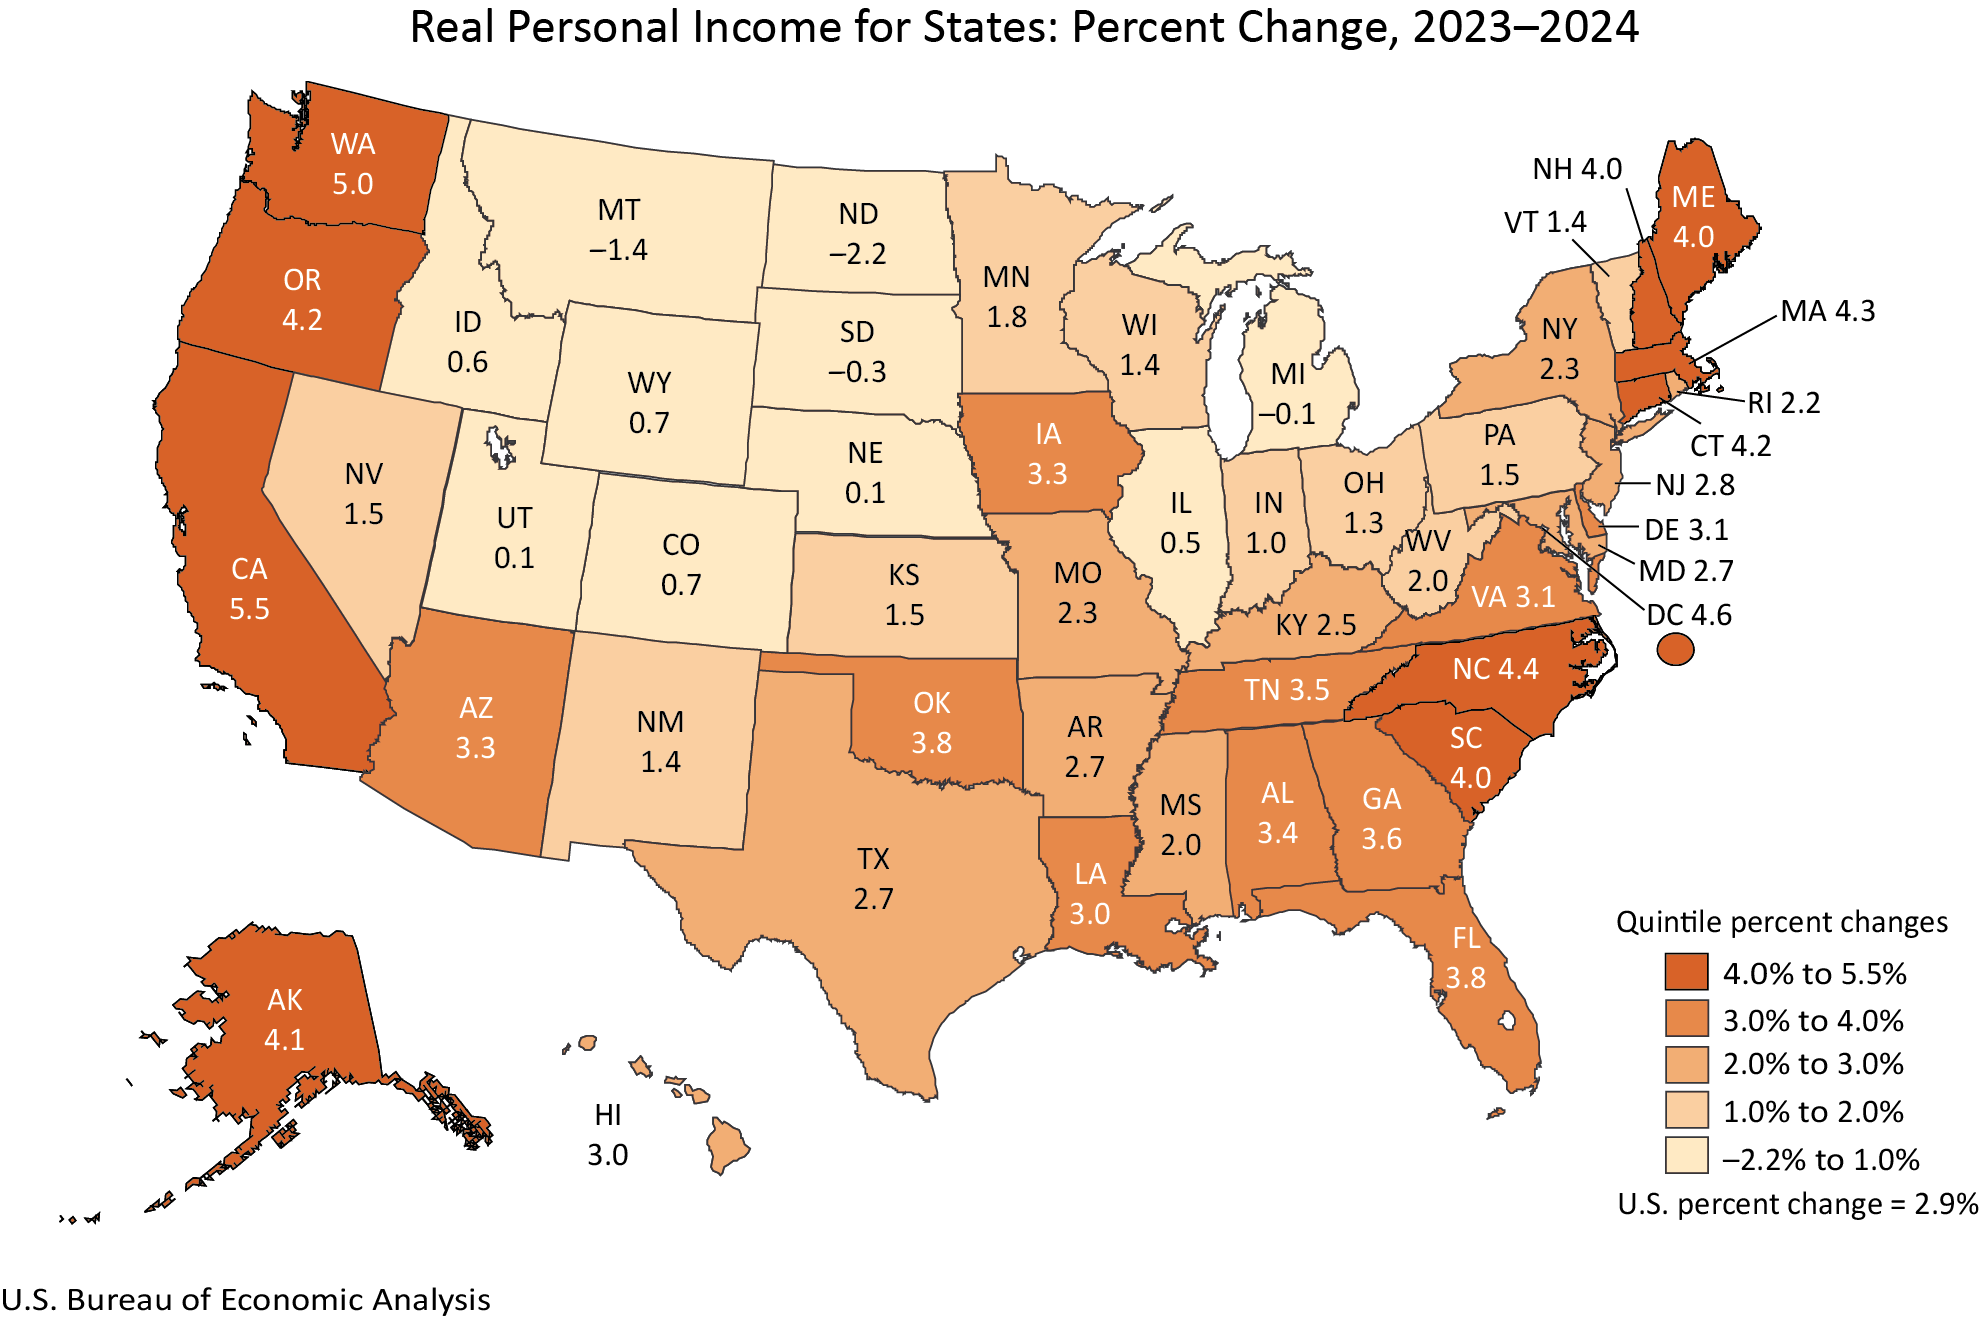
Complementing the trends in consumer spending, real personal income also demonstrated widespread growth across the nation. In 2024, 46 states and the District of Columbia experienced an increase in real personal income. This indicates that, for a majority of Americans, their earnings, adjusted for inflation, have risen, providing a foundation for continued consumption and economic activity.
California led the nation in real personal income growth, with an impressive 5.5 percent increase. This substantial gain suggests a strong economic performance in the Golden State, likely driven by its diverse economy, robust employment opportunities, and significant contributions from key sectors such as technology and entertainment.
On the other end of the spectrum, North Dakota saw a decline of 2.2 percent in real personal income. This downturn is notable and may reflect specific economic conditions within the state, potentially related to commodity prices, agricultural output, or shifts in its industrial base.
Similar to real PCE, real personal income for the nation as a whole increased by 2.9 percent in 2024, matching the growth rate of real PCE. Current-dollar personal income, however, saw a more substantial increase of 5.6 percent, exceeding the national PCE price index of 2.6 percent. This indicates that, on average, individuals’ nominal incomes grew faster than the general price level, leading to an increase in their real purchasing power.
The BEA calculates real personal income by adjusting current-dollar personal income with the regional price parity (RPP) and the national PCE price index. This adjustment is vital for accurately comparing income levels and growth across different regions, as it accounts for variations in the cost of living.
Regional Price Parities: Understanding the Cost of Living
The release also provides crucial insights into Regional Price Parities (RPPs), which measure the differences in price levels across states. RPPs are expressed as a percentage of the overall national price level, offering a standardized way to compare the cost of goods and services.
The "all items RPP," which encompasses all consumption goods and services including housing rents, is a key metric. Housing rents are frequently identified as a primary driver of variations in RPPs. This underscores the significant impact that housing affordability and market dynamics have on the overall cost of living in different regions. States with higher housing costs will naturally exhibit higher RPPs, meaning that a given amount of income will purchase less in those areas compared to states with lower housing expenses.
While the article does not explicitly state the RPP for all states, it highlights that these figures are available on the BEA website, along with metropolitan area RPP statistics. These data are invaluable for individuals considering relocation, businesses assessing operational costs, and policymakers formulating regional economic development strategies.
Revisions and Data Presentation Changes
A significant aspect of this year’s release is the comprehensive revision of annual estimates for real PCE by state and real personal income by state, spanning from 2008 to 2023. These revisions are a standard part of the BEA’s statistical process, incorporating more complete and detailed source data. This update aligns the state-level data with the annual updates of the National Income and Product Accounts (NIPA) and the Gross Domestic Product (GDP) by industry statistics, which were released on September 25, 2025, and the GDP, personal income, and PCE by state statistics released on September 26, 2025. This ensures a consistent and accurate historical record of economic activity.
Furthermore, the BEA has introduced new estimates of real per capita PCE and real per capita personal income for 2024. These per capita figures are calculated using U.S. Census Bureau population data and provide a valuable measure of economic well-being on an individual basis. The inclusion of data from 2020 through 2024 in these per capita calculations allows for a more consistent trend analysis during a period of significant demographic and economic shifts.
In a notable shift in data dissemination, the BEA has discontinued the publication of statistics for metropolitan statistical areas and metropolitan and nonmetropolitan portions for real PCE and real personal income. While these detailed breakdowns will no longer be included in the main release, real PCE and real personal income estimates will continue to be published by state. RPPs will still be available for both state and local areas. This change aims to streamline the release process and focus on broader state-level trends, while still providing some sub-state level detail through RPPs. A dedicated FAQ on the BEA website offers further clarification on this transition.
The presentation of tables within the news release has also undergone a change. Data previously published as embedded tables are now exclusively available through the BEA’s online Interactive Data Application. This move is intended to reduce duplication, enhance efficiency, and direct users to the BEA’s most comprehensive and flexible data tools. The online application allows for customizable tables, full time series access, and diverse download formats, including PDFs, Excel, and CSV files.
Broader Implications and Future Outlook
The comprehensive data released by the BEA provides a crucial lens through which to view the diverse economic realities across the United States. The widespread growth in real PCE and real personal income suggests a generally positive economic environment for many Americans. However, the variations between states highlight the importance of understanding regional economic dynamics.
For instance, states like Massachusetts and California, with their strong growth figures, may serve as models for economic development strategies, focusing on innovation, diversified industries, and workforce development. Conversely, states experiencing declines, such as Montana and North Dakota, may need to investigate the underlying causes and consider targeted interventions to stimulate their local economies.
The emphasis on RPPs also underscores the critical role of cost of living in shaping economic well-being. Even with rising incomes, if the cost of essential goods and services, particularly housing, increases at a faster pace, the real purchasing power of individuals can be eroded. Policymakers must consider both income growth and affordability when formulating strategies to improve economic outcomes for their constituents.
The discontinuation of metropolitan area-specific PCE and income data, while streamlining the release, may represent a loss of granular detail for some researchers and local economic development agencies. However, the continued availability of state-level data and RPPs for local areas should still provide valuable insights.
Looking ahead, the BEA has announced that the next release of real personal consumption expenditures and real personal income by state is scheduled for December 10, 2026, at 8:30 a.m. EST, which will supersede the 2024 data with the 2025 statistics. This regular update cycle ensures that policymakers, businesses, and the public have access to timely and relevant economic information to inform decision-making and understand the evolving U.S. economy. The historical data from this release will remain accessible in the BEA’s Data Archive for future reference.
In conclusion, the BEA’s 2024 state-level economic data paints a nuanced picture of the American economy, marked by broad-based growth in consumer spending and personal income, yet punctuated by significant regional variations and evolving data presentation practices. The insights gleaned from these statistics are essential for navigating the complexities of the modern economic landscape.