
 Lana Rhoades
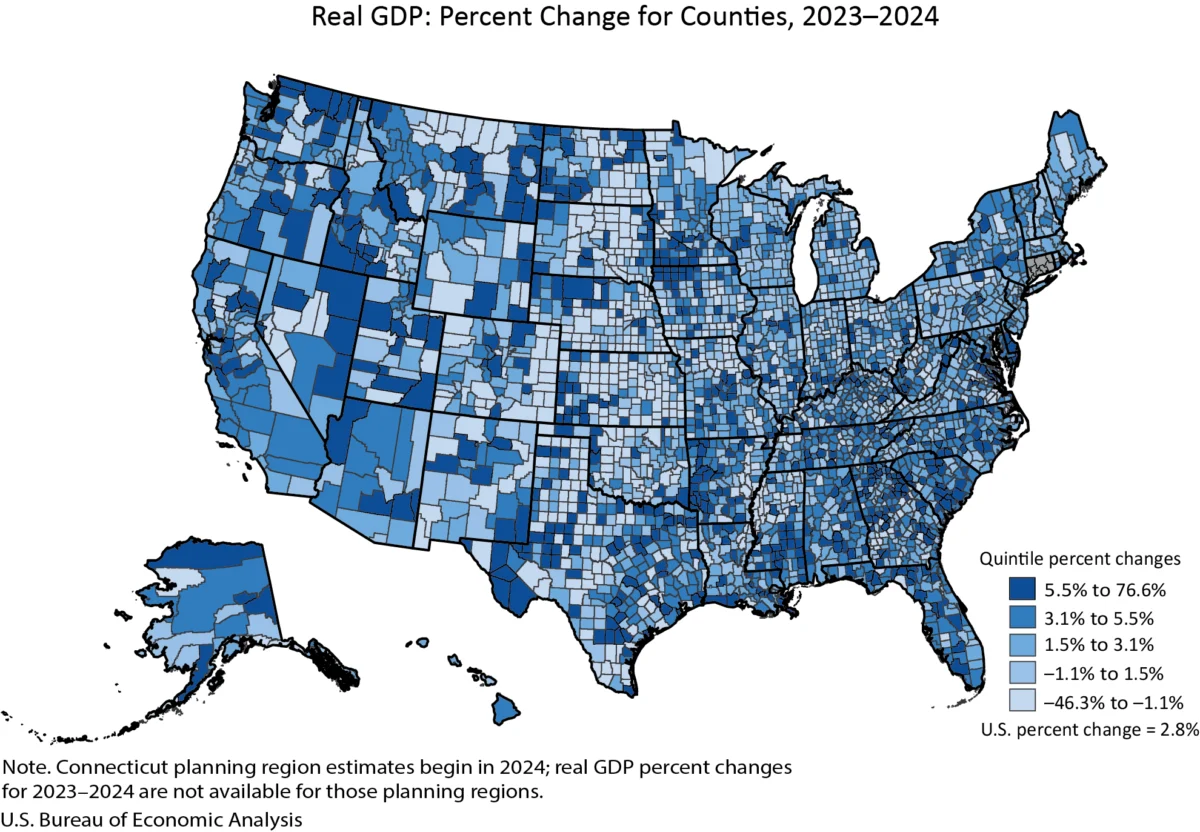
Real gross domestic product (GDP) experienced an uptick in 2,273 counties across the United States in 2024, signaling a broad-based economic expansion in a majority of local economies. Conversely, 809 counties saw their real GDP contract, and 24 reported no significant change, according to the latest estimates released by the U.S. Bureau of Economic Analysis (BEA). This uneven distribution of economic performance highlights the varied economic landscapes that characterize the nation, from burgeoning metropolises to struggling rural communities.
The magnitude of these economic shifts varied dramatically. Carter County, Montana, emerged as a standout performer, recording an impressive 76.6 percent surge in real GDP. This remarkable growth likely reflects a significant development or expansion within a key industry in the county. On the other end of the spectrum, Baca County, Colorado, faced considerable economic headwinds, with its real GDP declining by a substantial 46.3 percent. Such a steep downturn suggests significant challenges, potentially including the decline of a major employer, a downturn in a critical sector, or severe external economic shocks.
The U.S. Bureau of Economic Analysis, a primary source for economic statistics, meticulously tracks these county-level economic indicators. The agency’s comprehensive data collection and analysis provide crucial insights into the economic health and dynamism of communities nationwide. These figures are vital for policymakers, businesses, and researchers seeking to understand the intricate workings of the American economy at its most granular level.
Economic Landscape: Size and Scale of County Economies
The sheer scale of county economies, as measured by real GDP, presents a stark contrast across the nation. In 2024, New York County, New York, a global economic powerhouse, boasted a colossal real GDP of $813.7 billion. This figure underscores its role as a preeminent center for finance, commerce, and services. In sharp contrast, Issaquena County, Mississippi, registered a real GDP of just $15.7 million. This vast disparity in economic output reflects the diverse economic bases and population densities that define different regions of the United States.
The BEA’s data provides a granular view of these economic disparities, allowing for comparisons not only between the largest and smallest economies but also across various population strata. This level of detail is essential for targeted economic development strategies and for understanding the localized impacts of national economic trends.
County Real GDP Highlights, by Population Size, 2024
| Category | Large Counties (population > 500,000) | Medium Counties (population 100,000 to 500,000) | Small Counties (population < 100,000) |
|---|---|---|---|
| Trends (Number of Counties) | Growth: 145; Decline: 0; Unchanged: 1 | Growth: 451; Decline: 20; Unchanged: 3 | Growth: 1,677; Decline: 789; Unchanged: 20 |
| Trend Range (Percent Change) | 10.7% (Pinal County, AZ) to 0.0% (Johnson County, KS) | 12.4% (Jefferson County, TX) to -2.6% (Black Hawk County, IA) | 76.6% (Carter County, MT) to -46.3% (Baca County, CO) |
| Size Range (2017 chained dollars) | $813.7 billion (New York County, NY) to $12.7 billion (Pinal County, AZ) | $46.6 billion (Mercer County, NJ) to $2.6 billion (Liberty County, TX) | $15.1 billion (Martin County, TX) to $15.7 million (Issaquena County, MS) |
| Growth/Decline/No Change Indicators | Growth; Decline; No appreciable change | Growth; Decline; No appreciable change | Growth; Decline; No appreciable change |
Source: U.S. Bureau of Economic Analysis
Personal Income Trends Mirror GDP Performance
Accompanying the GDP figures, the BEA also released data on personal income, a crucial indicator of individual economic well-being. In 2024, personal income saw an increase in 2,768 counties, a decrease in 331 counties, and remained unchanged in 7 counties. This suggests that while overall economic activity (GDP) has a broad base of growth, the direct income experienced by residents shows a slightly more concentrated pattern of decline in a smaller, yet significant, number of counties.
The range of personal income changes also illustrated significant regional variations. Harding County, South Dakota, experienced a robust 22.6 percent increase in personal income, indicating a positive economic environment for its residents. Conversely, Issaquena County, Mississippi, which also registered a low GDP, saw its personal income decline by 23.3 percent. This dual impact on both GDP and personal income highlights the severe economic challenges faced by some of the nation’s smallest and most isolated communities.
County Personal Income Highlights, by Population Size, 2024
| Category | Large Counties (population > 500,000) | Medium Counties (population 100,000 to 500,000) | Small Counties (population < 100,000) |
|---|---|---|---|
| Trends (Number of Counties) | Growth: 146 | Growth: 474 | Growth: 2,148; Decline: 331; Unchanged: 7 |
| Trend Range (Percent Change) | 9.7% (San Joaquin County, CA) to 2.7% (Philadelphia County, PA) | 10.9% (Merced County, CA) to 1.6% (Genesee County, MI) | 22.6% (Harding County, SD) to -23.3% (Issaquena County, MS) |
| Size Range (Current Dollars) | $818.5 billion (Los Angeles County, CA) to $26.1 billion (Pinal County, AZ) | $62.5 billion (Collier County, FL) to $4.9 billion (Floyd County, GA) | $12.4 billion (Teton County, WY) to $10.6 million (Loving County, TX) |
| Growth/Decline/No Change Indicators | Growth; Decline; No appreciable change | Growth; Decline; No appreciable change | Growth; Decline; No appreciable change |
Source: U.S. Bureau of Economic Analysis
The total level of personal income also varied significantly, with Los Angeles County, California, leading the nation at $818.5 billion. At the other end of the spectrum, Loving County, Texas, recorded a personal income of $10.6 million. These figures reflect the substantial differences in economic opportunity and wealth accumulation across different parts of the country.
Methodology and Updates: A Refined Economic Picture
The 2024 estimates incorporate the results of BEA’s annual updates of GDP and personal income by county. These updates are critical for ensuring the accuracy and relevance of the data. The period from 2020 to 2023 has been revised, reflecting the incorporation of new and more comprehensive source data. This rigorous revision process aligns county-level statistics with broader national economic accounts, including the National Income and Product Accounts (NIPA) and state-level GDP and personal income statistics. These updates, released on September 25 and 26, 2025, respectively, provide a more complete and accurate picture of economic activity.
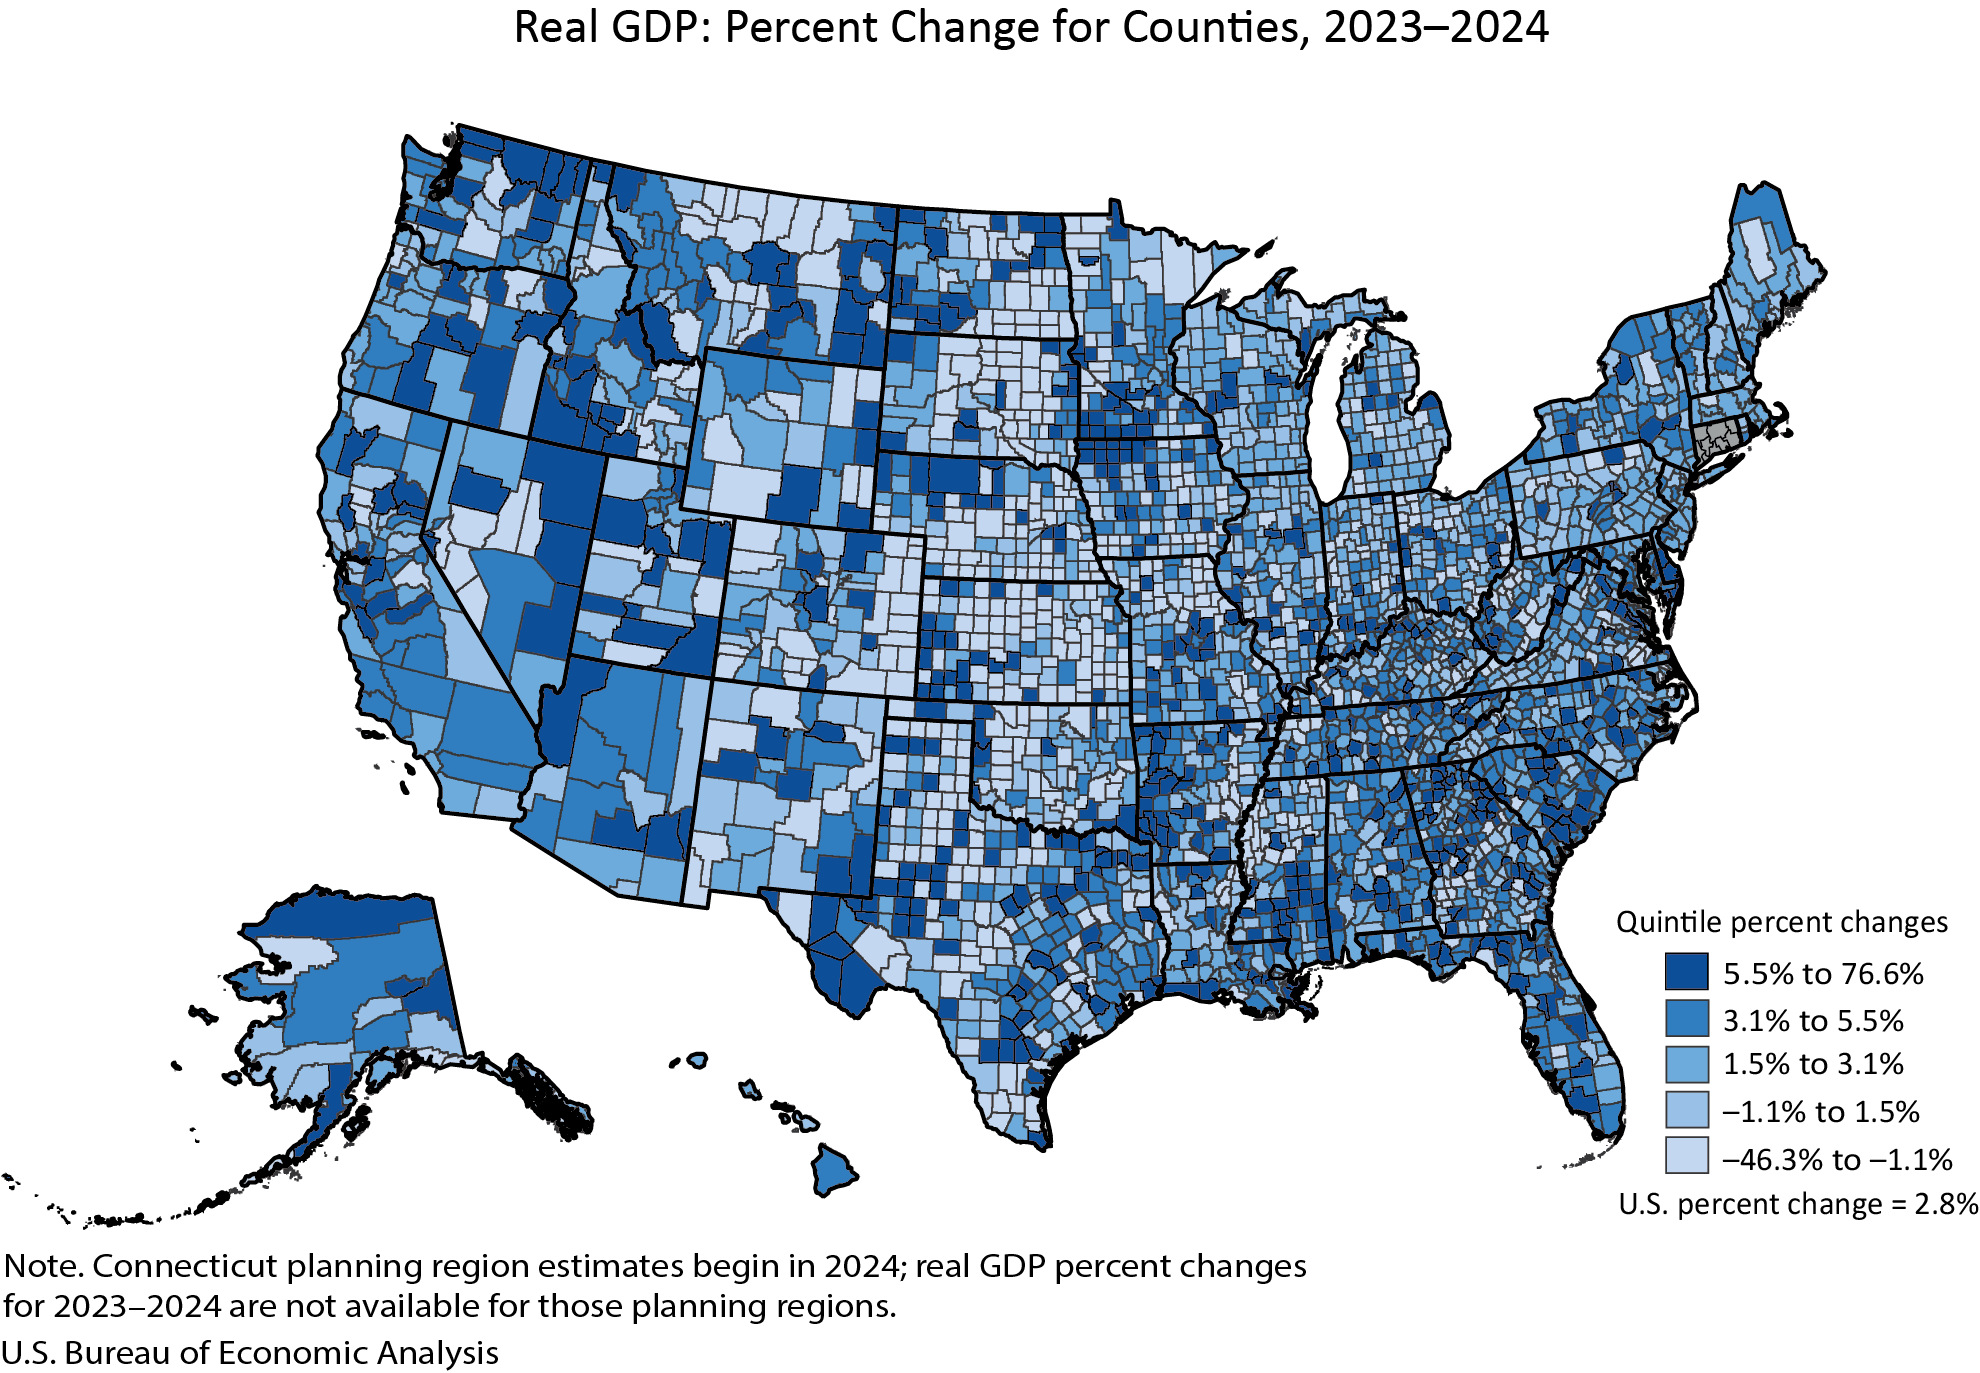
A notable methodological change for the 2024 estimates is the incorporation of Connecticut’s planning region geographic definitions, replacing traditional county boundaries. This shift, while not impacting the percent change calculations in the current release due to the availability of data for only one year, signifies a move towards more regionally aligned economic analysis in certain areas.
Furthermore, the BEA has introduced new estimates for per capita personal income for 2024, calculated using U.S. Census Bureau population figures for the period 2020 through 2024. Per capita personal income offers a valuable metric for understanding the average economic well-being of residents within a given area.
Consolidated Reporting and Data Accessibility
In a significant move towards streamlined reporting, the BEA has published its annual GDP and personal income by county statistics in a single, combined news release for the first time. This consolidation aims to provide a more holistic view of county economies and replaces the previous practice of issuing two separate releases on different dates.
This integrated approach enhances efficiency and offers data users a more comprehensive understanding of the economic dynamics at play within each county. The agency also emphasizes that detailed data tables, previously embedded within news releases, are now exclusively available through BEA’s Interactive Data Application. This online platform provides customizable tables with full time series, downloadable in various formats (PDF, Excel, CSV), offering greater flexibility and direct access to the most current and comprehensive data. This shift encourages users to engage with the agency’s robust online data tools.
Discontinuation of Metropolitan Area Statistics
With the release of the 2024 county-level data, the BEA has announced the discontinuation of its publication of statistics for metropolitan statistical areas, micropolitan statistical areas, metropolitan divisions, combined statistical areas, and metropolitan and nonmetropolitan portions. While GDP and personal income estimates will continue to be available by county, this change signifies a strategic shift in the agency’s reporting focus. A dedicated FAQ on the BEA website provides further details on this transition.
Looking Ahead: Future Releases and Data Archiving
The BEA’s commitment to providing timely and accurate economic data is ongoing. The next release of GDP and personal income by county statistics, covering the year 2025, is scheduled for December 2, 2026. Following this release, the 2024 data will be superseded. For access to historical data, including the original figures from this release, users are directed to BEA’s Data Archive.
Broader Economic Implications and Analysis
The divergence in county-level economic performance in 2024 offers a complex tapestry of the American economy. The widespread growth in real GDP suggests that many sectors and regions are benefiting from prevailing economic conditions, potentially driven by consumer spending, investment, and robust labor markets. The significant number of counties experiencing declines, however, points to persistent structural challenges in certain areas. These areas may be reliant on industries facing global competition, technological disruption, or environmental constraints.
The personal income data further illuminates the nuances of economic well-being. While GDP measures the total value of goods and services produced, personal income reflects the income received by individuals and households. A disparity between GDP growth and personal income stagnation or decline in some counties could indicate issues related to income inequality, wage stagnation, or a concentration of profits within larger corporations rather than broad-based household benefit.
The BEA’s commitment to refining its data collection and presentation, including the move to a combined news release and the enhanced Interactive Data Application, reflects an effort to make complex economic information more accessible and useful. The discontinuation of metropolitan area statistics, while representing a change in reporting, underscores a strategic prioritization of granular county-level data, which is often more directly relevant for local economic development initiatives and policy-making.
Understanding these county-level trends is crucial for a variety of stakeholders. Local governments can use this data to identify areas needing targeted investment, workforce development programs, or infrastructure improvements. Businesses can leverage these insights for strategic planning, site selection, and market analysis. Federal and state policymakers can use the information to design more effective economic stimulus packages, support programs for distressed communities, and foster equitable growth across the nation. The detailed breakdown provided by the BEA serves as an indispensable tool for navigating the multifaceted economic realities of the United States.