
 Lana Rhoades
The U.S. Bureau of Economic Analysis (BEA) today unveiled its comprehensive annual statistics for 2024, providing a detailed look at real personal consumption expenditures (PCE), real personal income, and regional price parities (RPPs) across all 50 states and the District of Columbia. This release offers a crucial snapshot of economic activity at the state level, reflecting trends in consumer spending, individual earnings, and the cost of living throughout the nation. The data comes as part of the BEA’s ongoing commitment to providing granular economic insights that inform policymakers, businesses, and the public.
National Economic Performance and State-Level Divergence
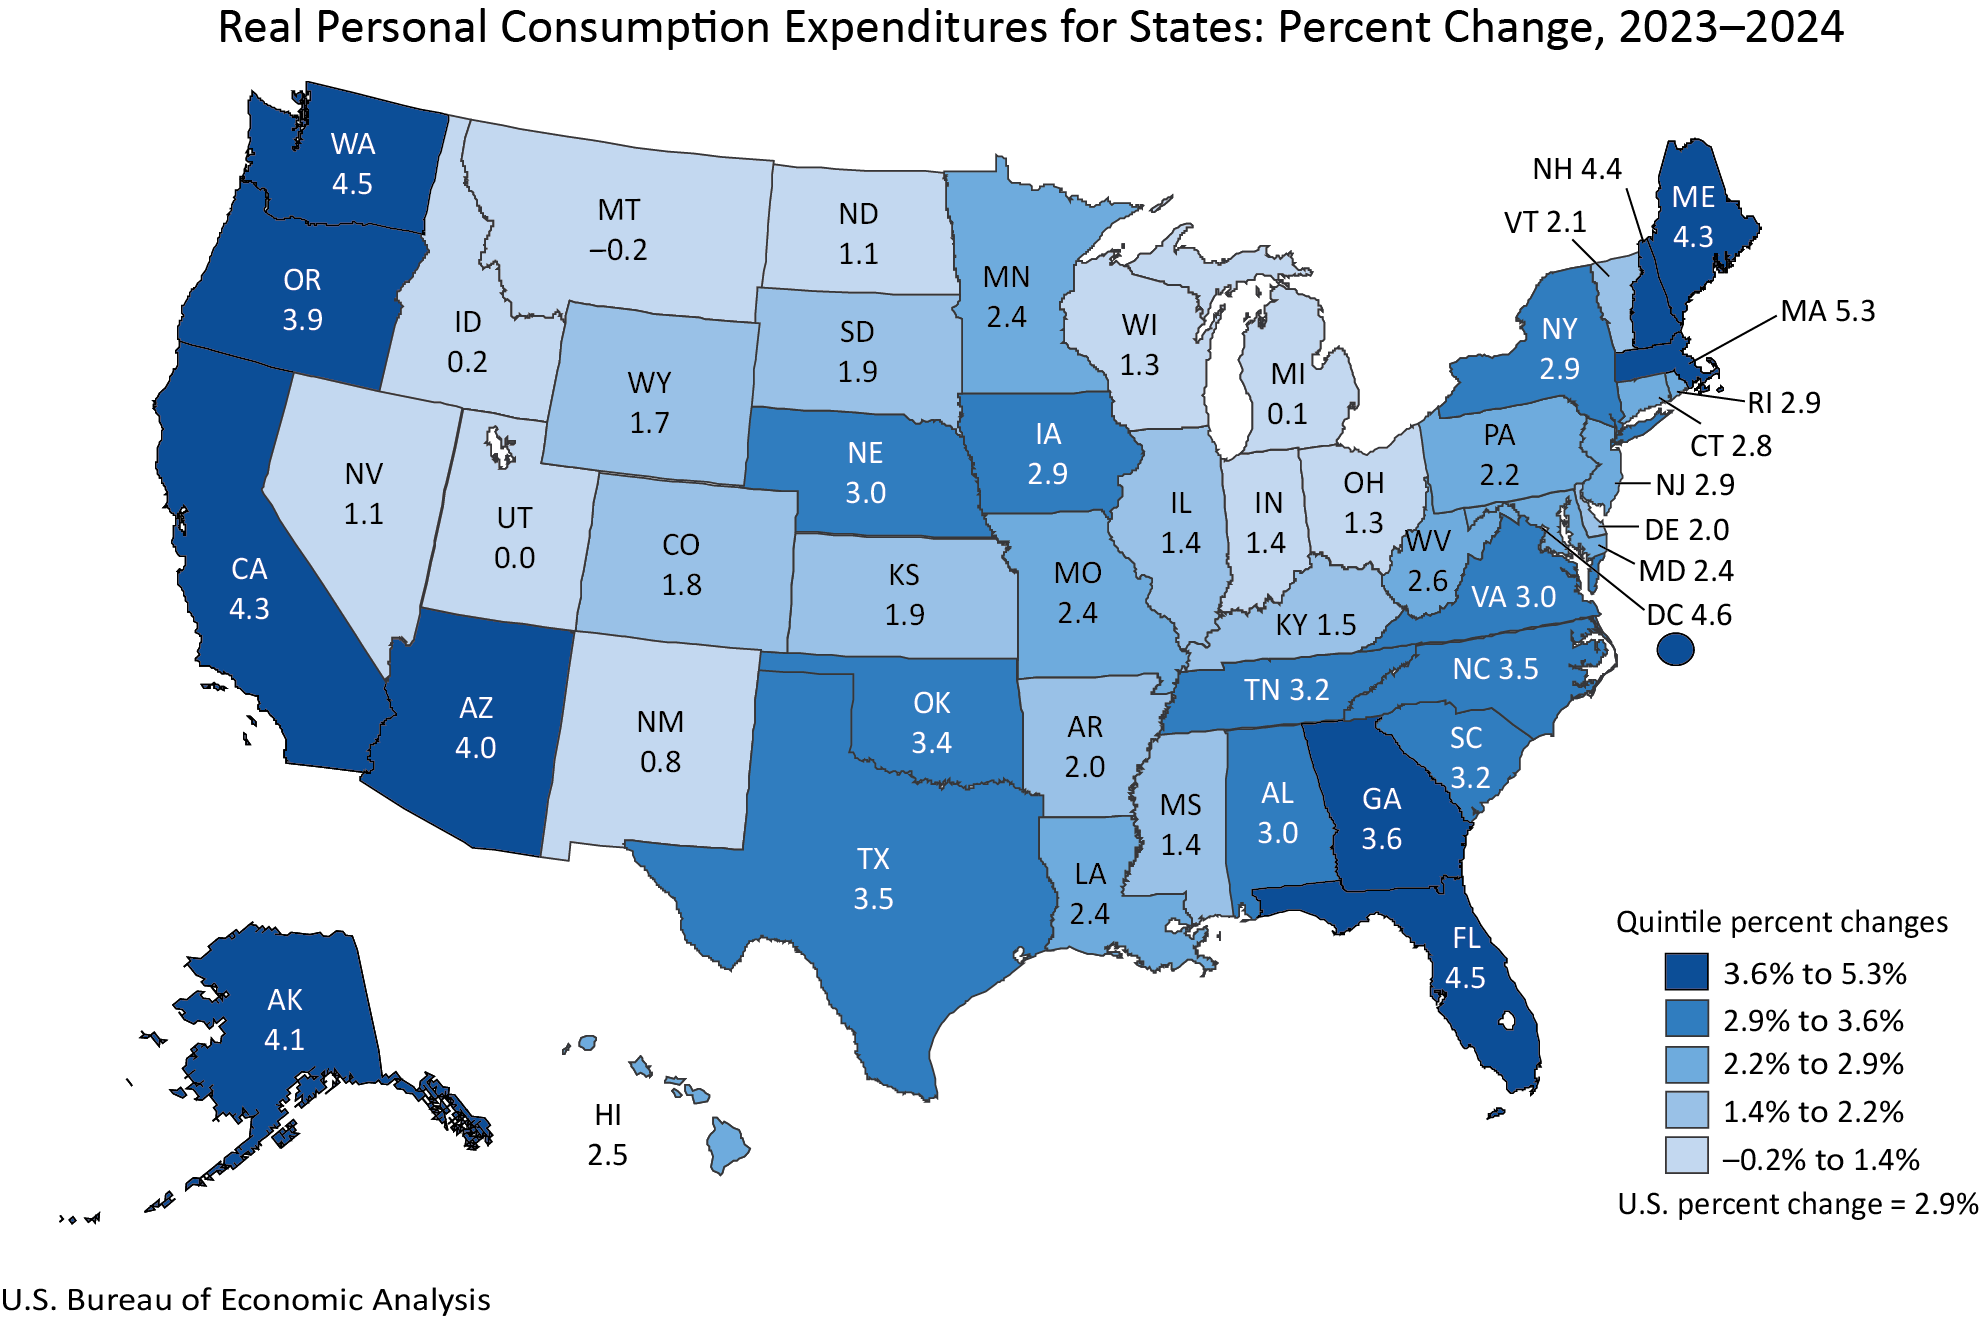
Nationally, real personal consumption expenditures saw a modest increase of 2.9 percent in 2024. This figure represents the value of goods and services purchased by individuals, adjusted for inflation. The underlying data reveals that current-dollar PCE, which reflects nominal spending, grew by 5.6 percent. This disparity between real and current-dollar growth indicates that the national PCE price index, a key measure of inflation for consumer goods and services, rose by approximately 2.6 percent.
While the national picture shows steady growth, the state-level data highlights significant regional variations. Real PCE increased in a substantial 48 states and the District of Columbia, underscoring a broad-based pattern of consumer spending growth. However, the magnitude of this growth varied considerably. Massachusetts led the nation with a robust 5.3 percent increase in real PCE, signaling strong consumer confidence and purchasing power in the Commonwealth. In stark contrast, Montana experienced a slight contraction of -0.2 percent in real PCE, suggesting potential headwinds or a leveling off of consumer spending in that state.
These fluctuations in real PCE are influenced by a multitude of factors, including regional employment trends, wage growth, housing costs, and consumer sentiment. The BEA’s methodology accounts for these nuances by adjusting current-dollar estimates with regional price parities, which reflect price level differences between states, and the national PCE price index, thereby providing a more accurate comparison of purchasing power.
Real Personal Income Shows Widespread Gains
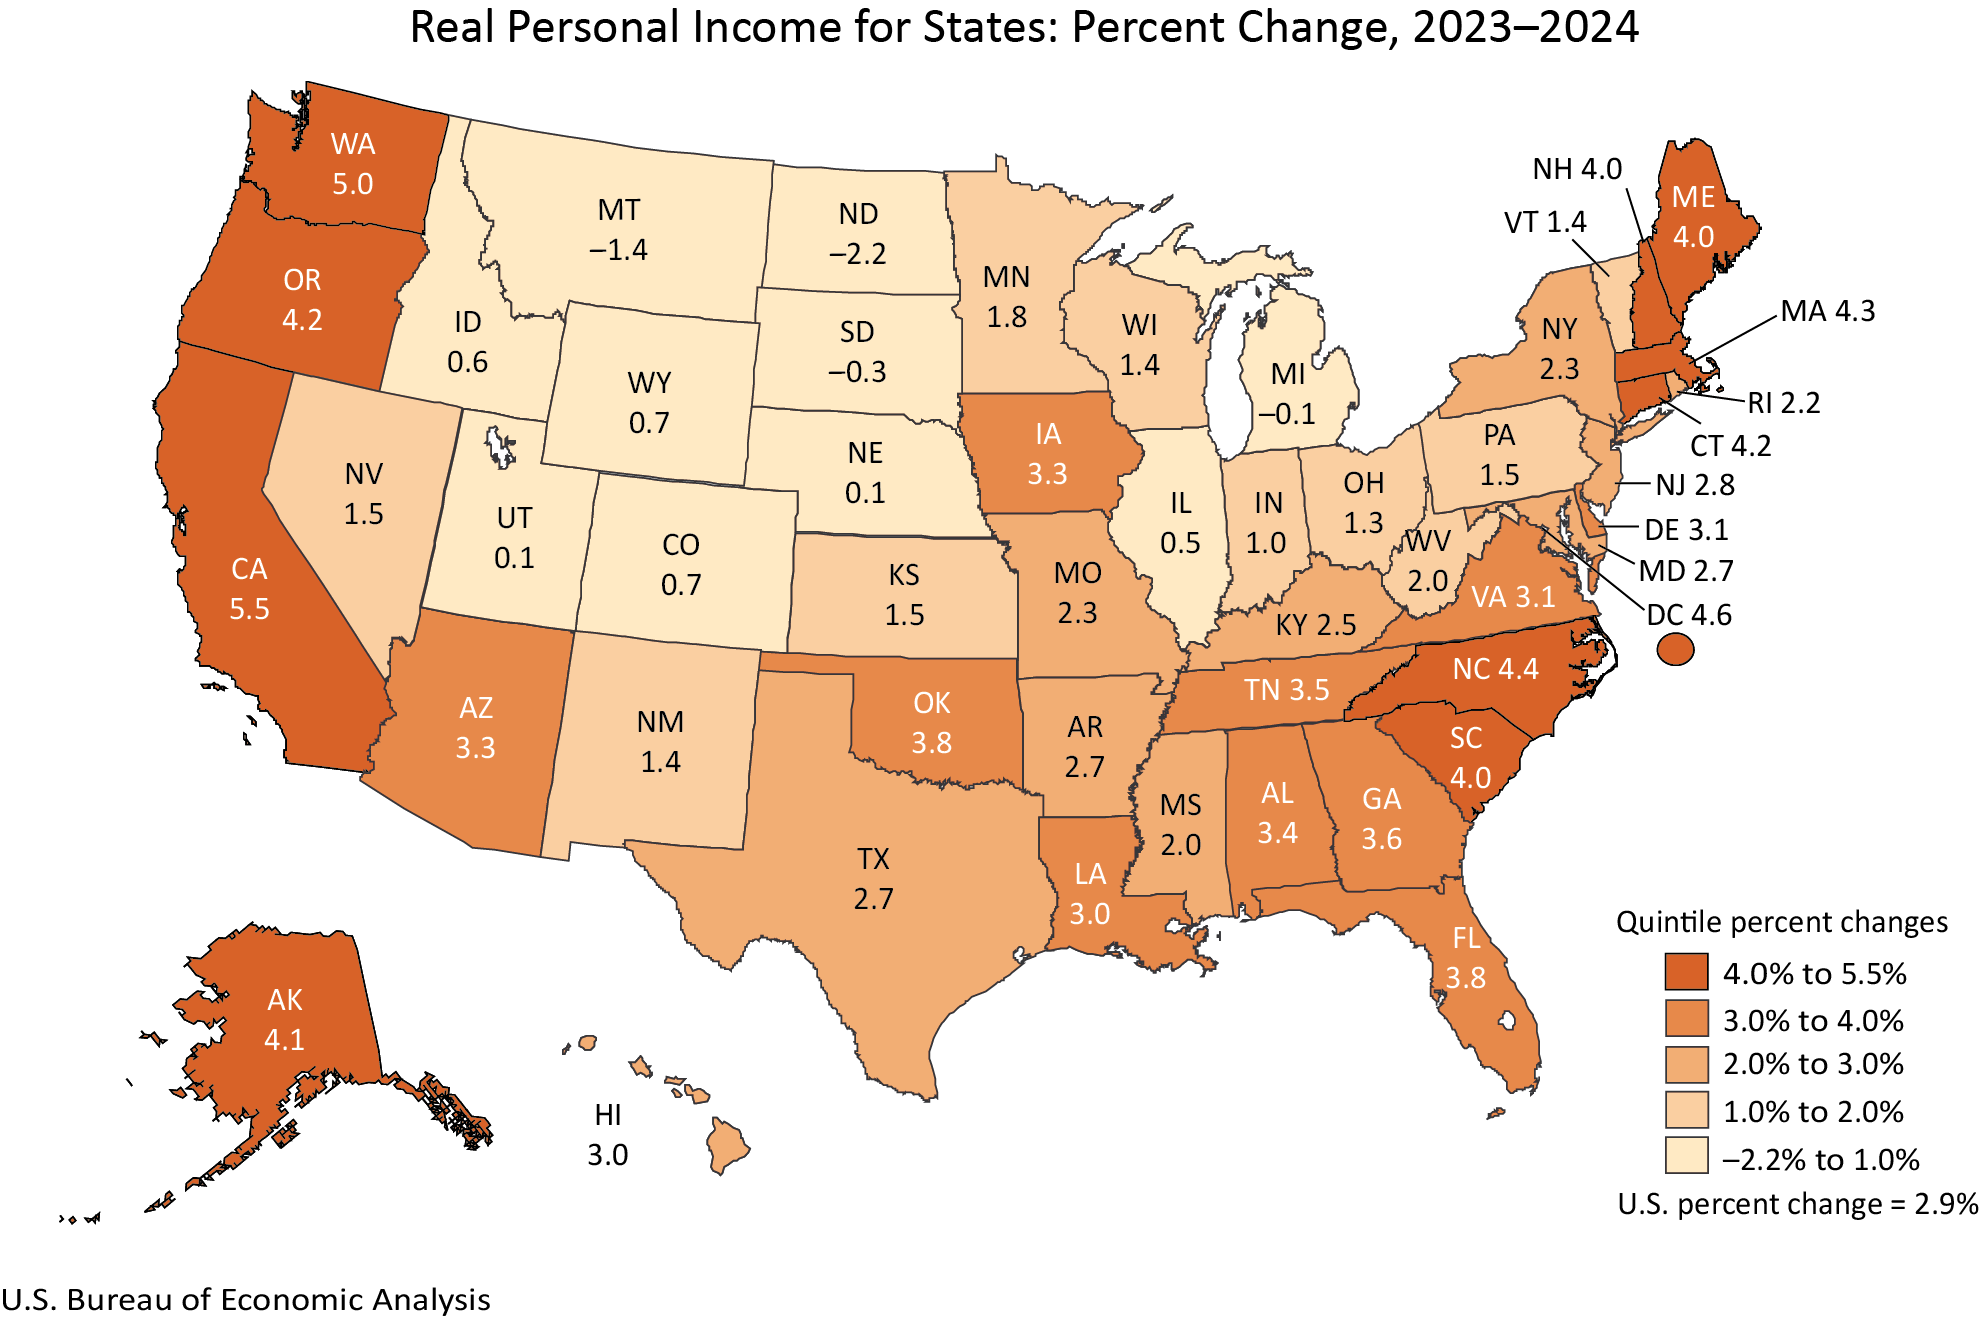
Complementing the consumption data, the BEA’s report on real personal income reveals a similar pattern of widespread growth, albeit with its own set of divergences. Real personal income, which measures the income received by individuals from all sources, adjusted for inflation and taxes, increased in 46 states and the District of Columbia. This indicates that, on average, individuals across most of the country saw their purchasing power increase.
California stood out with the highest percentage increase in real personal income, at 5.5 percent. This strong performance in the Golden State reflects its dynamic economic landscape and potentially robust job growth and wage increases. On the other end of the spectrum, North Dakota experienced a decline of -2.2 percent in real personal income. Such a contraction could be attributed to various factors, including fluctuations in key industries, out-migration, or a decrease in wage growth relative to inflation.
Similar to PCE, national real personal income grew by 2.9 percent in 2024. Current-dollar personal income saw a more substantial increase of 5.6 percent nationally, again outpacing the national PCE price index of 2.6 percent. This suggests that, on average, personal income growth outpaced inflation across the nation, contributing to an increase in real disposable income. The BEA’s calculation of real personal income incorporates adjustments for regional price levels, allowing for a more accurate assessment of how much individuals can actually purchase with their earnings in their respective states.
Regional Price Parities: Understanding the Cost of Living
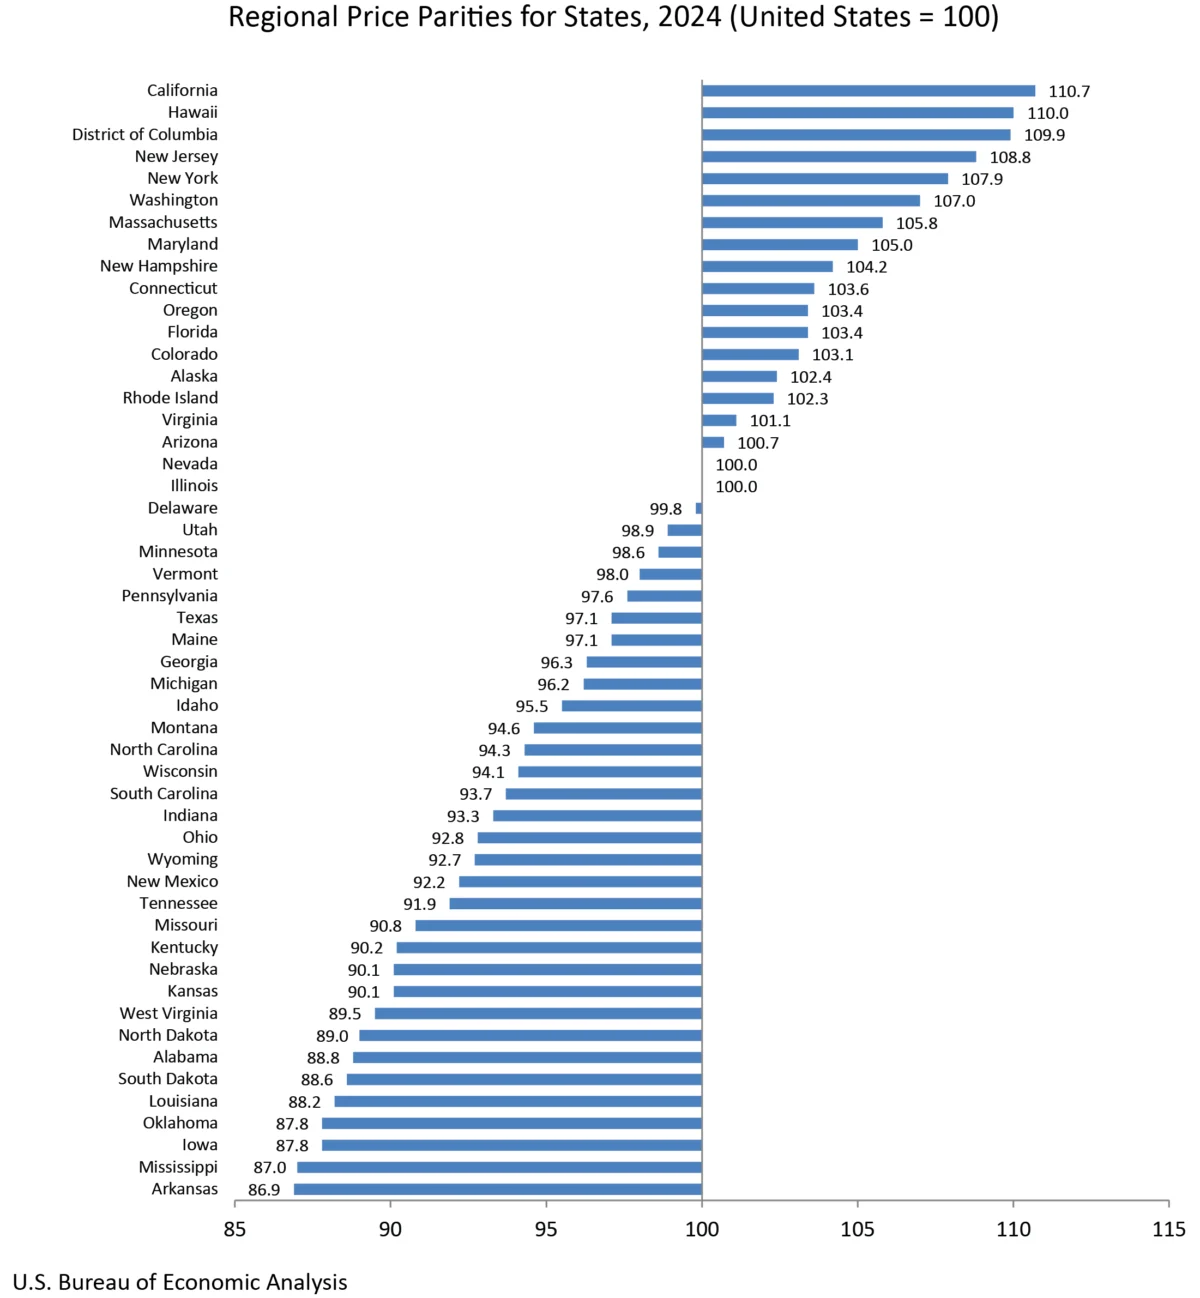
The release also includes updated regional price parities (RPPs), which are critical for understanding the true cost of living across different states. RPPs measure the differences in price levels for a basket of goods and services among geographic areas, expressed as a percentage of the overall national price level. For 2024, these figures provide insight into how much more or less expensive it is to maintain a certain standard of living in one state compared to another.
The "all items RPP" encompasses all consumption goods and services, with housing rents often playing a significant role in driving price disparities. For instance, states with high housing costs typically exhibit higher RPPs, meaning a dollar spent on goods and services there buys less than in states with lower housing expenses. The BEA provides these RPPs as index numbers, allowing for direct comparison. Detailed RPP statistics for metropolitan areas are also available on the BEA website, offering an even more granular view of cost-of-living variations.
Revisions and Methodological Updates
A significant aspect of this annual release is the revision of historical data. The BEA has updated its annual estimates of real PCE and real personal income by state for the period from 2008 to 2023. These revisions are a standard practice and are crucial for maintaining data accuracy. They incorporate newly available and revised source data, which are often more comprehensive and detailed than preliminary estimates. These updates ensure that the state-level statistics align with the annual revisions of the National Income and Product Accounts (NIPA) and Gross Domestic Product (GDP) by industry statistics, which were released on September 25, 2025, and GDP, personal income, and PCE by state statistics released on September 26, 2025. This process of regular revision is vital for ensuring the integrity and reliability of economic indicators.
Furthermore, the BEA has released new estimates for real per capita PCE and real per capita personal income for 2024. These per capita figures are derived by dividing the total real PCE and real personal income by population estimates provided by the U.S. Census Bureau. These per capita measures offer valuable insights into the average economic well-being of individuals within each state, adjusting for population size. The population figures used for these calculations span from 2020 through 2024.
Changes in Data Publication
In a notable shift in its reporting practices, the BEA has announced the discontinuation of publishing statistics for metropolitan statistical areas and their metropolitan and nonmetropolitan portions. While real PCE and real personal income will continue to be reported at the state level, and RPPs will still be available for state and local areas, the more granular metropolitan-level data for these specific indicators will no longer be included in the standard releases. This decision aims to streamline data dissemination and reduce redundancy, with users encouraged to consult the BEA’s Interactive Data Application for more comprehensive and customizable data sets.
The BEA has also updated its presentation of tables. Data previously embedded within news releases are now exclusively available through its online Interactive Data Application. This move is intended to increase efficiency and provide users with direct access to the BEA’s most complete and flexible data tables. These customizable tables allow for the selection of full time series and can be downloaded in various formats, including PDF, Excel, and CSV. This digital-first approach reflects a broader trend in data reporting, emphasizing accessibility and user-driven analysis.
Broader Economic Context and Implications
The release of these state-level economic statistics arrives at a time of ongoing national economic adaptation. Following a period of significant disruption, understanding regional economic resilience and growth patterns is more critical than ever. The divergence in real PCE and personal income growth across states suggests that different regions are experiencing the current economic climate in distinct ways.
States with strong growth in real PCE, such as Massachusetts, may be benefiting from robust labor markets, high levels of investment, or sectors that are particularly resilient to economic downturns. Conversely, states experiencing stagnation or decline in real PCE might be facing challenges related to industry shifts, higher inflation eroding purchasing power, or a more cautious consumer base.
Similarly, the variations in real personal income growth point to differing patterns of wage development and employment opportunities. A state like California’s strong performance could be indicative of a thriving technology sector or a vibrant service economy, while a state like North Dakota’s decline might reflect a dependency on commodity prices or a slowdown in key industries.
The RPP data, in conjunction with income and spending figures, provides a more complete picture of economic well-being. A state might show high nominal income growth, but if its RPP is also high, the real purchasing power of that income might not translate into significant improvements in living standards. Understanding these price level differences is crucial for accurate comparisons of economic prosperity.
Looking Ahead
The BEA has also provided a forward-looking statement regarding its data release schedule. The next update for real personal consumption expenditures by state and real personal income by state is scheduled for December 10, 2026, at 8:30 a.m. EST, and will cover the 2025 data. Upon that release, the 2024 data will be superseded, and the links provided in this release will be updated to reflect the latest available information. Historical data from the current release will then be accessible through the BEA’s Data Archive.
This continuous cycle of data collection, revision, and release is fundamental to the BEA’s mission of providing timely and accurate economic statistics. These figures are not merely numbers; they are essential tools for understanding the economic health of the nation and its constituent parts, guiding policy decisions, and informing strategic planning for businesses and individuals alike. The detailed insights offered by the 2024 state-level data will undoubtedly contribute to a more nuanced understanding of the American economy as it navigates the complexities of the current landscape.
The BEA’s commitment to providing these detailed regional economic indicators underscores their importance in comprehending the diverse economic realities across the United States. By offering data on spending, income, and the cost of living, the agency equips stakeholders with the necessary information to make informed assessments and strategic decisions. The ongoing revisions and methodological refinements ensure that these statistics remain a reliable and up-to-date resource for economic analysis.