

Washington D.C. – The United States Bureau of Economic Analysis (BEA) has released its latest comprehensive report detailing the economic significance of the nation’s outdoor recreation sector. In 2024, the outdoor recreation economy contributed an impressive $696.7 billion to the current-dollar Gross Domestic Product (GDP), representing a substantial 2.4% of the total national economic output. This figure underscores the sector’s robust and growing influence on American commerce.
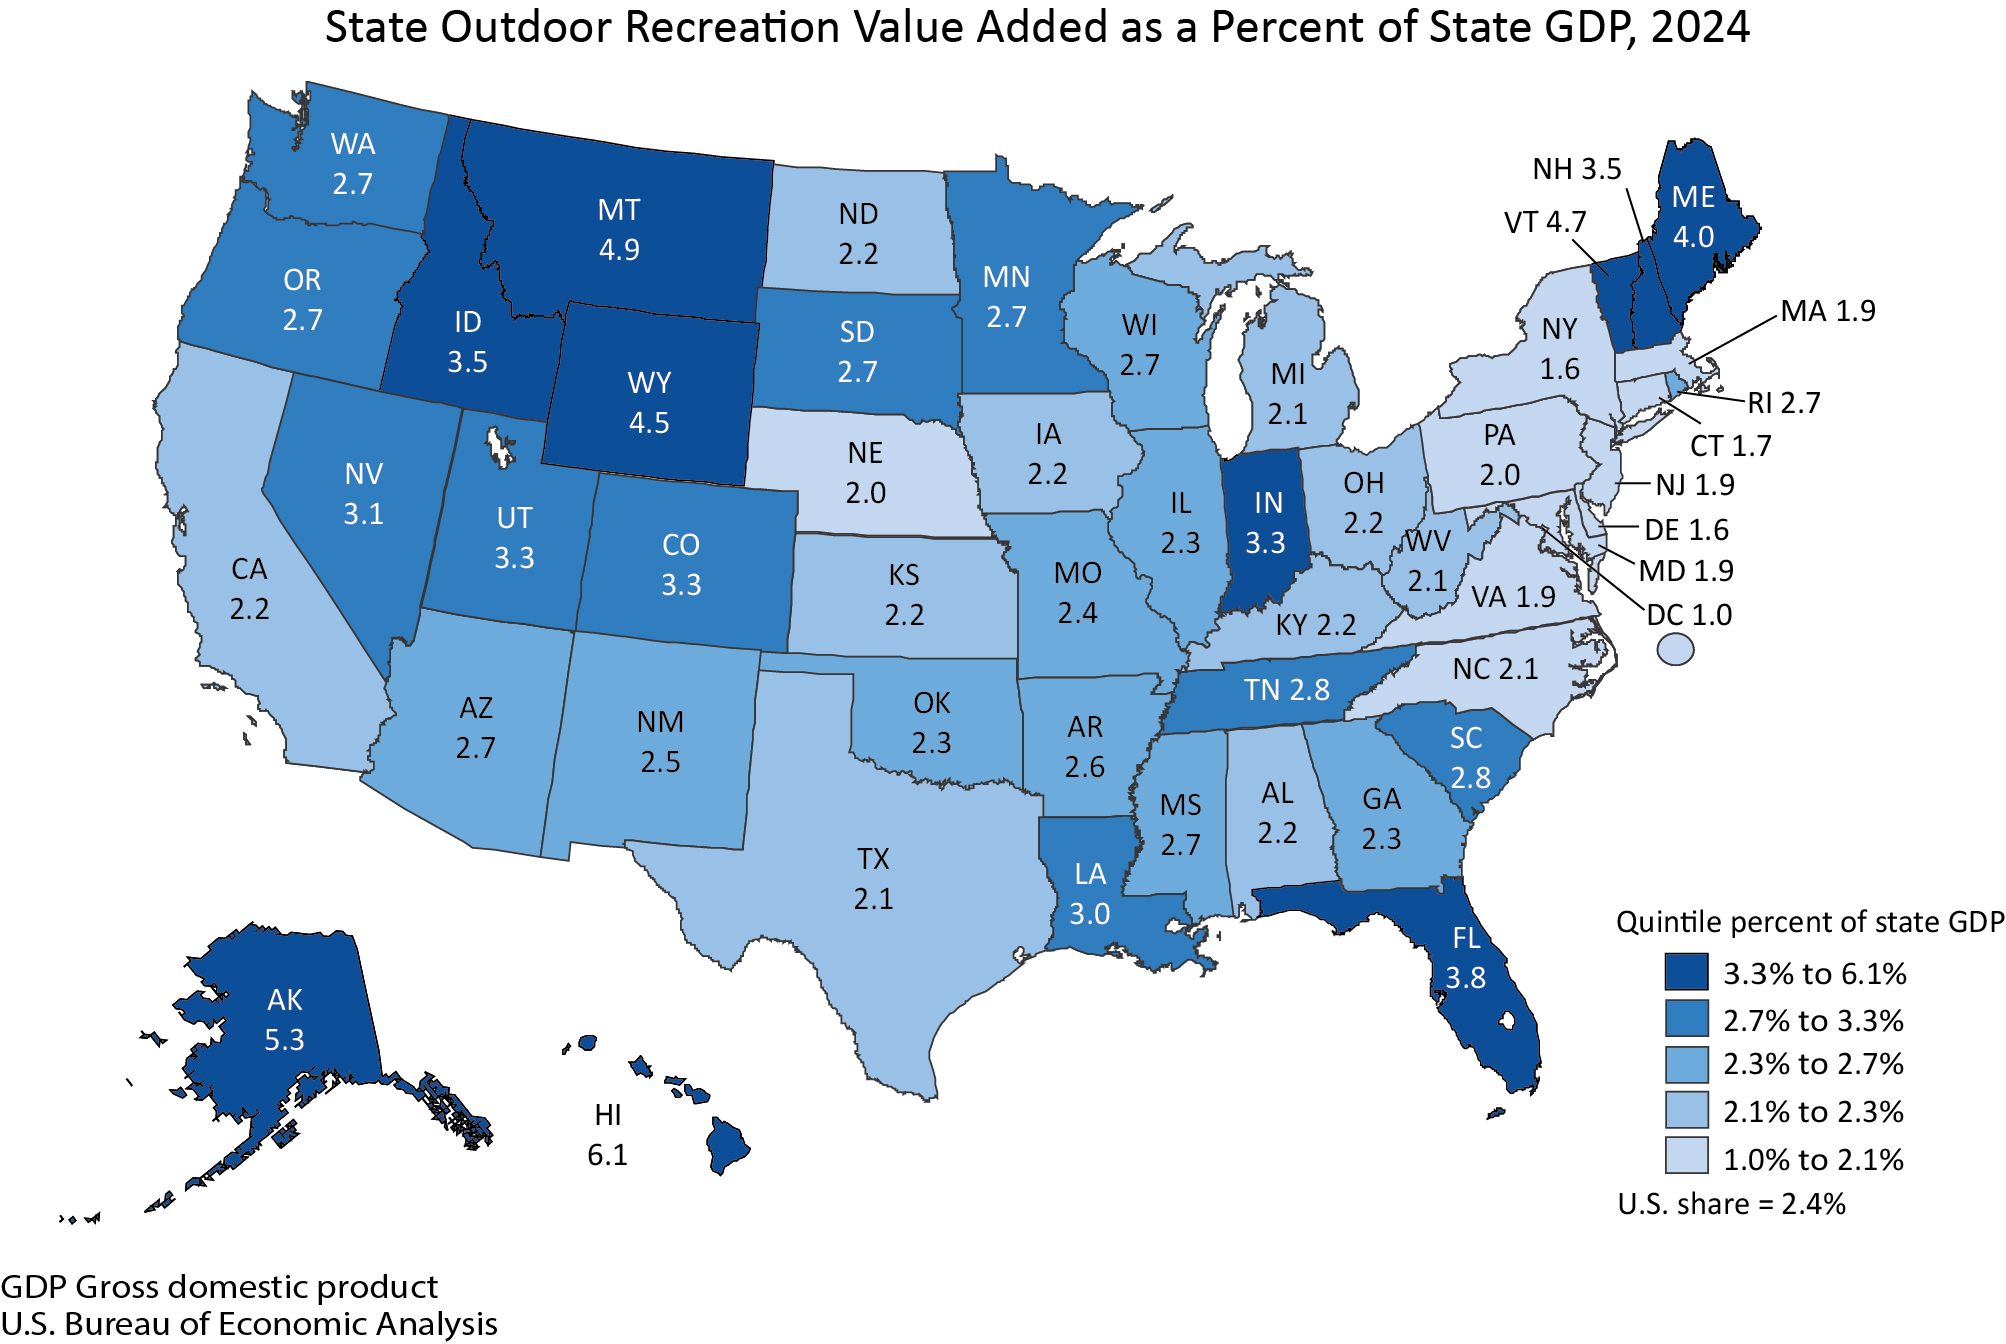
The newly published data, encompassing all 50 states and the District of Columbia, reveals a diverse economic landscape for outdoor recreation. At the state level, the contribution of outdoor recreation to state GDP varied considerably. Hawaii emerged as the leader, with its outdoor recreation economy accounting for a remarkable 6.1% of its state GDP. In contrast, the District of Columbia’s outdoor recreation sector represented 1.0% of its GDP, reflecting different economic structures and opportunities across the country.
National Economic Performance of Outdoor Recreation in 2024
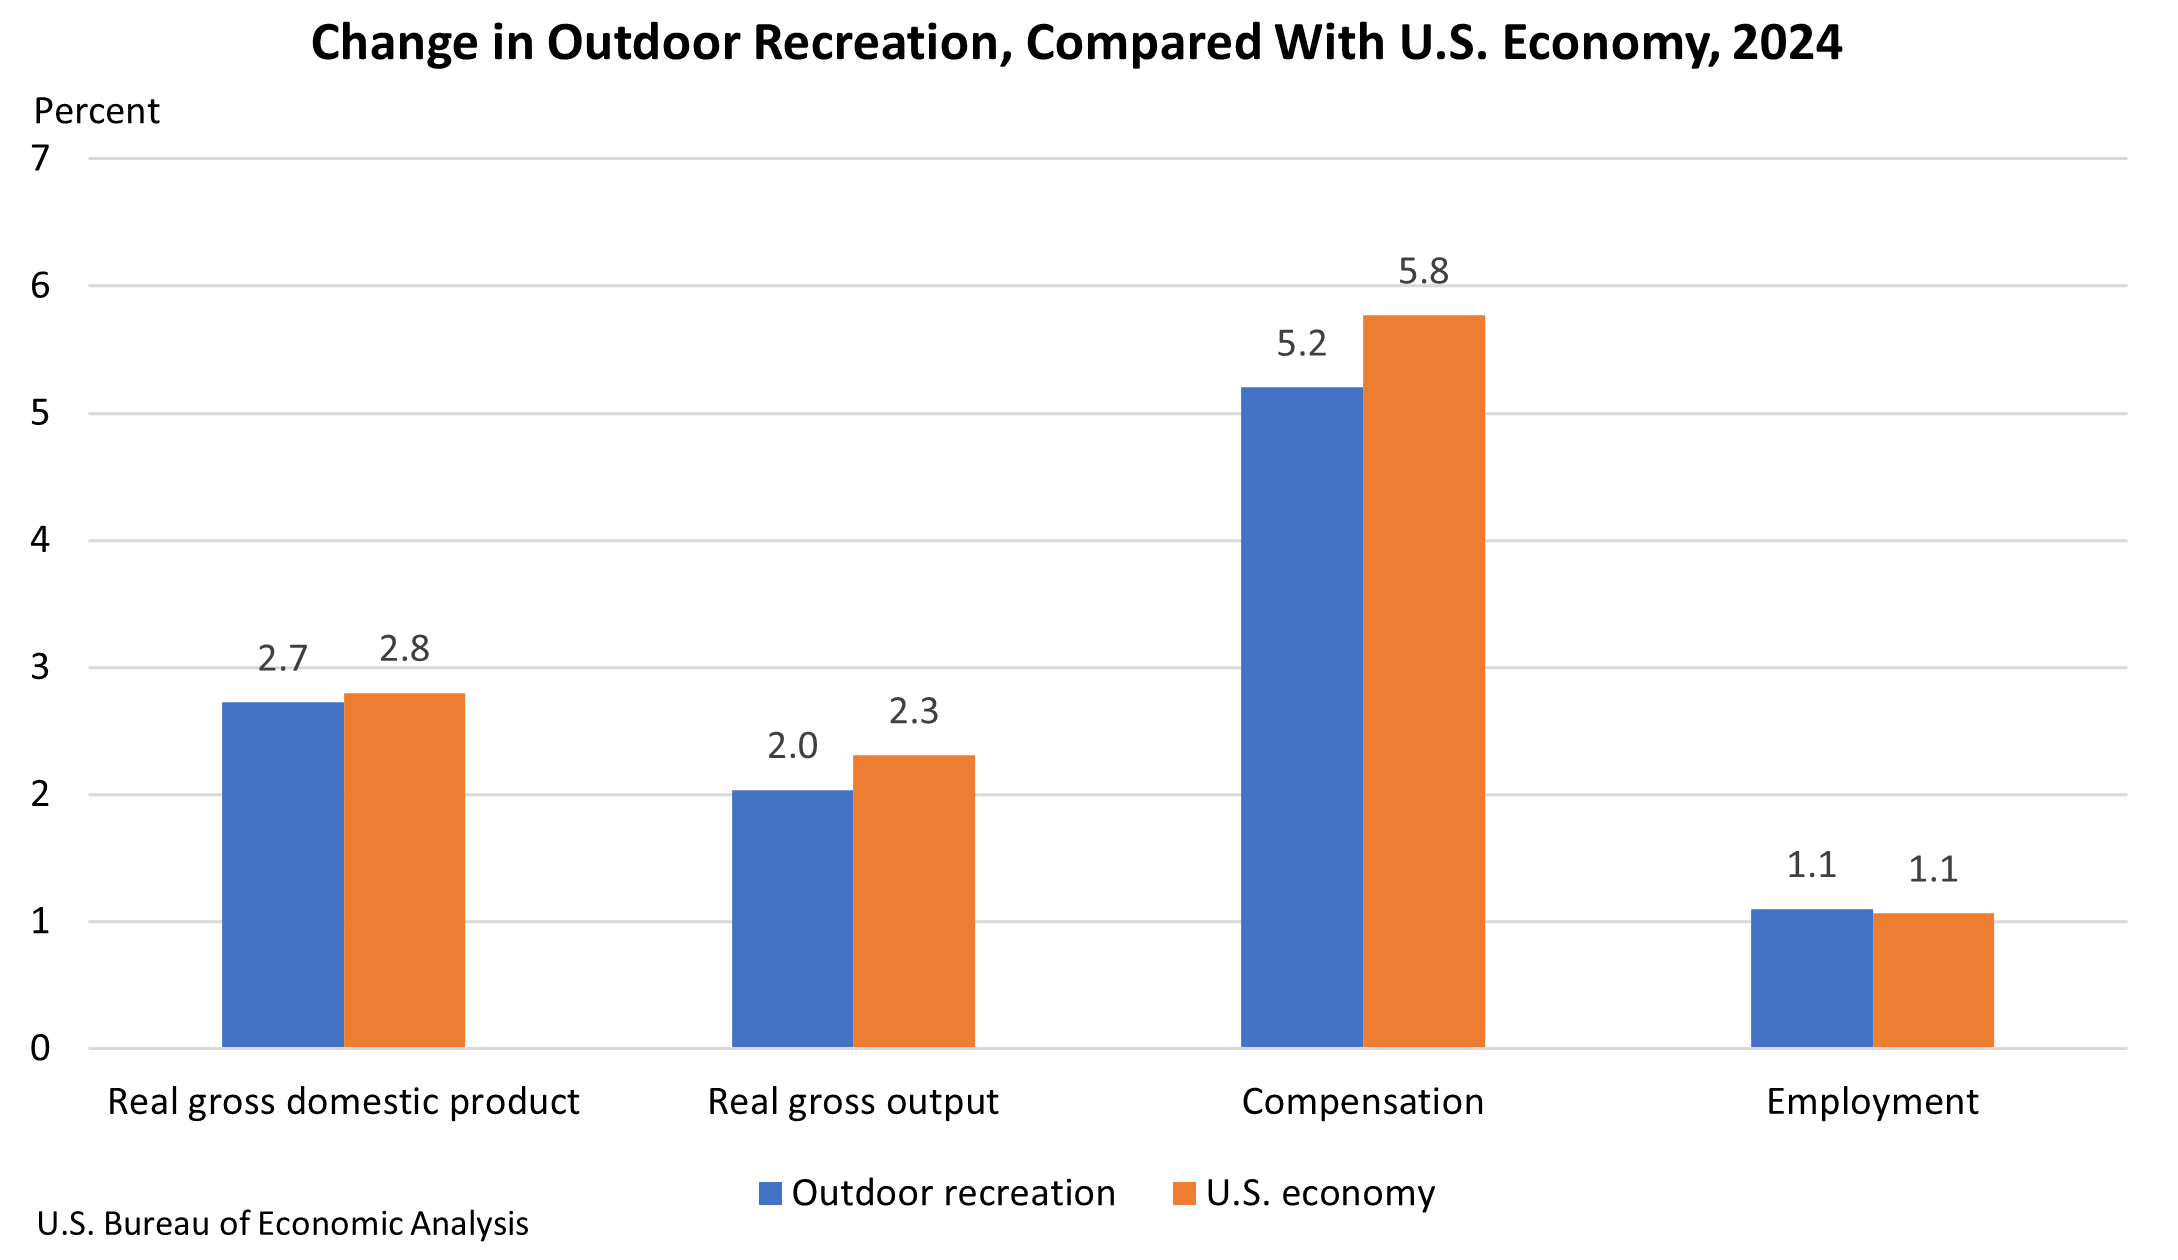
On a national scale, the inflation-adjusted (real) GDP for the outdoor recreation economy saw a healthy increase of 2.7% in 2024. This growth rate, while slightly trailing the overall U.S. economy’s 2.8% expansion, indicates a steady and consistent upward trajectory for the sector. It is important to note that this growth represents a moderation from the more dynamic 5.3% increase observed in 2023, suggesting a period of stabilization or maturation within the sector following a potentially exceptional prior year.
Further illuminating the sector’s performance, real gross output for outdoor recreation experienced a 2.0% increase. Compensation within the outdoor recreation industry also saw significant gains, rising by 5.2%, and employment within the sector grew by 1.1%. These figures collectively paint a picture of an expanding industry that is not only generating substantial economic value but also creating jobs and providing increased earnings for its workforce.
Employment Trends Across States
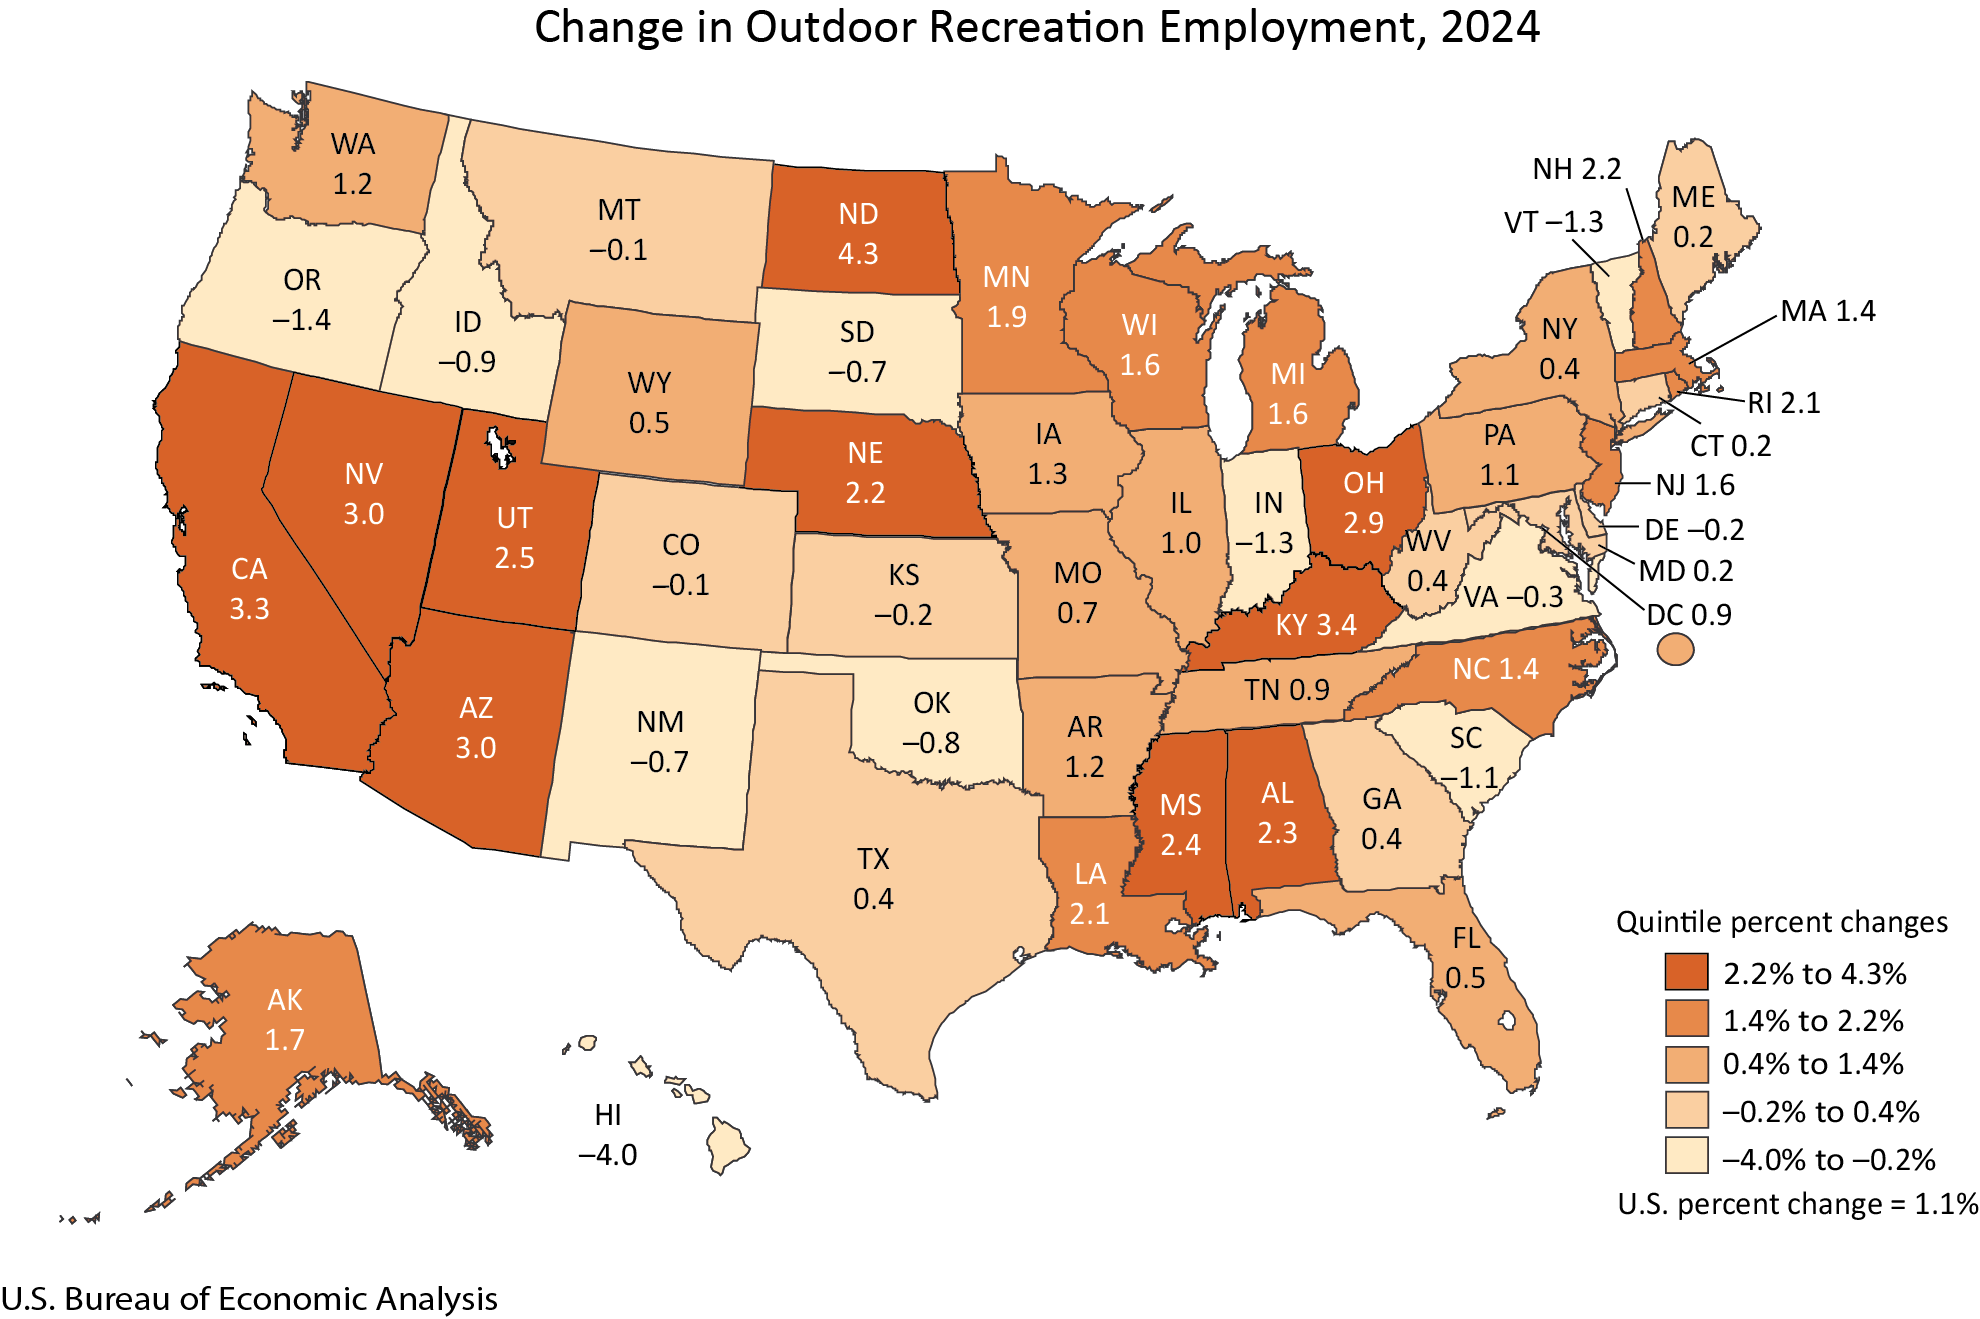
The positive employment trend was not uniformly distributed across the nation. In 2024, outdoor recreation employment experienced an increase in 36 states and the District of Columbia. This broad-based growth suggests that the benefits of the outdoor recreation economy are being felt in a majority of the country.
The percentage change in outdoor recreation employment showed considerable variation among states. North Dakota led the nation with an impressive 4.3% increase in outdoor recreation jobs. Conversely, Hawaii, despite its high overall contribution to state GDP, experienced a decline of 4.0% in outdoor recreation employment. This contrast highlights the complexity of economic indicators, where overall value added can be influenced by factors beyond just employment numbers, such as industry structure and average wages.
Understanding the Components of Outdoor Recreation
The BEA categorizes outdoor recreation activities into three primary segments:
-
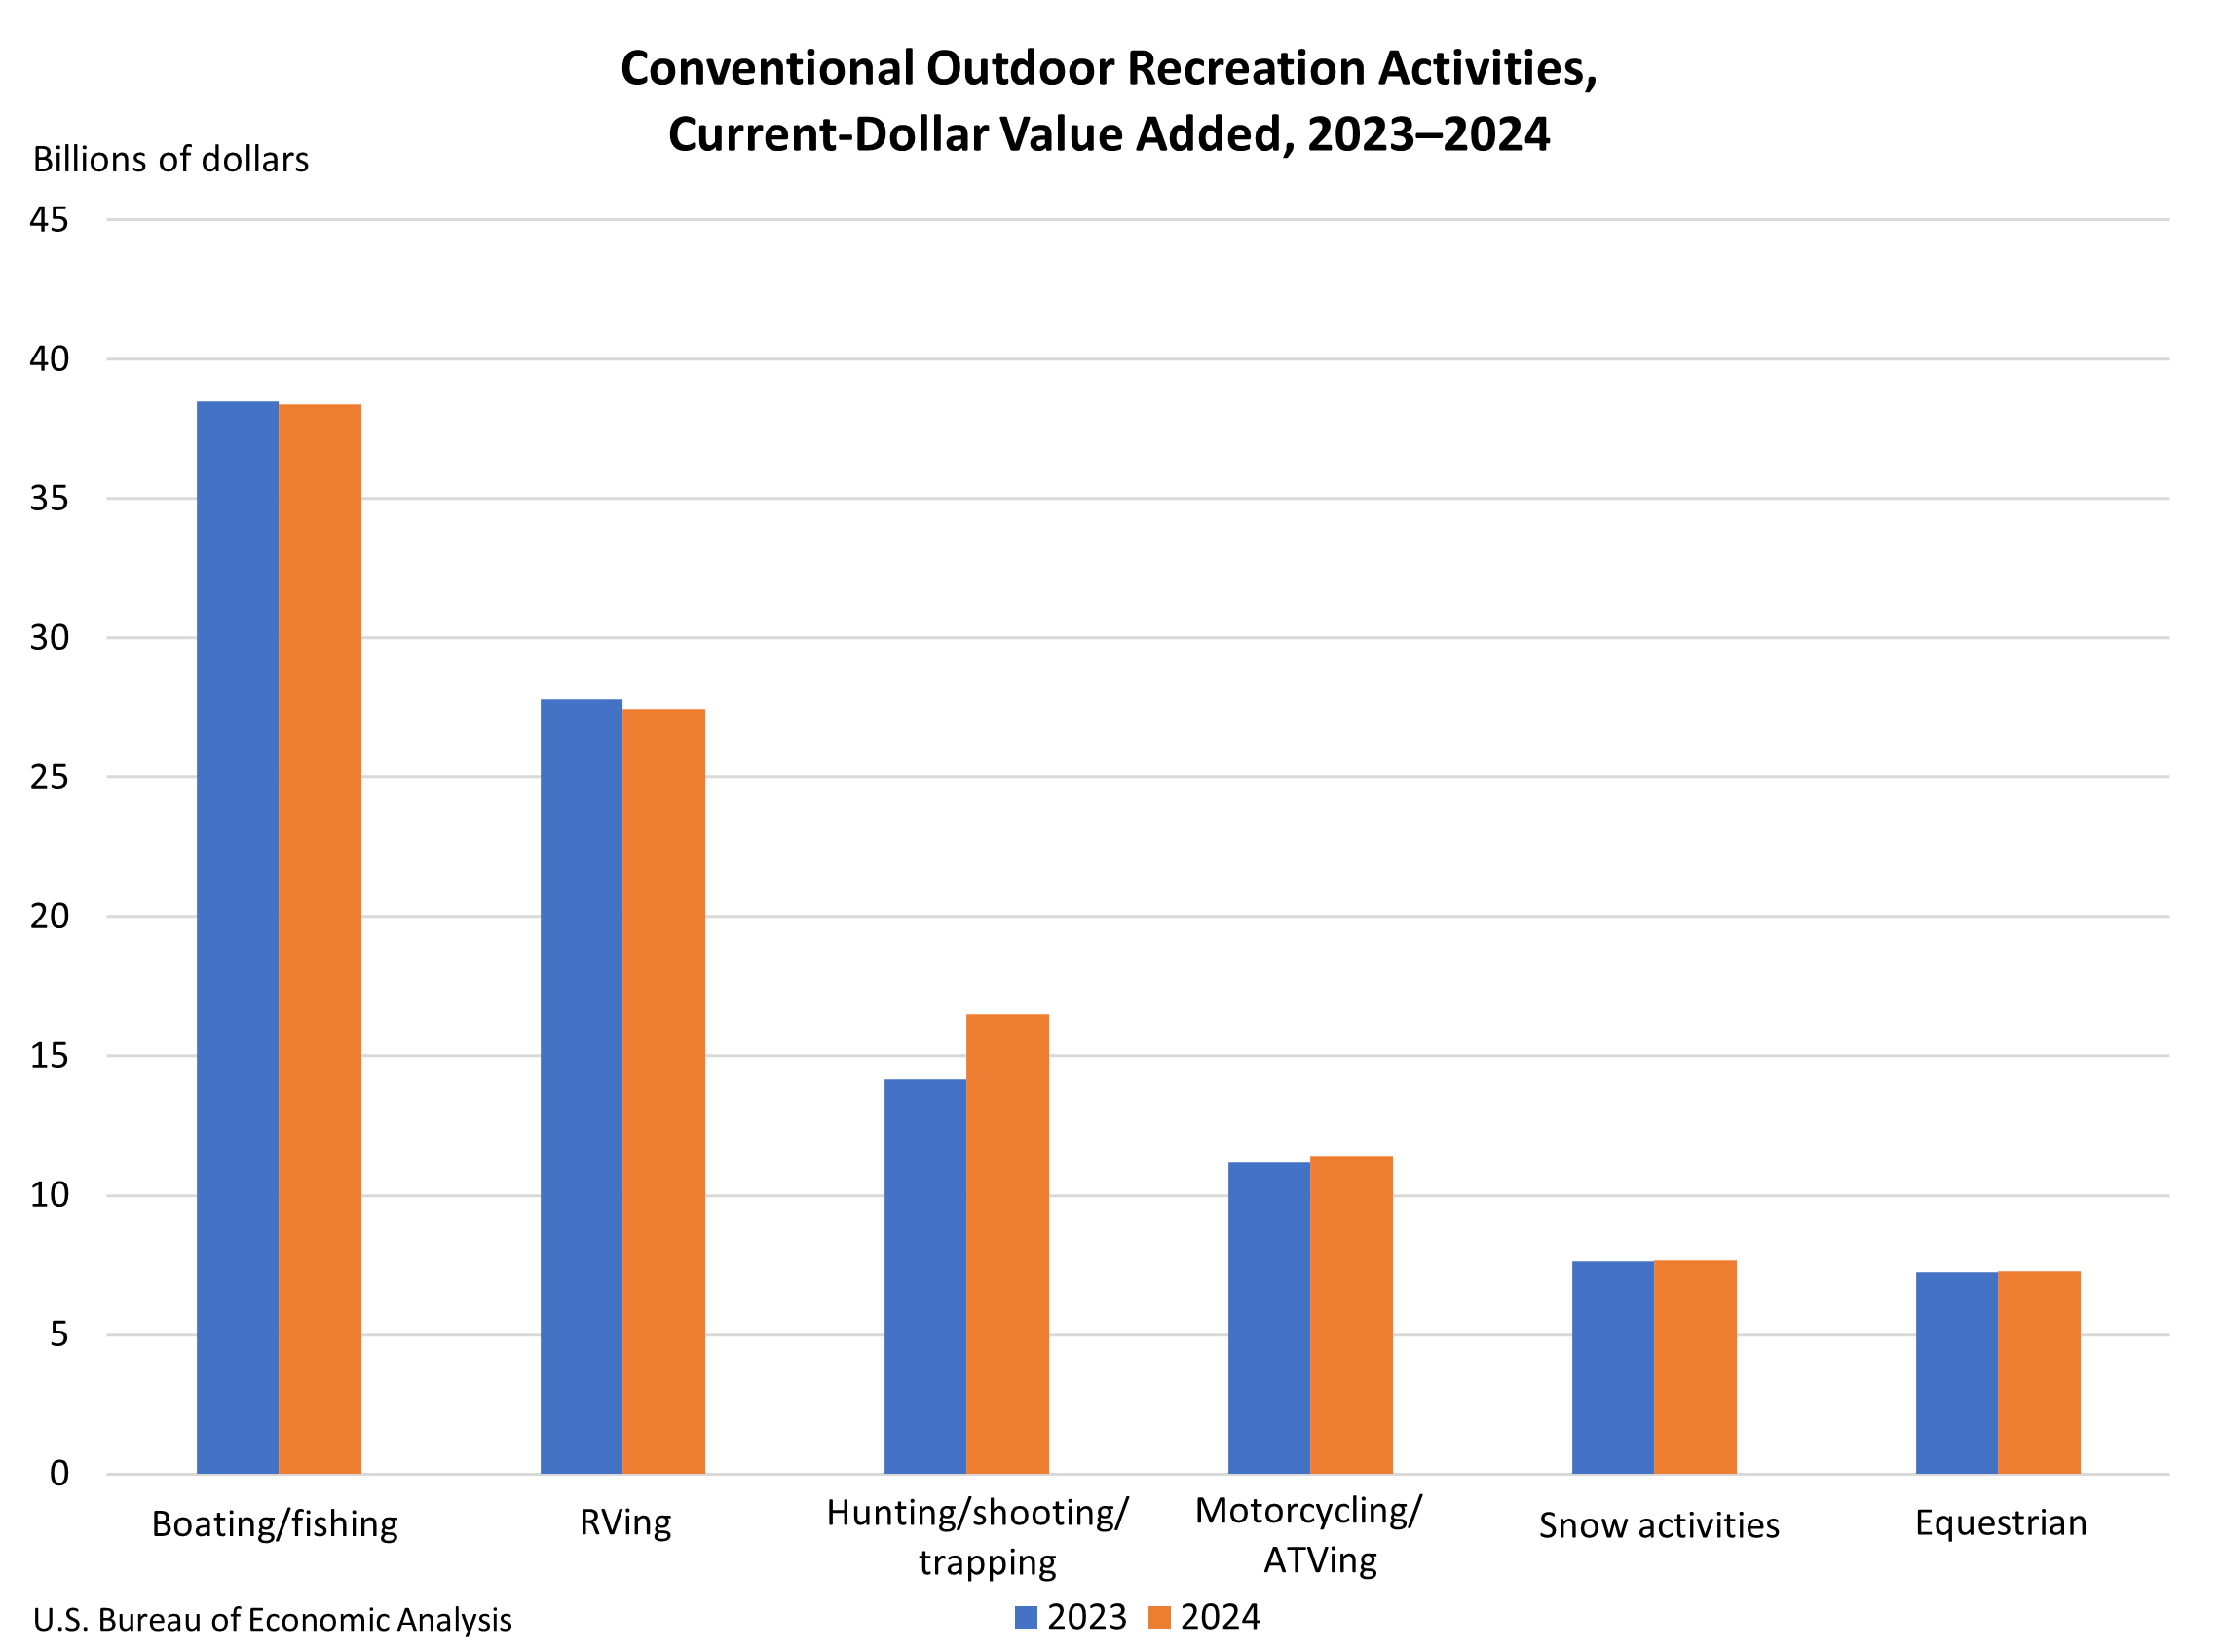
Conventional Activities: This category includes well-established pursuits such as bicycling, boating, hiking, hunting, fishing, camping, and team sports played outdoors. These are often the most visible and widely recognized forms of outdoor recreation.
-
Other Activities: This segment encompasses a broader range of leisure pursuits that may not always be explicitly labeled as "outdoor" but take place in outdoor settings or are intrinsically linked to the outdoors. Examples include gardening, outdoor concerts, and nature photography.
-
Supporting Activities: This crucial category includes the infrastructure, services, and expenditures that enable and facilitate outdoor recreation. This encompasses construction of recreational facilities, travel and tourism services (including transportation and accommodation), local trips and excursions, and government expenditures on parks and public lands.
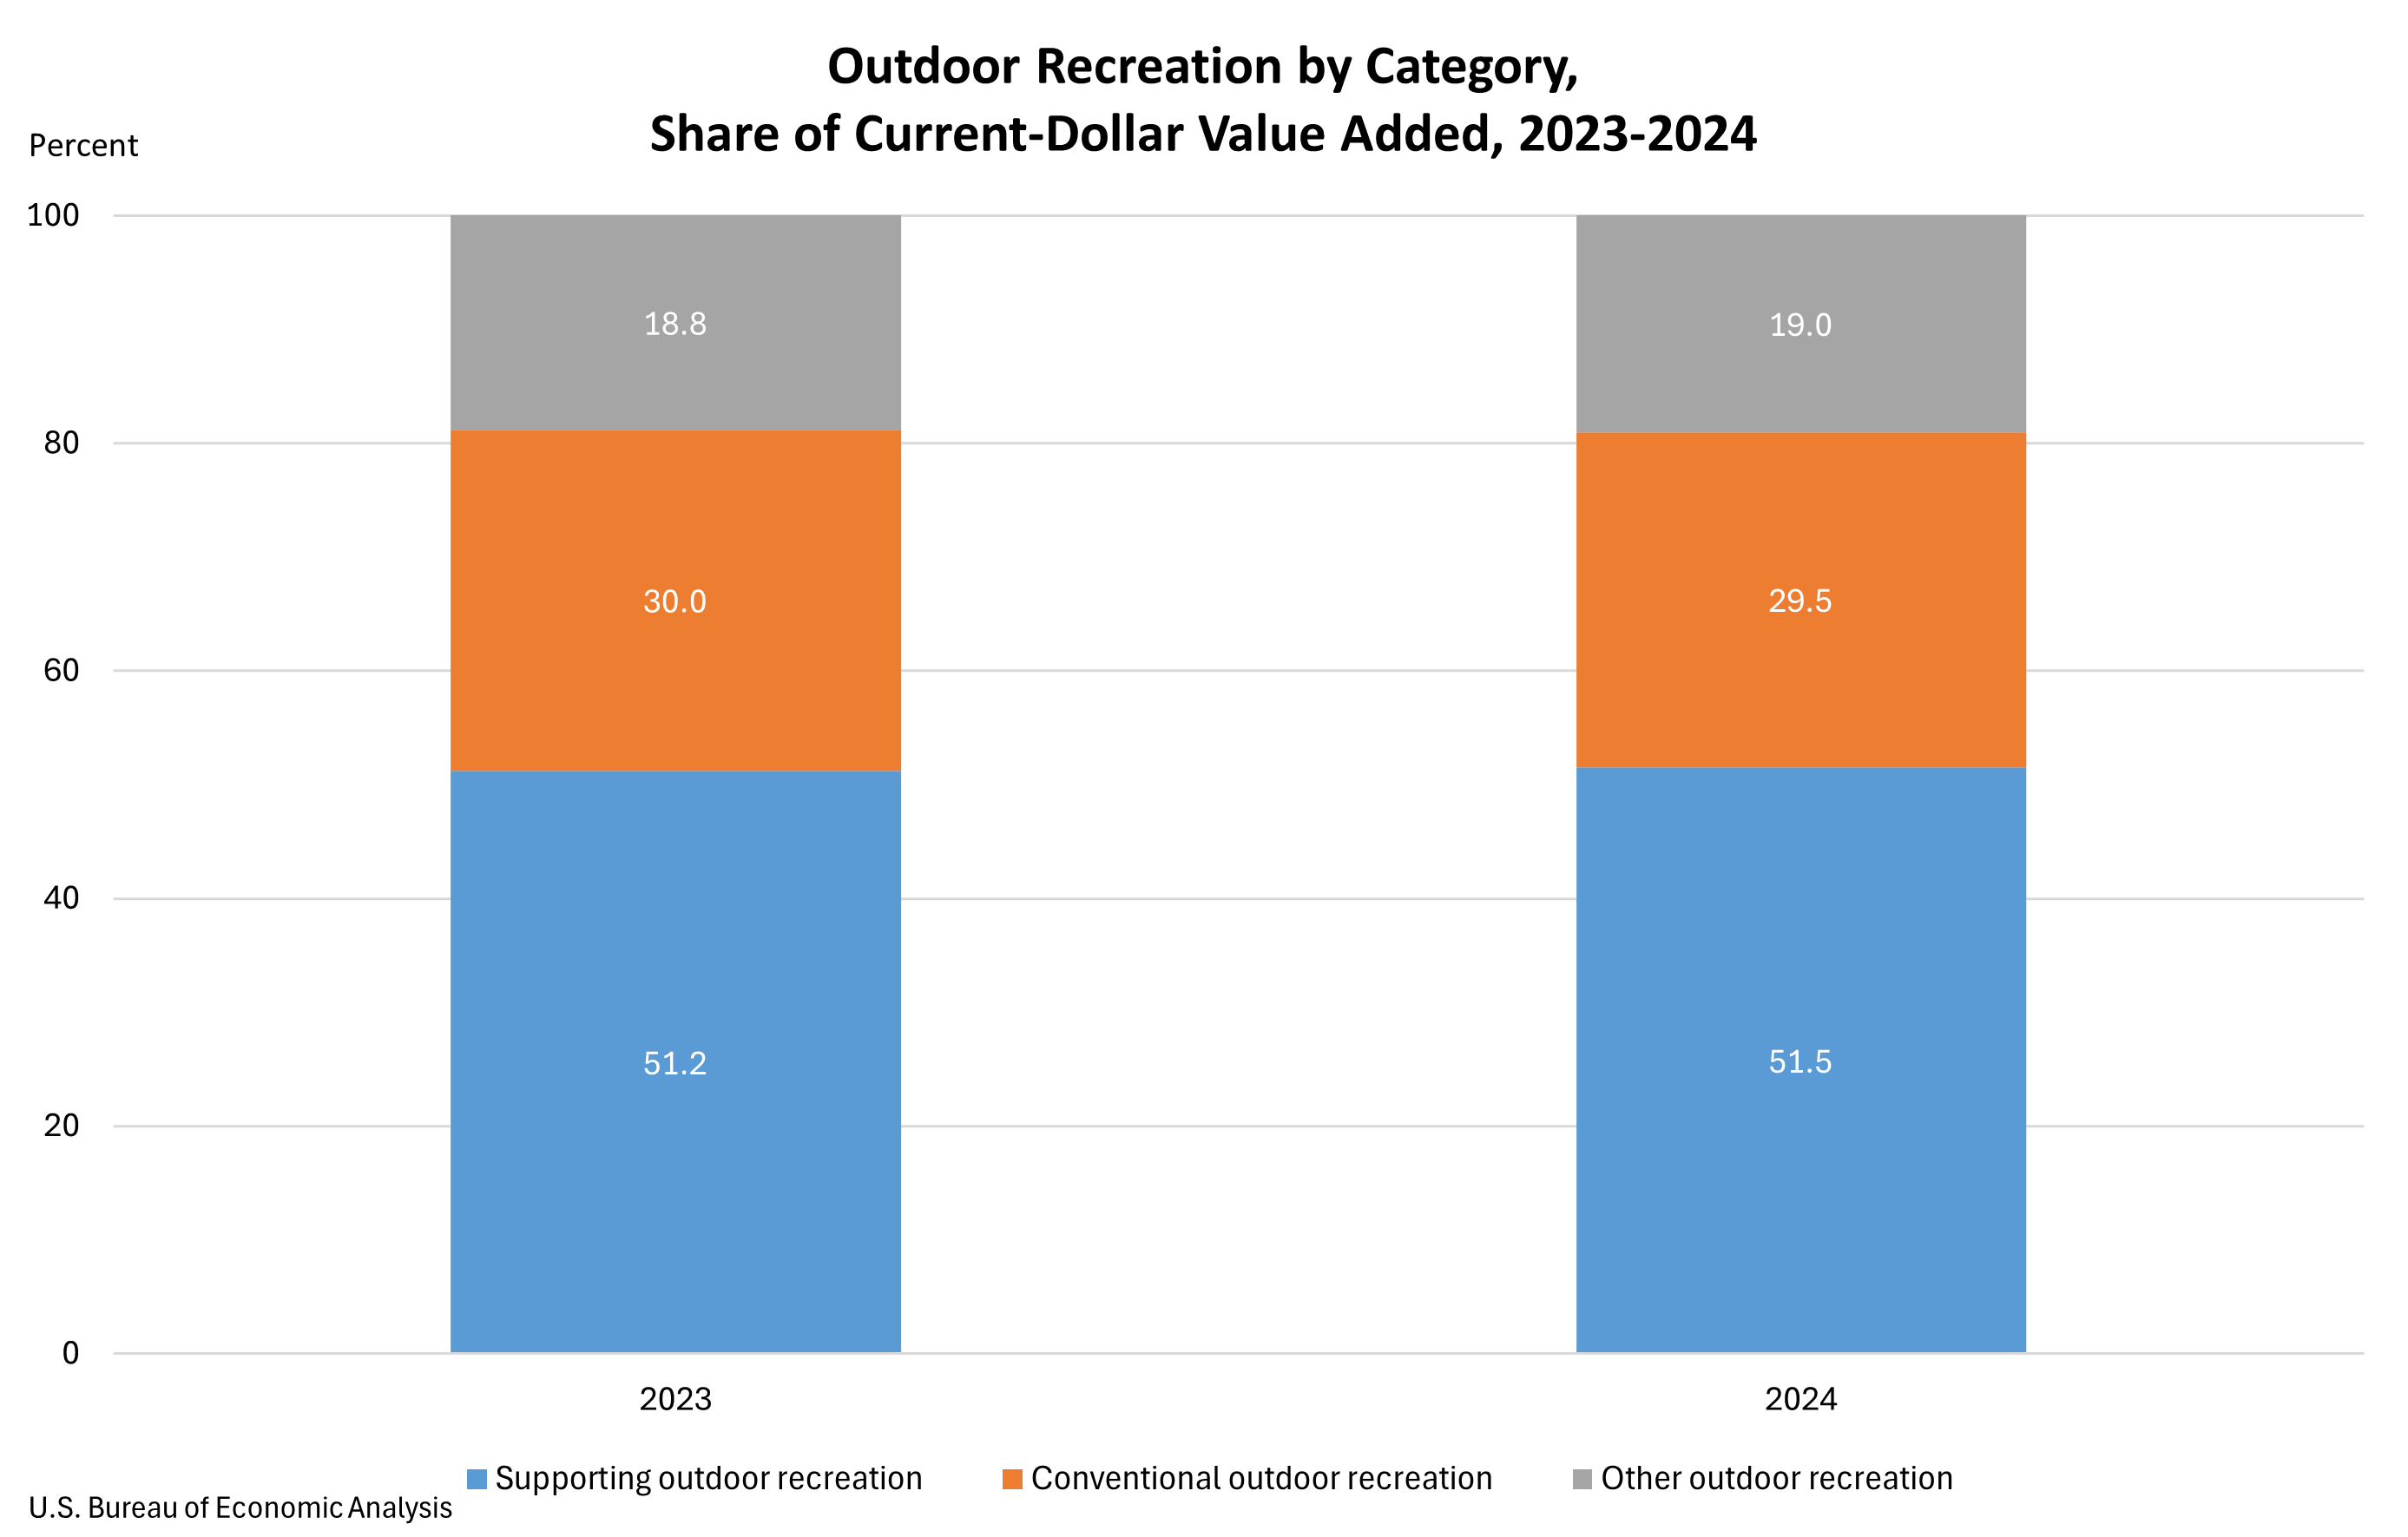
Shifts in Activity Contributions to Value Added
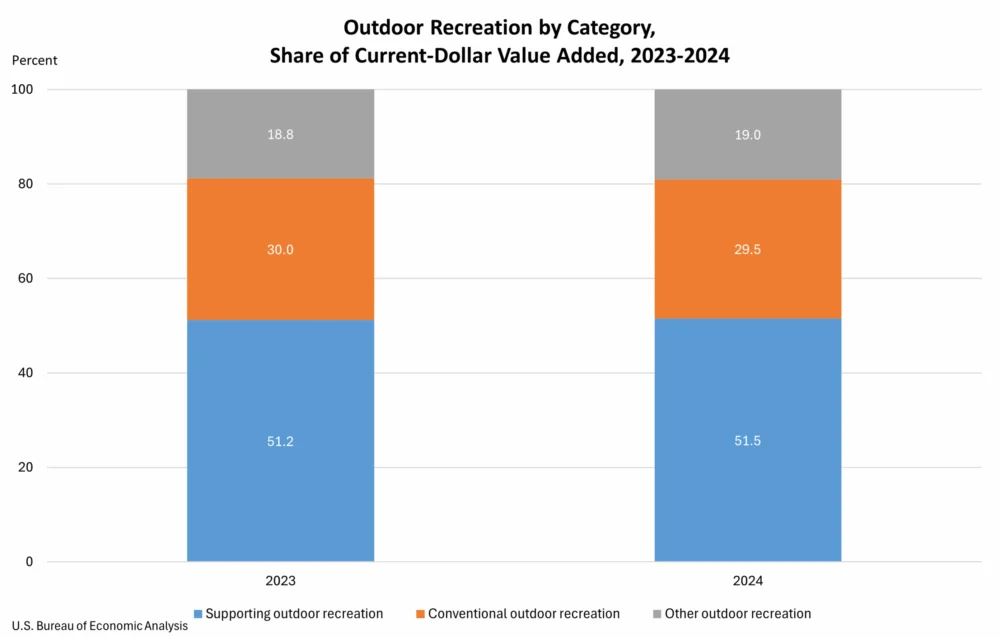
In 2024, supporting activities continued to be the largest contributor to the U.S. outdoor recreation value added, accounting for 51.5% of the total. This segment saw a slight increase from 51.2% in 2023, indicating its sustained importance in driving the sector’s economic output. Within supporting activities, travel and tourism emerged as a key growth driver, fueled by increased spending on transportation, hotels, and restaurants. This suggests a rebound or continued strength in travel-related aspects of outdoor recreation.
Conventional outdoor recreation activities accounted for 29.5% of the value added in 2024, a marginal decrease from 30.0% in 2023. This slight dip might reflect a shift in consumer spending towards other categories or a normalization after a period of high engagement in traditional outdoor pursuits.
The "other outdoor recreation" category saw a modest increase, contributing 19.0% to value added in 2024, up from 18.8% in 2023. This suggests a growing interest in less traditional outdoor leisure activities.
Industry-Specific Contributions to the Outdoor Recreation Economy
The BEA report also provides a granular look at how various industries contribute to the overall outdoor recreation economy.
The Arts, Entertainment, Recreation, Accommodation, and Food Services industry group was the dominant force in 2024, contributing $174.4 billion, or 25.0%, to the nation’s outdoor recreation value added. This sector is intrinsically linked to providing experiences, amenities, and hospitality for outdoor enthusiasts. At the state level, this industry group was the largest contributor to outdoor recreation value added in 23 states and the District of Columbia. California ($24.1 billion), Florida ($22.7 billion), and New York ($11.8 billion) reported the highest contributions from this sector.
The Retail Trade industry emerged as the second-largest contributor nationally, accounting for $169.1 billion, or 24.3%, of the value added. This sector is vital for providing the gear, equipment, and apparel necessary for outdoor activities. Retail trade was the leading industry for outdoor recreation in 24 states. California ($19.3 billion), Texas ($14.4 billion), and Florida ($13.4 billion) demonstrated the largest contributions from retail within their respective states.
Manufacturing ranked as the third-largest industry group, contributing $91.3 billion, or 13.1%, to the national outdoor recreation value added. This sector is responsible for producing a wide array of outdoor equipment, from bicycles and boats to camping gear and sporting goods. Manufacturing was the primary industry for outdoor recreation in two states: Indiana and Louisiana. Texas ($13.1 billion), California ($11.6 billion), and Indiana ($9.1 billion) showed the most significant manufacturing contributions to the sector.
Annual Updates and Data Revisions
A significant aspect of this release is the incorporation of updated estimates for the years 2020 through 2023. These revisions reflect the integration of the 2025 annual update of the National Economic Accounts, including the National Income and Product Accounts and the Industry Economic Accounts, along with newly available and revised source data. Similarly, state-level statistics have been updated to align with these national revisions and incorporate the 2025 annual update of the Regional Economic Accounts and revised regional source data. These regular updates ensure that the economic statistics remain as accurate and relevant as possible, providing policymakers, businesses, and researchers with the most current insights into the outdoor recreation economy.
Broader Implications and Future Outlook
The consistent growth and substantial economic contribution of the outdoor recreation sector highlight its increasing importance to the U.S. economy. As consumers increasingly prioritize experiences and well-being, the demand for outdoor activities and related services is likely to remain strong. The data suggests that investments in infrastructure, conservation of natural resources, and the development of tourism-related businesses can yield significant economic returns.
The BEA’s commitment to annually updating these statistics provides a critical foundation for understanding the sector’s dynamics. This ongoing measurement allows for more informed decision-making regarding public policy, private investment, and resource management. For instance, understanding which states and industries are most reliant on outdoor recreation can inform targeted economic development strategies. Similarly, tracking the growth of specific activity categories can guide investment in new recreational opportunities and related businesses.
The next release of Outdoor Recreation Economic Statistics for the U.S. and States, covering the year 2025, is anticipated in the Fall of 2026. This forthcoming report will continue to offer valuable insights into the evolving landscape of this vital economic sector.
Background and Context
The BEA began publishing comprehensive outdoor recreation statistics in 2017, responding to growing recognition of the sector’s economic impact and increasing demand for detailed data from stakeholders. This initiative was part of a broader effort to provide a more complete picture of economic activity that was not always captured in traditional industry classifications. The outdoor recreation economy encompasses a wide array of activities that engage millions of Americans annually, from visiting national parks and engaging in water sports to participating in outdoor concerts and maintaining gardens. Its economic footprint extends beyond direct spending on activities and equipment to include significant contributions from related industries such as hospitality, retail, manufacturing, and transportation.
The consistent reporting and updating of these figures by the BEA are crucial for understanding long-term trends, identifying emerging opportunities, and addressing challenges within the sector. For example, understanding the seasonal nature of certain outdoor recreation activities and their economic impact can help businesses and local governments plan accordingly. Furthermore, the data can be instrumental in advocating for policies that support outdoor recreation, such as funding for park maintenance, trail development, and conservation efforts, recognizing that these investments often yield substantial economic and social benefits.
The BEA’s work in this area provides a unique lens through which to view the intersection of the environment, human well-being, and economic prosperity. As the nation continues to grapple with issues related to climate change, public health, and economic resilience, the outdoor recreation economy stands out as a sector that can contribute positively to all these areas. Its growth is intrinsically linked to the health of natural landscapes, promotes physical and mental well-being, and generates significant economic activity. The ongoing measurement and analysis of this sector by the BEA will undoubtedly continue to be an invaluable resource for shaping a sustainable and prosperous future.


