

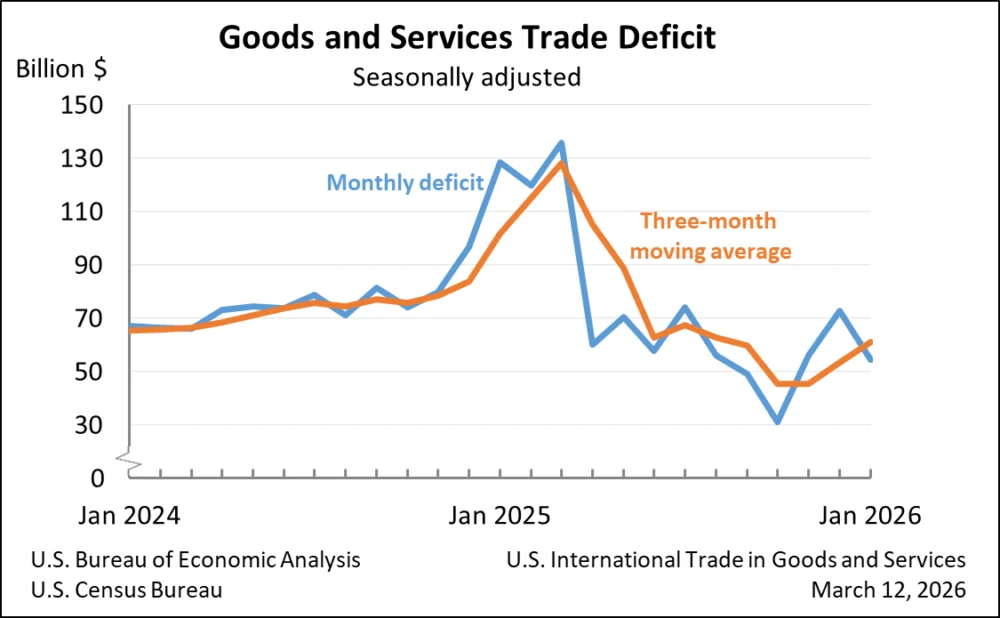
The United States experienced a notable reduction in its trade deficit for goods and services in January, a positive development signaling a potential shift in the nation’s balance of trade. The U.S. Census Bureau and the U.S. Bureau of Economic Analysis jointly announced that the goods and services deficit stood at $54.5 billion in January, marking a substantial decrease of $18.4 billion from the revised $72.9 billion deficit recorded in December. This represents a 25.3% contraction in the overall deficit month-over-month.
This narrowing of the deficit was driven by a confluence of factors, including a robust increase in exports and a slight decrease in imports. January exports surged by 5.5%, reaching $302.1 billion, an increase of $15.8 billion compared to the previous month. Conversely, imports saw a marginal decline of 0.7%, totaling $356.6 billion, a decrease of $2.6 billion from December.
Key Drivers of the Deficit Reduction
The improvement in the overall trade balance can be attributed to significant movements within both the goods and services sectors. The deficit in goods narrowed by $17.5 billion, reaching $81.8 billion. Simultaneously, the surplus in services expanded by $1.0 billion to $27.3 billion. This dual action effectively mitigated the overall trade imbalance.
Looking at a broader perspective, the year-over-year comparison reveals an even more pronounced improvement. The goods and services deficit in January was $73.9 billion, or 57.6%, lower than in January of the previous year (2025). This substantial year-over-year reduction underscores a sustained trend of improving trade dynamics. Exports, on a year-over-year basis, climbed by $28.4 billion (10.4%), while imports contracted by $45.5 billion (11.3%). This indicates a significant shift in the U.S. trade landscape, with exports playing a crucial role in boosting the economy and imports becoming more restrained.
Detailed Breakdown of Exports and Imports
In January, exports of goods saw a considerable increase of $14.6 billion, reaching $195.5 billion. This growth was reflected in exports on a Census basis, which increased by $14.8 billion, with minor adjustments for net balance of payments. Exports of services also contributed positively, rising by $1.2 billion to $106.7 billion. This indicates a healthy demand for U.S. goods and services in the global market.
On the import side, goods imports experienced a decrease of $2.8 billion, totaling $277.3 billion. Imports on a Census basis declined by $3.0 billion, with a slight upward adjustment in net balance of payments. Services imports, however, saw a modest increase of $0.2 billion, reaching $79.3 billion. The overall reduction in imports of goods is a key factor in the shrinking trade deficit.
Real Goods Trade: A Deeper Dive
Examining trade in real terms, adjusted for inflation and using 2017 dollars for goods on a Census basis, provides a more accurate picture of trade volume. The real goods deficit decreased by $14.0 billion, or 14.3%, in January. This decline was more pronounced than the 18.0% decrease observed in the nominal goods deficit, suggesting that the volume of goods traded played a significant role in the overall improvement.
Revisions to Previous Data
The U.S. Census Bureau and Bureau of Economic Analysis also announced revisions to trade data for July through December 2025. These revisions incorporated more comprehensive and updated quarterly and monthly data, ensuring greater accuracy in the reported figures. Furthermore, seasonally adjusted data for all months of 2025 were revised to align with annual totals. Such revisions are standard practice in economic data reporting to reflect the latest available information and maintain data integrity.
Trade Balances with Key Trading Partners
The detailed breakdown of trade by country and area provides further insights into the global trade dynamics. In January, the U.S. recorded trade surpluses in goods with several key partners, including the United Kingdom ($7.0 billion), Netherlands ($6.4 billion), South and Central America ($4.5 billion), Switzerland ($3.0 billion), Hong Kong ($3.0 billion), Saudi Arabia ($2.2 billion), Brazil ($1.8 billion), Singapore ($1.7 billion), Australia ($1.7 billion), and Belgium ($0.9 billion).
Conversely, significant deficits were observed with Vietnam ($19.0 billion), Taiwan ($17.3 billion), Mexico ($12.8 billion), China ($12.5 billion), the European Union ($6.1 billion), South Korea ($6.0 billion), Japan ($5.5 billion), Germany ($4.9 billion), Italy ($3.3 billion), Malaysia ($3.2 billion), India ($2.8 billion), Canada ($2.7 billion), Ireland ($2.4 billion), France ($1.5 billion), and Israel ($0.7 billion). These figures highlight persistent trade imbalances with specific regions and countries, which often remain a subject of economic and political discussion.
On a quarterly basis, focusing on the fourth quarter of 2025, trade in goods and services by country and area also revealed notable patterns. Surpluses were recorded with Switzerland ($24.1 billion), Netherlands ($21.0 billion), South and Central America ($19.6 billion), United Kingdom ($15.9 billion), Brazil ($14.2 billion), Singapore ($10.1 billion), Ireland ($10.0 billion), Hong Kong ($7.2 billion), Australia ($6.6 billion), Belgium ($3.9 billion), and Saudi Arabia ($3.3 billion).
During the same fourth quarter, deficits were observed with Taiwan ($50.7 billion), Mexico ($49.5 billion), Vietnam ($47.7 billion), China ($31.7 billion), Germany ($21.6 billion), India ($13.4 billion), Japan ($10.8 billion), South Korea ($9.4 billion), Malaysia ($7.9 billion), France ($7.5 billion), Italy ($7.5 billion), the European Union ($4.5 billion), Canada ($4.3 billion), and Israel ($2.3 billion). The persistent trade deficits with countries like Taiwan, Mexico, Vietnam, and China continue to be areas of focus for U.S. trade policy.
Three-Month Moving Averages: Smoothing Out Volatility
To provide a more stable view of trade trends, three-month moving averages are often analyzed. For the three months ending in January, the average goods and services deficit increased by $7.8 billion to $61.1 billion. While the monthly figures showed a significant improvement, the three-month average suggests a more moderate trend, indicating that the January decline might be a temporary fluctuation or the beginning of a sustained shift.
Year-over-year, the average goods and services deficit for the three months ending in January decreased by $40.6 billion compared to the same period in 2025. This longer-term perspective reinforces the notion of an improving trade balance over a more extended period.
Implications and Future Outlook
The significant reduction in the U.S. trade deficit in January carries several potential implications for the U.S. economy. A narrower trade deficit can contribute to a stronger U.S. dollar, potentially making imports cheaper for consumers and businesses. It can also indicate increased competitiveness of U.S. exports on the global stage. Furthermore, a reduction in the trade deficit can positively impact the nation’s Gross Domestic Product (GDP), as net exports are a component of GDP.
However, economists often caution against overinterpreting single-month data. The fluctuations in trade balances can be influenced by various short-term factors, including seasonal demand, global economic conditions, and geopolitical events. The upcoming months will be crucial in determining whether the January trend represents a sustained improvement or a temporary anomaly.
The increase in exports, particularly in goods, suggests that U.S. manufacturers and exporters are finding stronger demand abroad. This could be driven by a variety of factors, including increased global economic activity, favorable exchange rates, or successful trade promotion efforts. The decrease in imports, especially in goods, could reflect a moderation in domestic demand, a shift towards domestically produced goods, or the impact of trade policies.
Data Sources and Future Releases
All statistics referenced in this report are seasonally adjusted and presented on a balance of payments basis, unless otherwise specified. For detailed information, including not seasonally adjusted statistics and goods data on a Census basis, readers are directed to exhibits 1-20b within the official release. The U.S. Census Bureau and the U.S. Bureau of Economic Analysis provide comprehensive resources on their respective websites for data users.
The next release of U.S. International Trade in Goods and Services, covering February 2026 data, is scheduled for April 2, 2026. This upcoming report will provide further insights into the continuation of these trade trends.
Notice on Euro Area and Upcoming Updates
A recent update to the statistical reporting notes a change in the definition of the "Euro Area" to include Bulgaria, following its adoption of the euro as its currency effective January 1, 2026. This change will affect specific exhibits in future reports.
Furthermore, significant upcoming updates to goods and services trade statistics are planned for June 9, 2026. These revisions will encompass trade in goods on both Census and balance of payments (BOP) bases, extending back to 2021, and trade in services, extending back to 1999. These comprehensive revisions aim to incorporate the latest methodologies and data to enhance the accuracy and comparability of long-term trade statistics.
The U.S. international trade landscape is dynamic and subject to various economic and policy influences. The January figures offer a promising indication of a narrowing trade deficit, driven by both increased exports and moderated imports, setting a positive tone for the early part of 2026. Continued monitoring of these trends will be essential for understanding the broader economic implications.


