Lana Rhoades
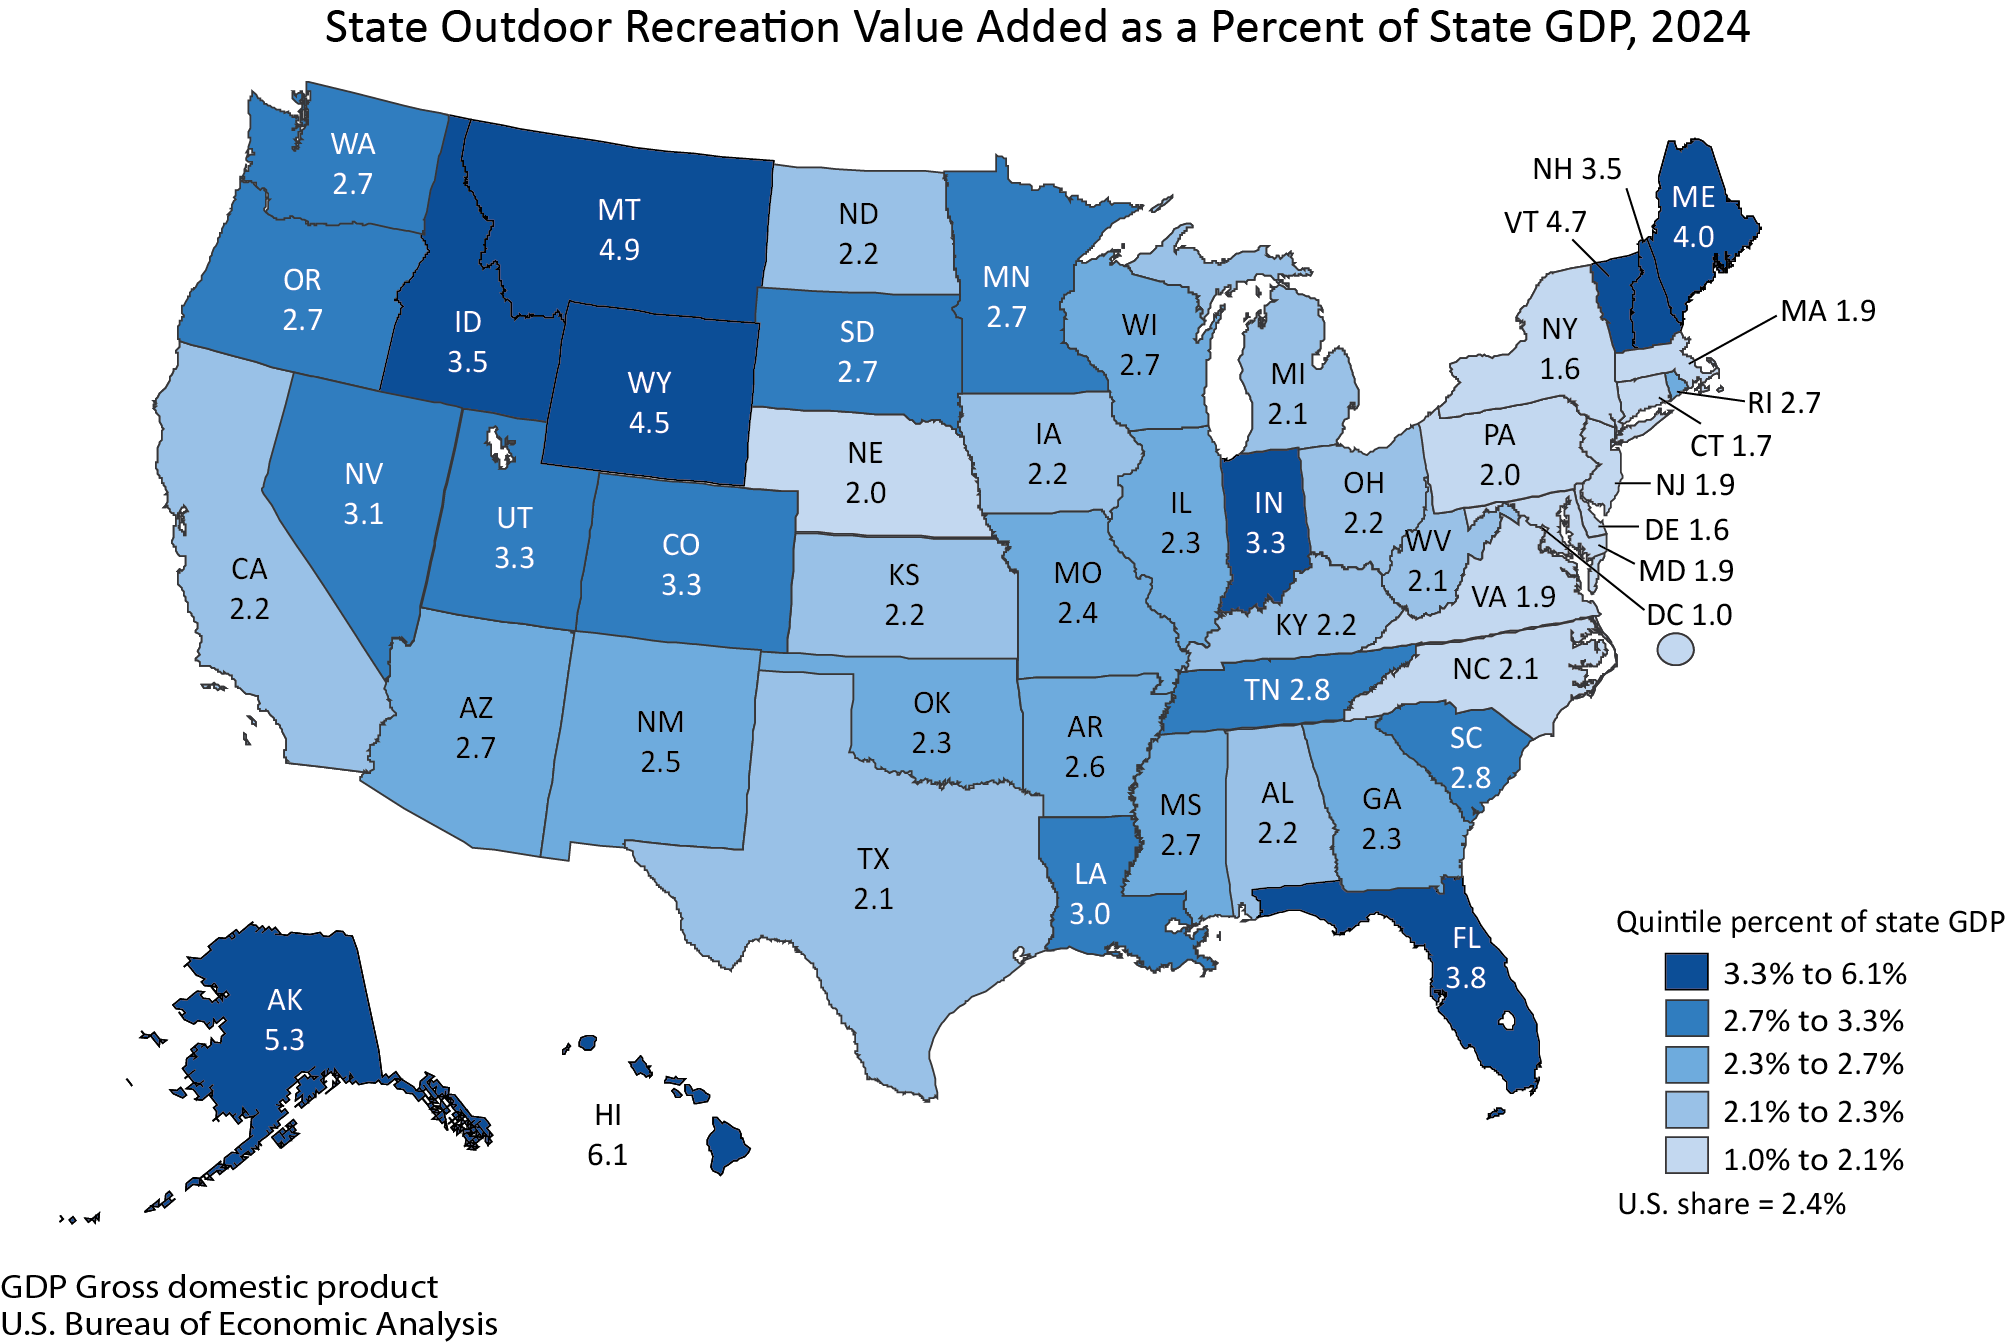
The U.S. Bureau of Economic Analysis (BEA) has released its latest comprehensive data on the nation’s outdoor recreation economy, revealing a significant economic force that contributed a substantial $696.7 billion to the current-dollar Gross Domestic Product (GDP) in 2024. This figure represents 2.4 percent of the total U.S. GDP, underscoring the sector’s considerable impact on national economic output. The report, which provides detailed breakdowns for all 50 states and the District of Columbia, also shows that the value added by outdoor recreation as a share of state GDP varied widely, from a commanding 6.1 percent in Hawaii to a more modest 1.0 percent in the District of Columbia.
This annual update of outdoor recreation economic statistics, a crucial benchmark for understanding a vital and dynamic sector, offers insights into its growth trajectory, employment trends, and the diverse activities that comprise it. The BEA’s meticulous data collection and analysis, drawing upon extensive source data and incorporating the latest updates to the National and Regional Economic Accounts, provides policymakers, industry leaders, and the public with a clear picture of the outdoor recreation economy’s performance and its evolving role in the broader economic landscape.
Economic Growth and Performance in 2024
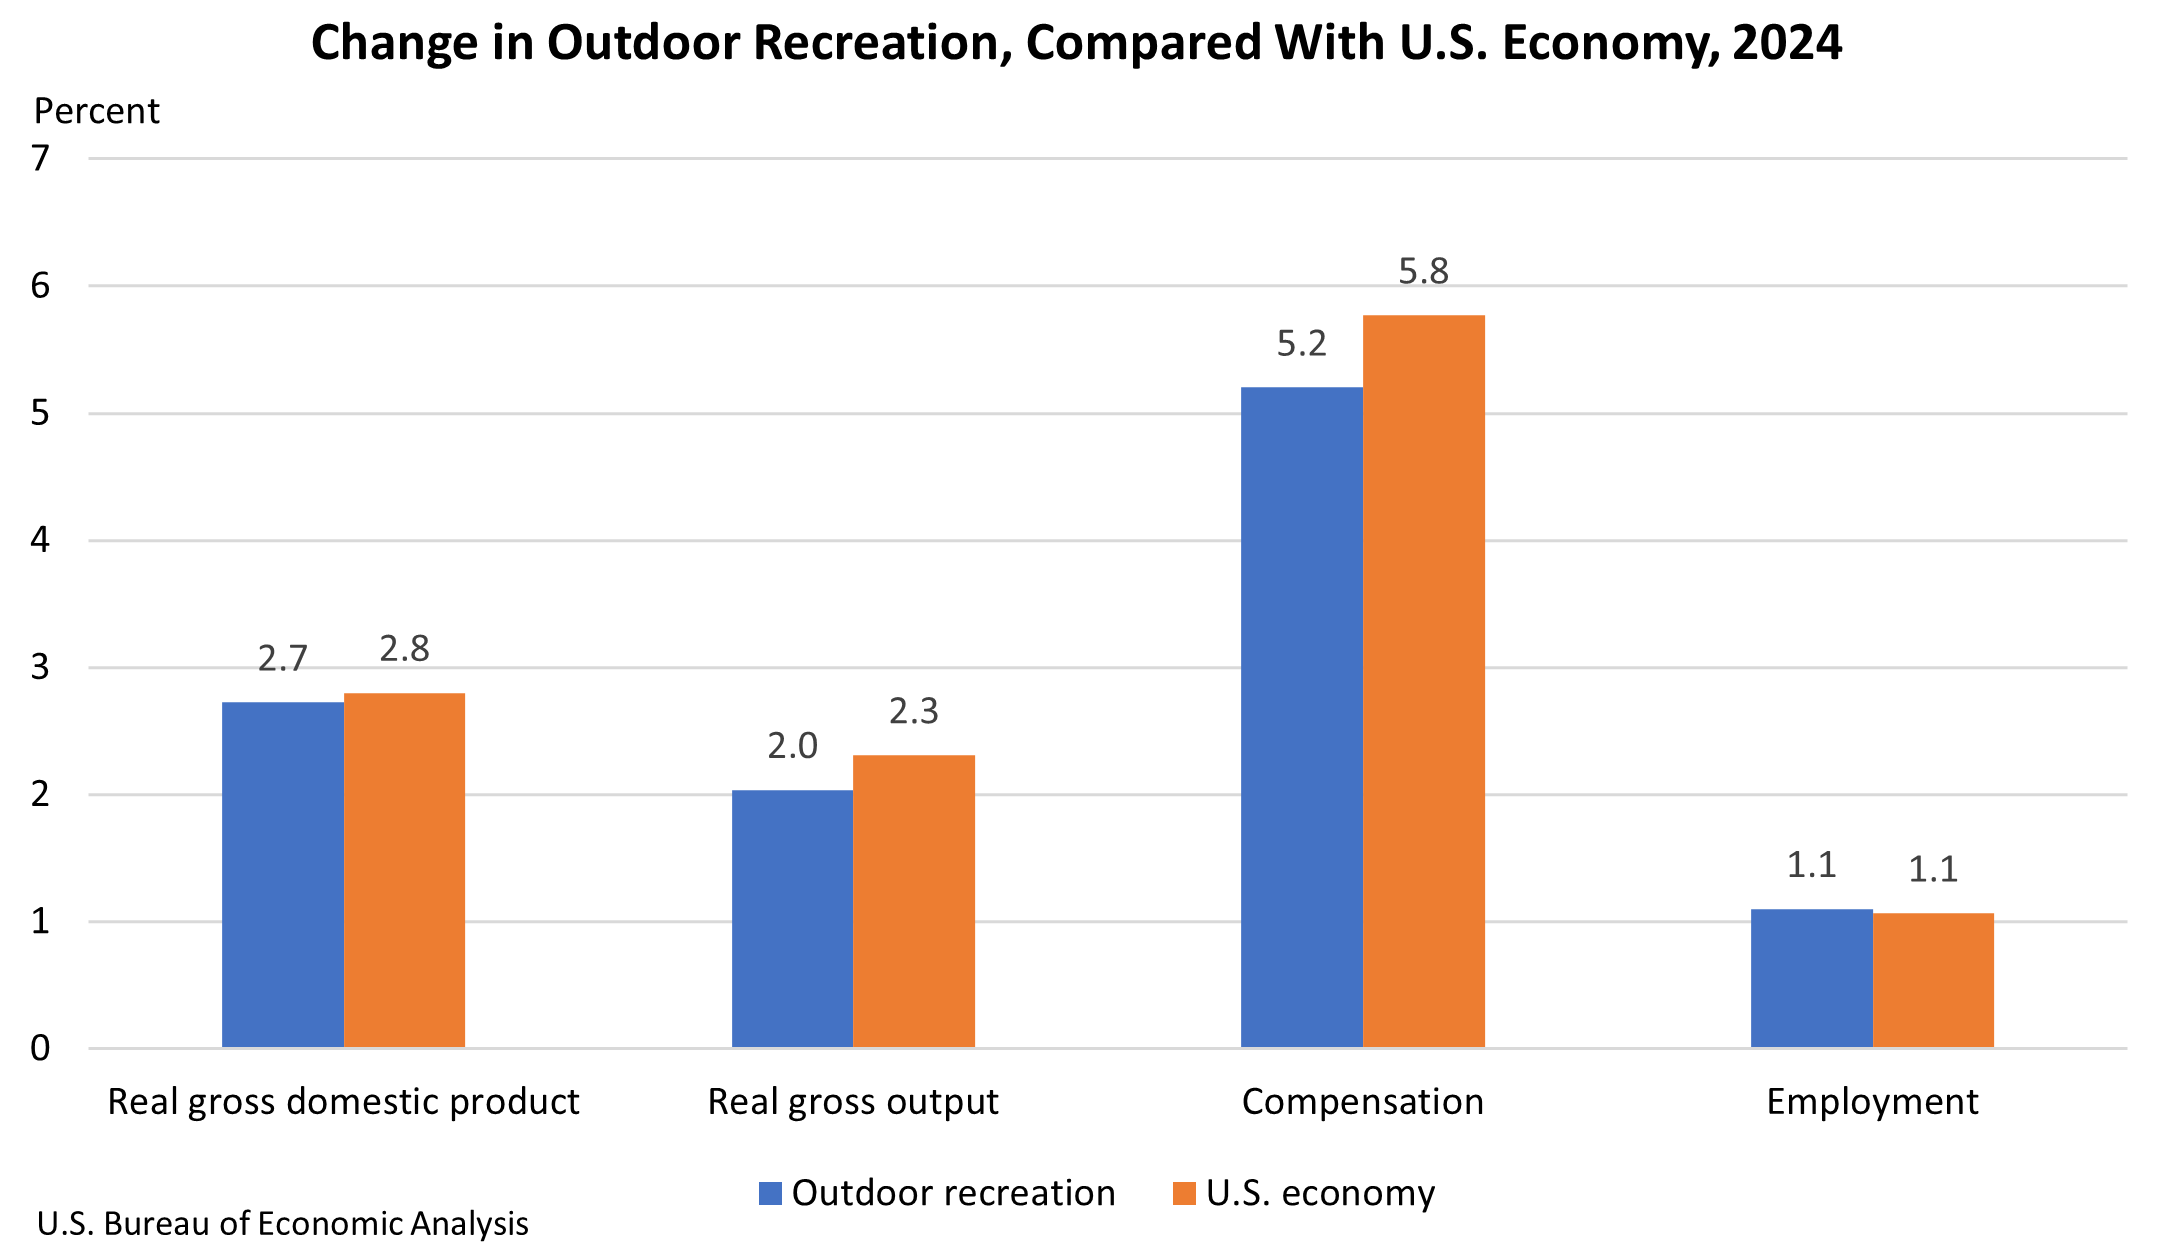
In 2024, the outdoor recreation economy demonstrated continued, albeit moderated, growth. Inflation-adjusted ("real") GDP for the sector increased by 2.7 percent. While this growth rate slightly trailed the overall U.S. economy’s 2.8 percent expansion, it reflects a deceleration from the robust 5.3 percent surge observed in 2023. This moderation suggests a return to more sustainable growth patterns following a period of exceptional expansion.
The real gross output for outdoor recreation also saw a positive uptick, rising by 2.0 percent. Compensation within the sector experienced a more significant increase of 5.2 percent, indicating a healthy rise in earnings for those employed in outdoor recreation-related industries. Employment in the sector also grew, albeit at a more modest pace, with a 1.1 percent increase across the nation.
The BEA’s annual update of these statistics incorporates the results of its 2025 annual update of the National Economic Accounts, which includes the National Income and Product Accounts and the Industry Economic Accounts. This ensures that the figures presented are based on the most current and comprehensive economic data available. Similarly, the state-level statistics have been updated to reflect these national revisions, as well as the 2025 annual update of the Regional Economic Accounts and newly available regional source data. This rigorous update process ensures the accuracy and reliability of the reported figures, providing a solid foundation for economic analysis and strategic planning.
State-Level Variations and Employment Dynamics
The geographical distribution of outdoor recreation’s economic impact is diverse. While Hawaii leads in terms of its contribution to state GDP, other states also showcase the sector’s significance. The BEA’s data, available through interactive tables, allows for a granular examination of these state-specific contributions.
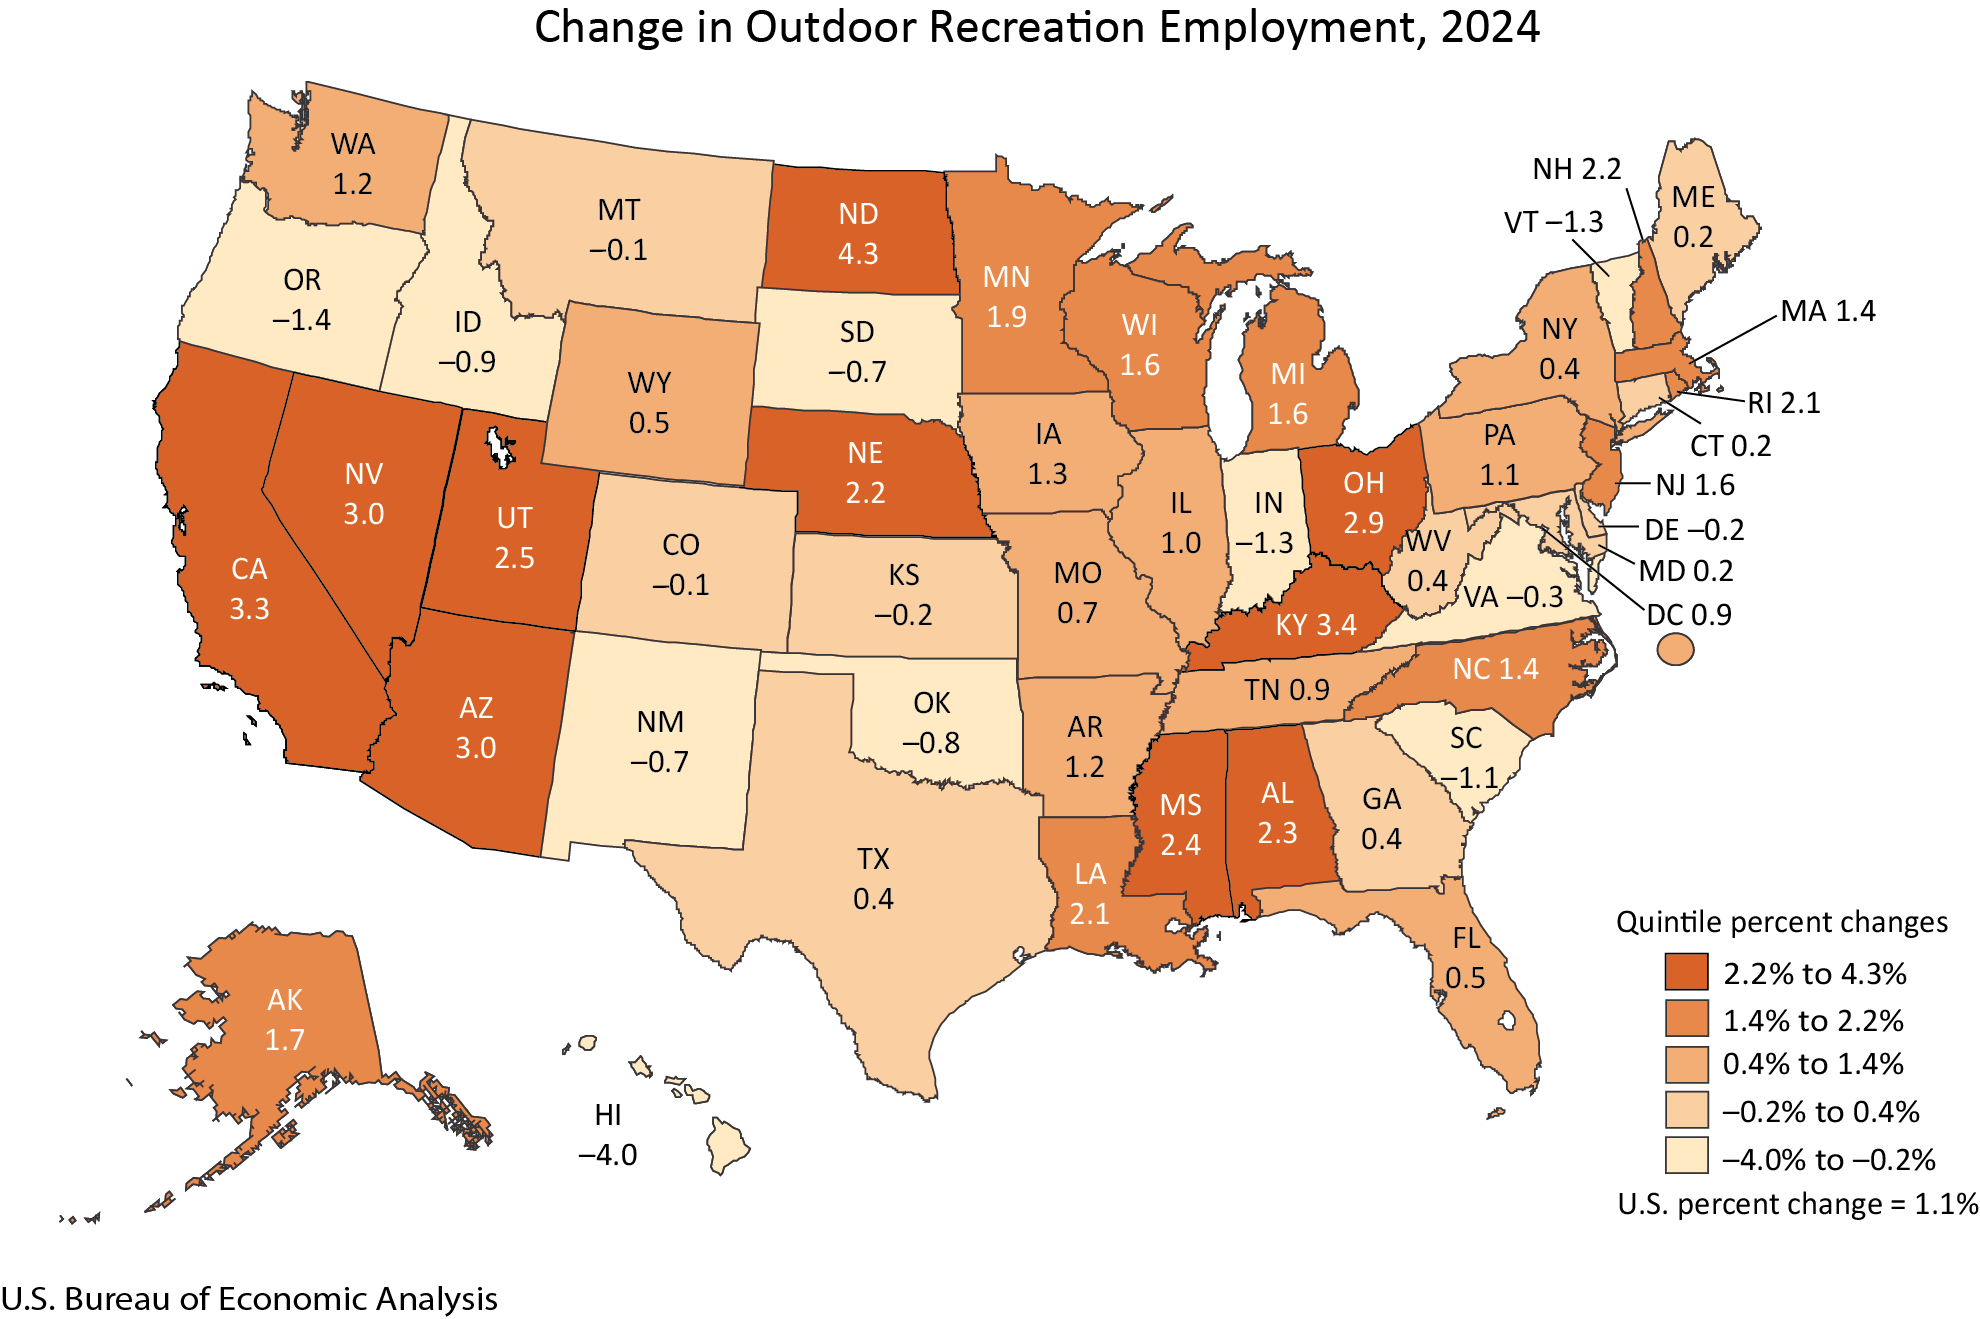
Employment trends in outdoor recreation also exhibited considerable variation across states. In 2024, outdoor recreation employment expanded in 36 states and the District of Columbia. North Dakota recorded the highest percentage increase in outdoor recreation employment at 4.3 percent, suggesting a burgeoning sector in that region. Conversely, Hawaii experienced a contraction of 4.0 percent in outdoor recreation employment, a notable shift from its leading position in value added. This disparity highlights the complex interplay of factors influencing employment within the sector, including local economic conditions, consumer demand, and specific industry dynamics.
The BEA’s detailed state tables, such as State Table 1 and State Table 9, provide an invaluable resource for understanding these regional nuances. These tables allow for direct comparisons of value added as a percentage of state GDP and changes in outdoor recreation employment, offering a comprehensive view of the sector’s performance at the subnational level.
Deconstructing Outdoor Recreation: Activities and Industries
The BEA categorizes outdoor recreation activities into three broad groups:
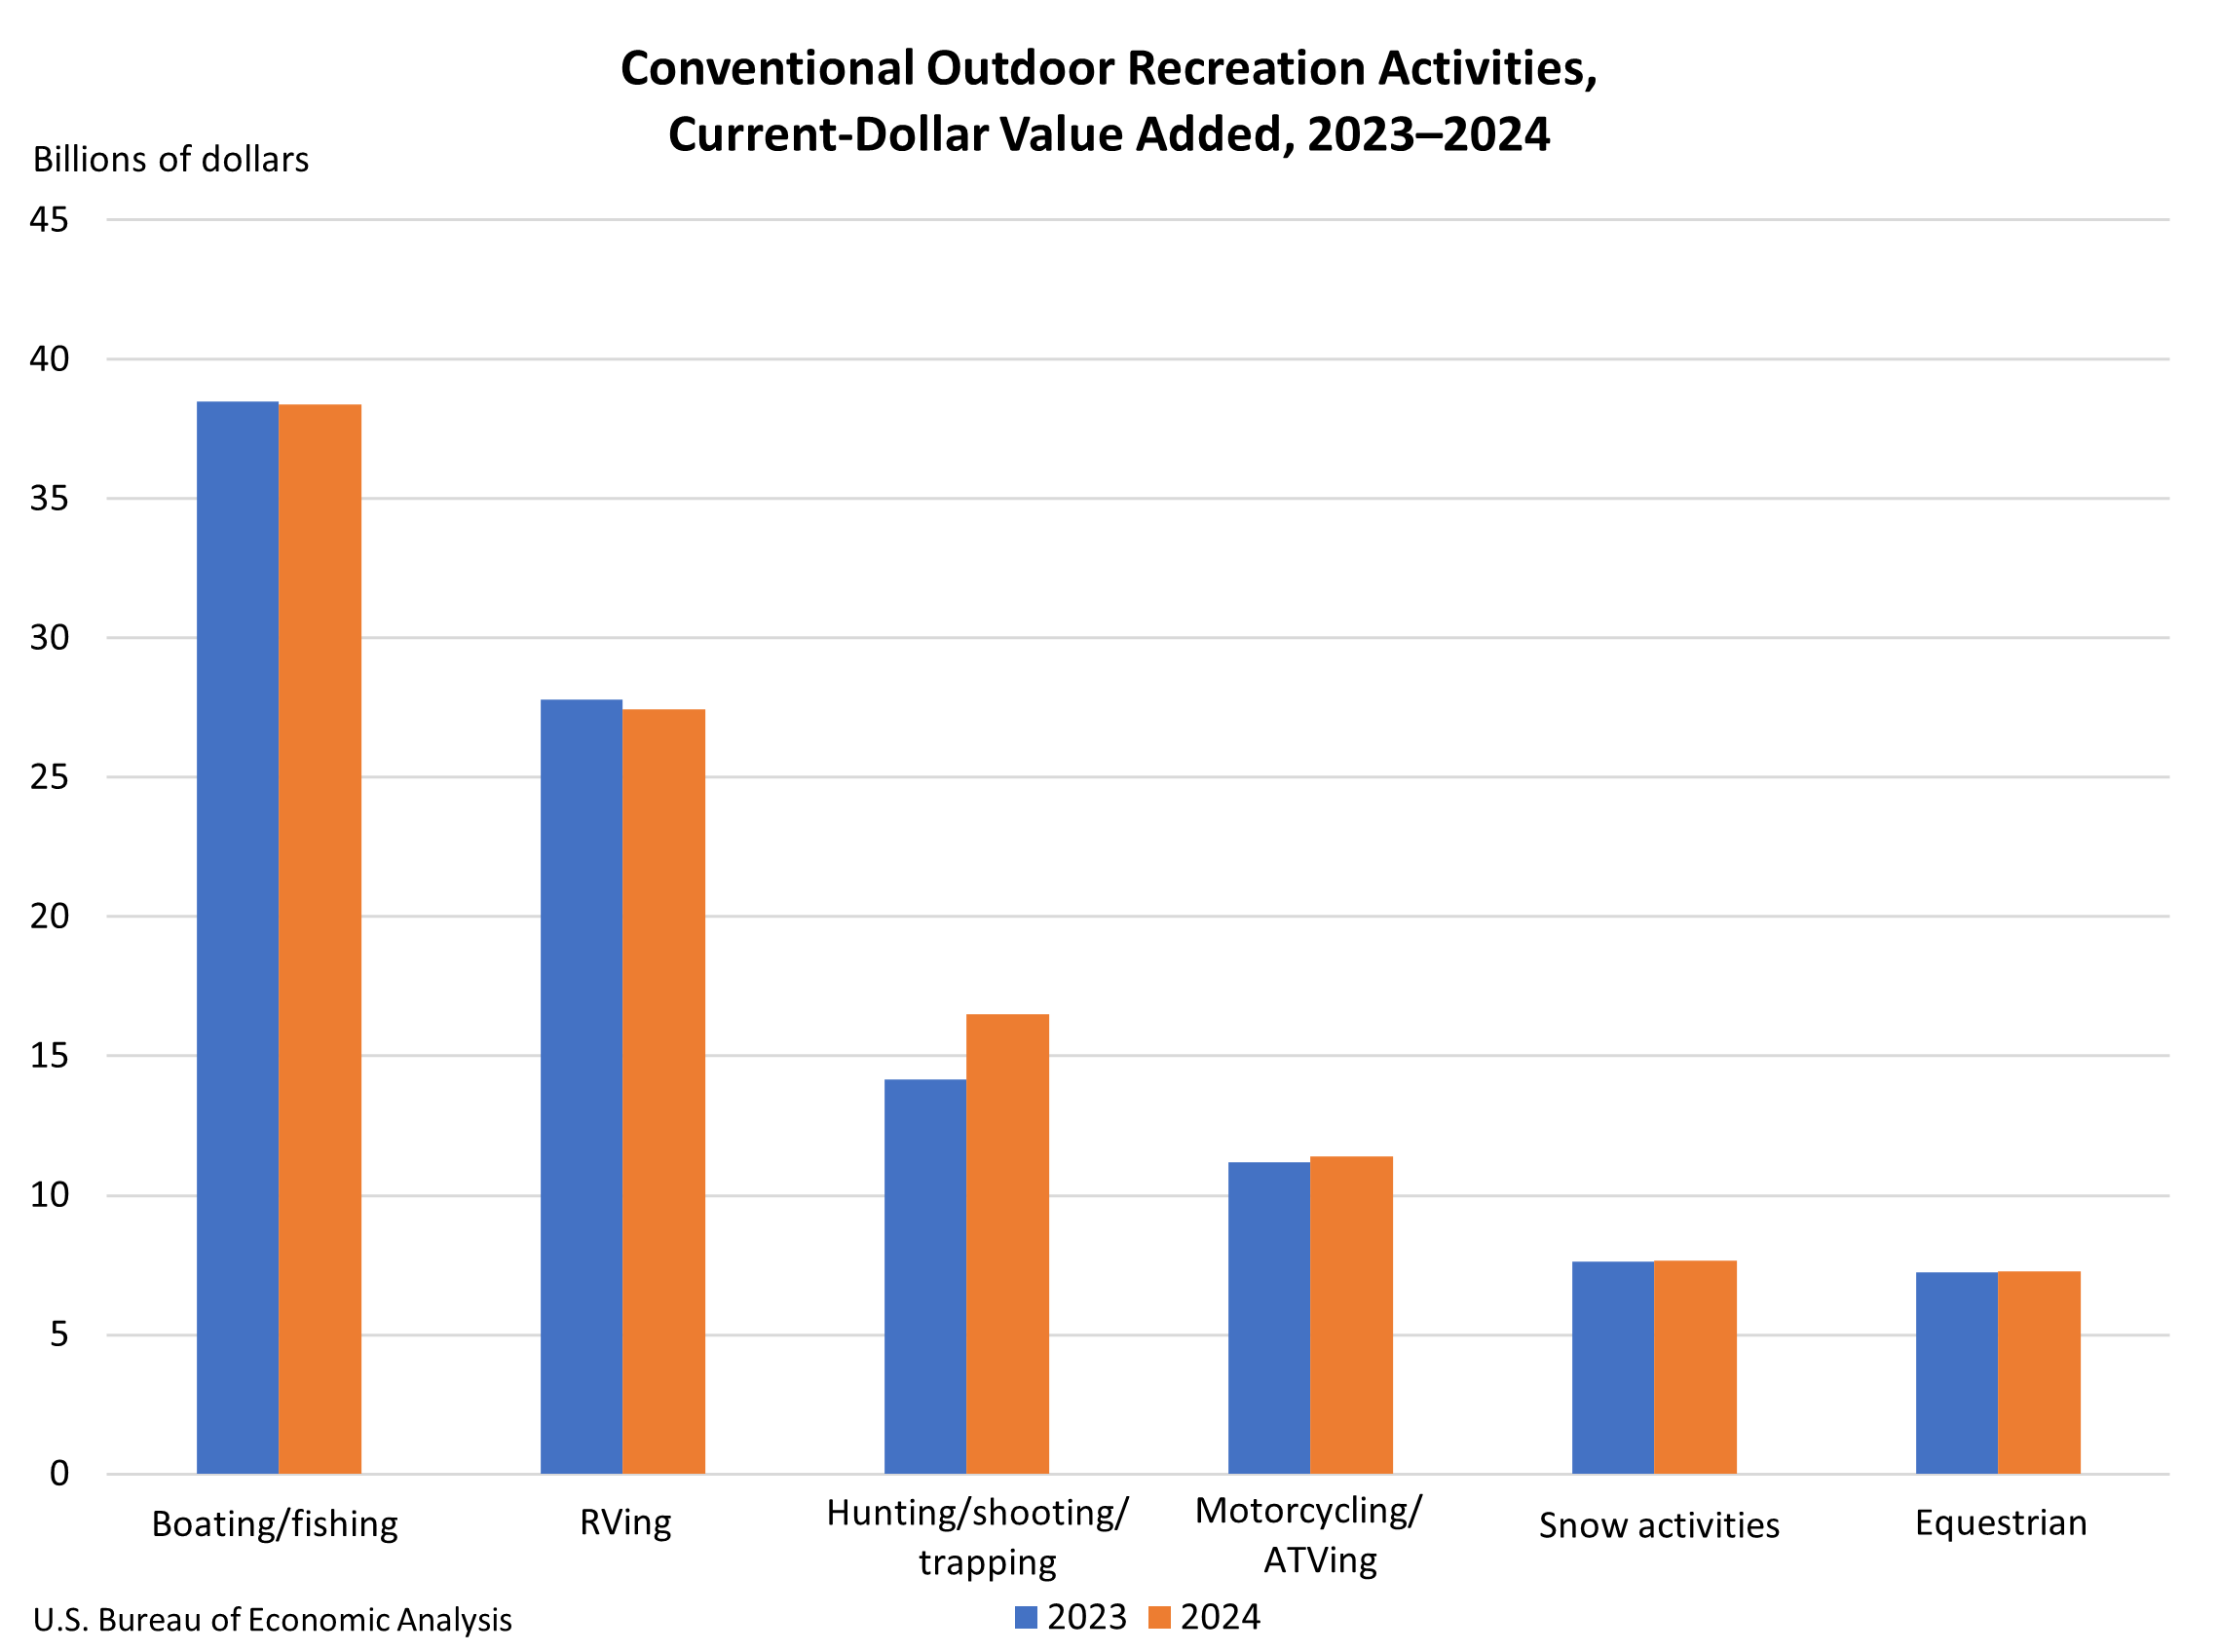
- Conventional Activities: These encompass traditional pursuits such as bicycling, boating, hiking, and hunting.
- Other Activities: This category includes pursuits like gardening and outdoor concerts.
- Supporting Activities: This crucial segment comprises industries that facilitate outdoor recreation, including construction, travel and tourism, local trips, and government expenditures.
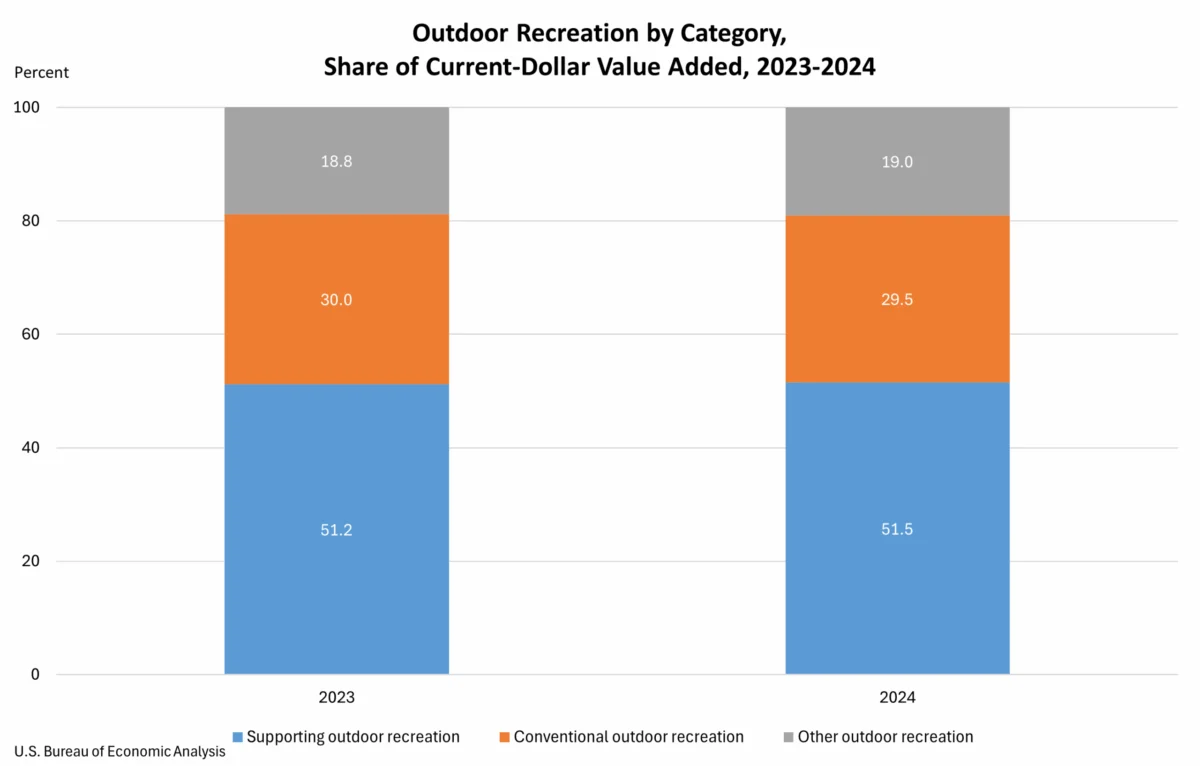
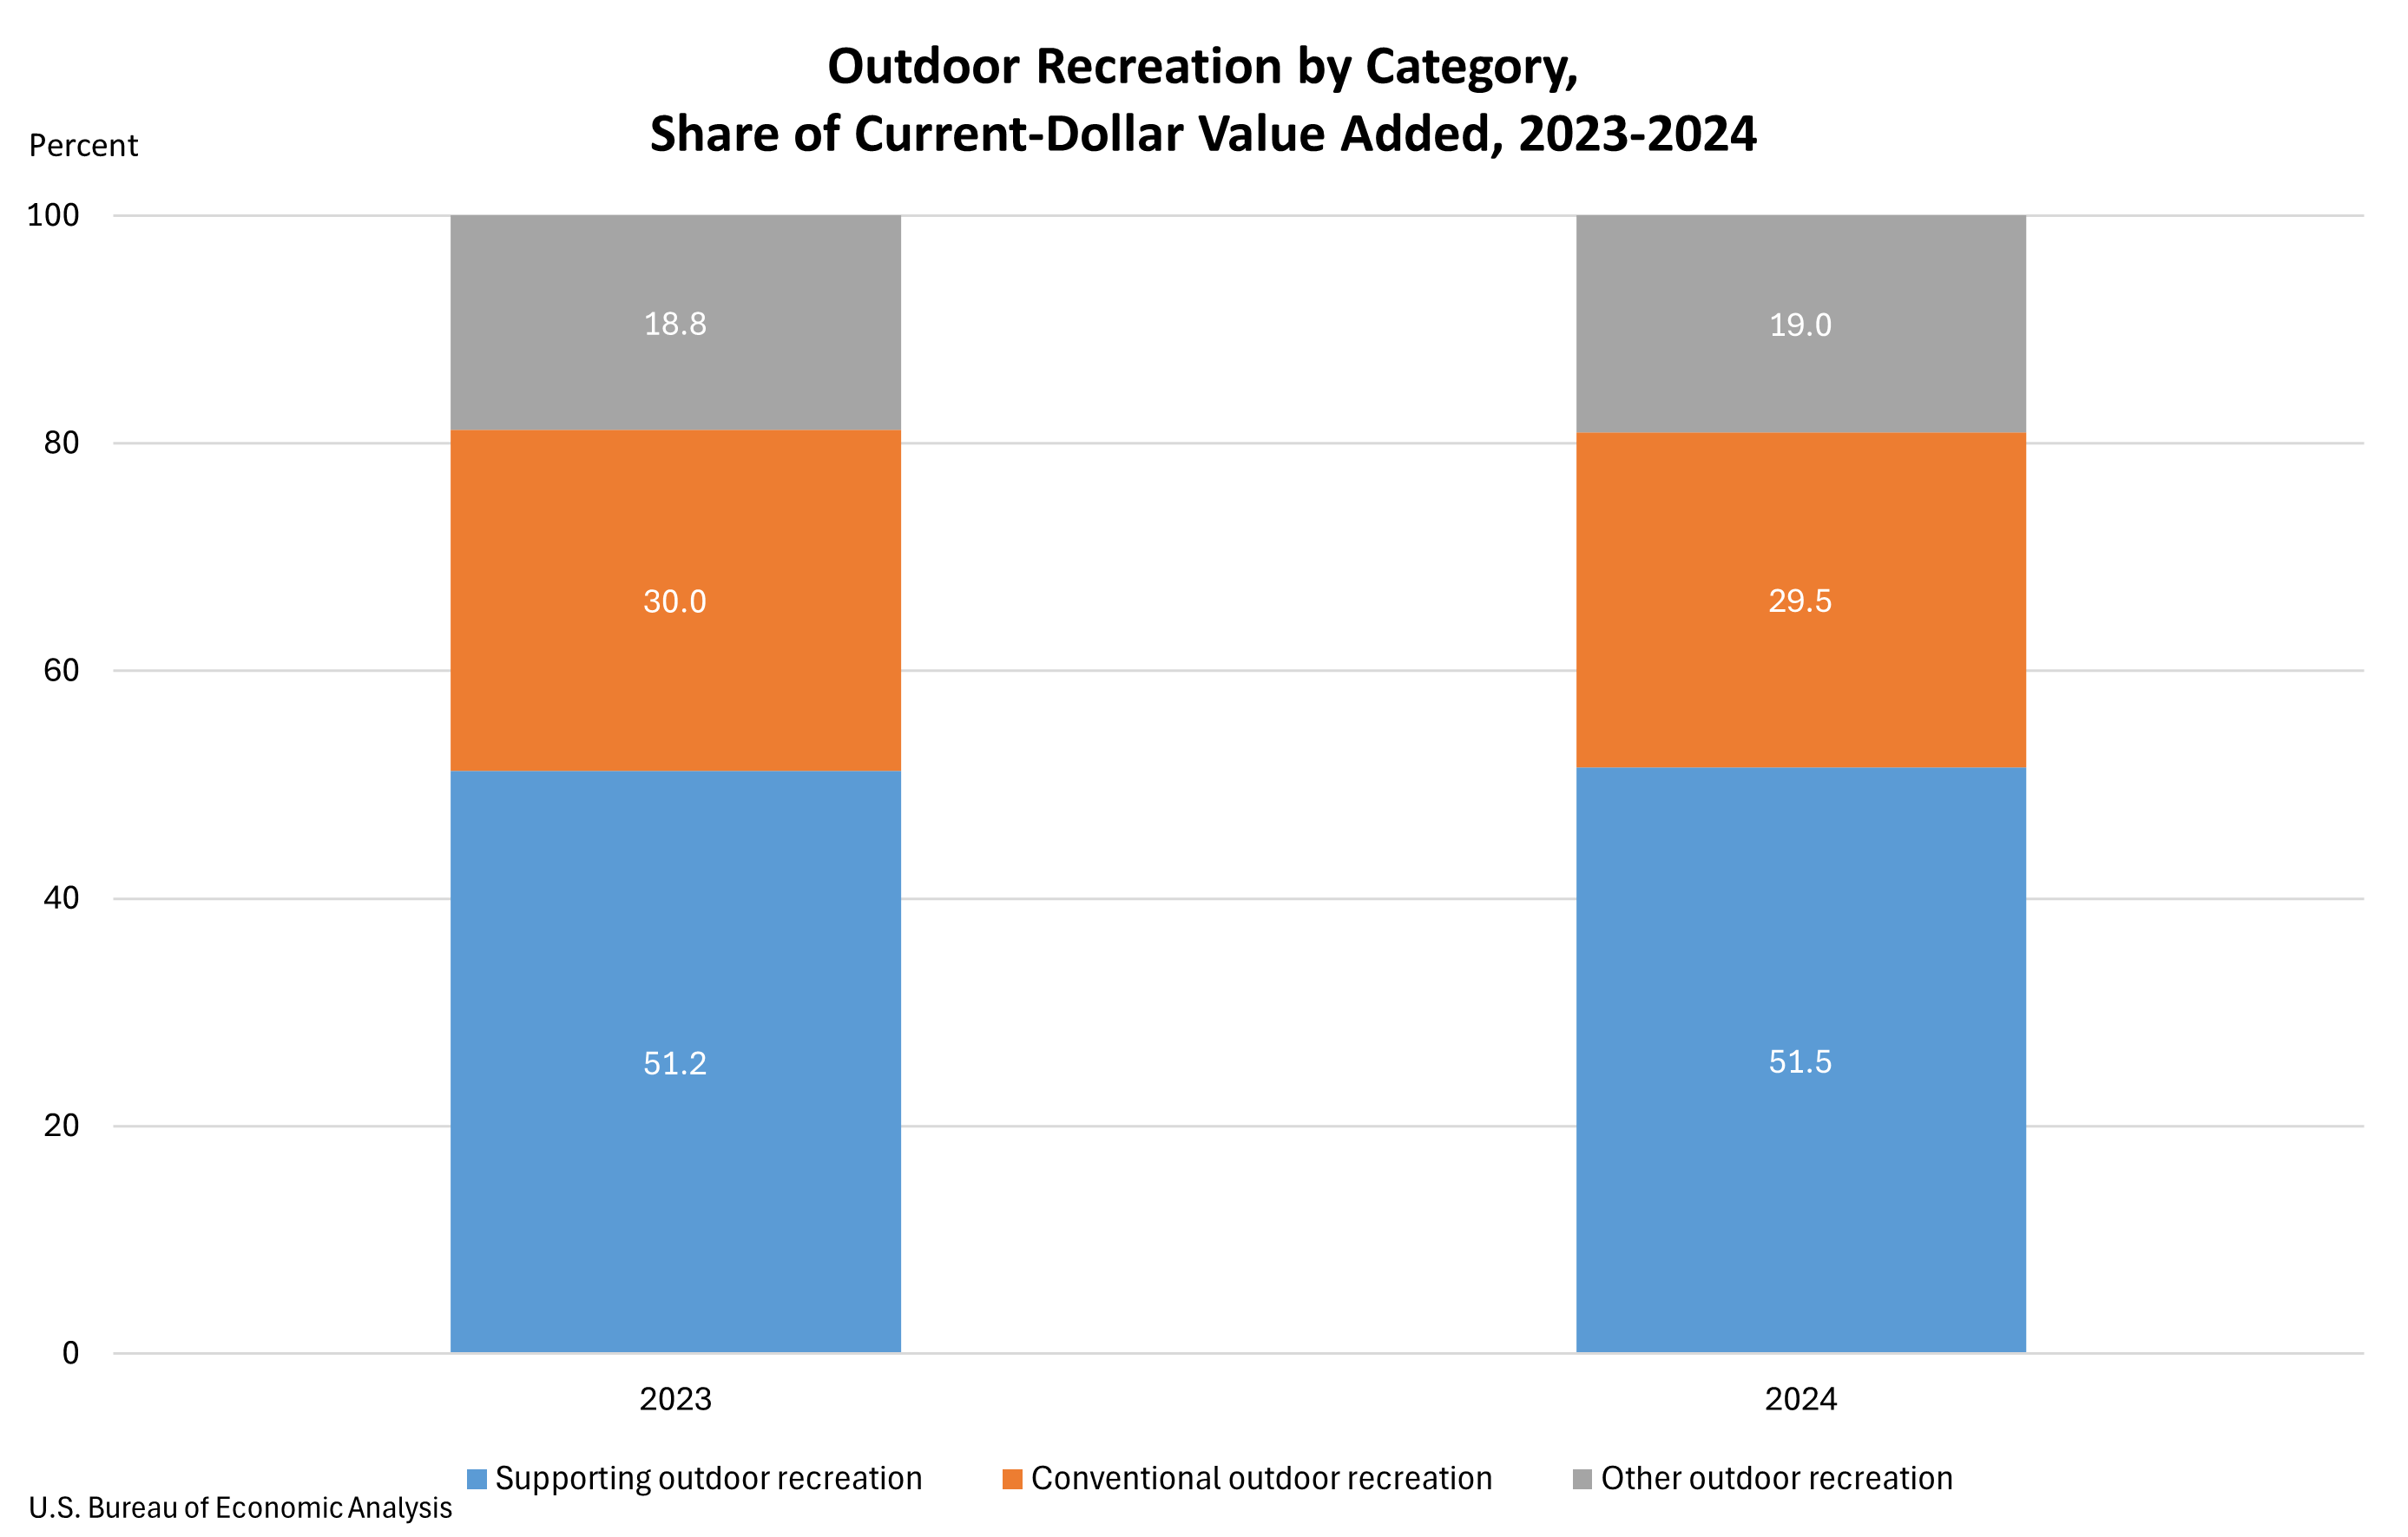
In 2024, supporting activities continued to be the largest contributor to the U.S. outdoor recreation value added, accounting for 51.5 percent. This share saw a slight increase from 51.2 percent in 2023. Within this category, travel and tourism, driven by spending on transportation, hotels, and restaurants, was a key growth engine. Conventional outdoor recreation activities represented 29.5 percent of value added in 2024, a marginal decrease from 30.0 percent in 2023. "Other outdoor recreation" activities accounted for 19.0 percent, a slight increase from 18.8 percent in the previous year.
The BEA’s national tables, particularly National Table 4, offer a detailed breakdown of these activity categories. This information is vital for understanding which facets of outdoor recreation are driving economic growth and where potential areas for investment and policy focus might lie. The slight shift in the share of value added, with supporting activities gaining ground, suggests an increasing reliance on the infrastructure and services that enable outdoor experiences, alongside the direct participation in activities themselves.
Industry Contributions to the Outdoor Recreation Economy
The BEA also meticulously tracks the contributions of various industries to the outdoor recreation economy. This granular view is essential for understanding the interconnectedness of different economic sectors and their role in supporting outdoor pursuits.
The arts, entertainment, recreation, accommodation, and food services industry group emerged as the largest contributor to U.S. outdoor recreation value added in 2024, accounting for $174.4 billion, or 25.0 percent of the total. This sector is directly linked to the services that enhance and enable outdoor experiences, from dining to lodging and entertainment. At the state level, this industry group was the primary driver of outdoor recreation value added in 23 states and the District of Columbia. California ($24.1 billion), Florida ($22.7 billion), and New York ($11.8 billion) led the nation in contributions from this sector.
Retail trade secured the second-highest position nationally, contributing $169.1 billion, or 24.3 percent of value added. This sector is crucial for providing the equipment, apparel, and gear necessary for a wide range of outdoor activities. Retail trade proved to be the largest industry contributor in 24 states. California ($19.3 billion), Texas ($14.4 billion), and Florida ($13.4 billion) were the top states in this category.
Manufacturing ranked as the third-largest industry group, contributing $91.3 billion, or 13.1 percent of value added. This sector is responsible for producing many of the goods used in outdoor recreation, from boats and bicycles to camping equipment and sporting goods. Manufacturing was the dominant industry in two states: Indiana and Louisiana. Texas ($13.1 billion), California ($11.6 billion), and Indiana ($9.1 billion) recorded the largest contributions from manufacturing to outdoor recreation value added.
The BEA’s National Table 3 and State Table 3 provide detailed breakdowns of these industry contributions, offering a comprehensive view of which sectors are most heavily invested in and benefit from the outdoor recreation economy. The significant contributions from retail and manufacturing underscore the tangible economic impact of outdoor pursuits, extending beyond direct service provision to the production of essential goods.
Historical Context and Future Outlook
The BEA’s annual release of outdoor recreation statistics is a testament to the growing recognition of this sector’s economic importance. The initiative to track and report these figures began with the establishment of the Outdoor Recreation Satellite Account (ORSA) in 2020, a landmark effort to quantify the economic contributions of outdoor recreation activities. This year’s release builds upon that foundation, incorporating updated data and refining existing estimates.
The BEA’s commitment to updating estimates from 2020 to 2023 reflects a dedication to providing the most accurate and up-to-date economic intelligence. The inclusion of newly available and revised source data, coupled with annual updates to the National and Regional Economic Accounts, ensures that the statistics are robust and reflect the most current economic realities.
The implications of these findings are far-reaching. For policymakers, the data offers compelling evidence to support investments in public lands, infrastructure for outdoor recreation, and initiatives that promote sustainable tourism. For businesses, it provides valuable market intelligence to guide strategic decisions, product development, and investment. For individuals, it highlights the economic significance of activities they enjoy and participate in, potentially fostering greater appreciation for the resources that support them.
The next release of Outdoor Recreation Economic Statistics, covering the year 2025, is anticipated in the Fall of 2026. This ongoing series of reports will continue to be a critical tool for understanding the dynamics of this vibrant and economically significant sector, offering a consistent and evolving picture of its contributions to the U.S. economy. The continued growth and resilience of the outdoor recreation economy, even amidst moderating growth rates, suggests its enduring appeal and its capacity to adapt and thrive in a changing economic landscape. The BEA’s comprehensive data collection and reporting are instrumental in illuminating this vital segment of the American economy.