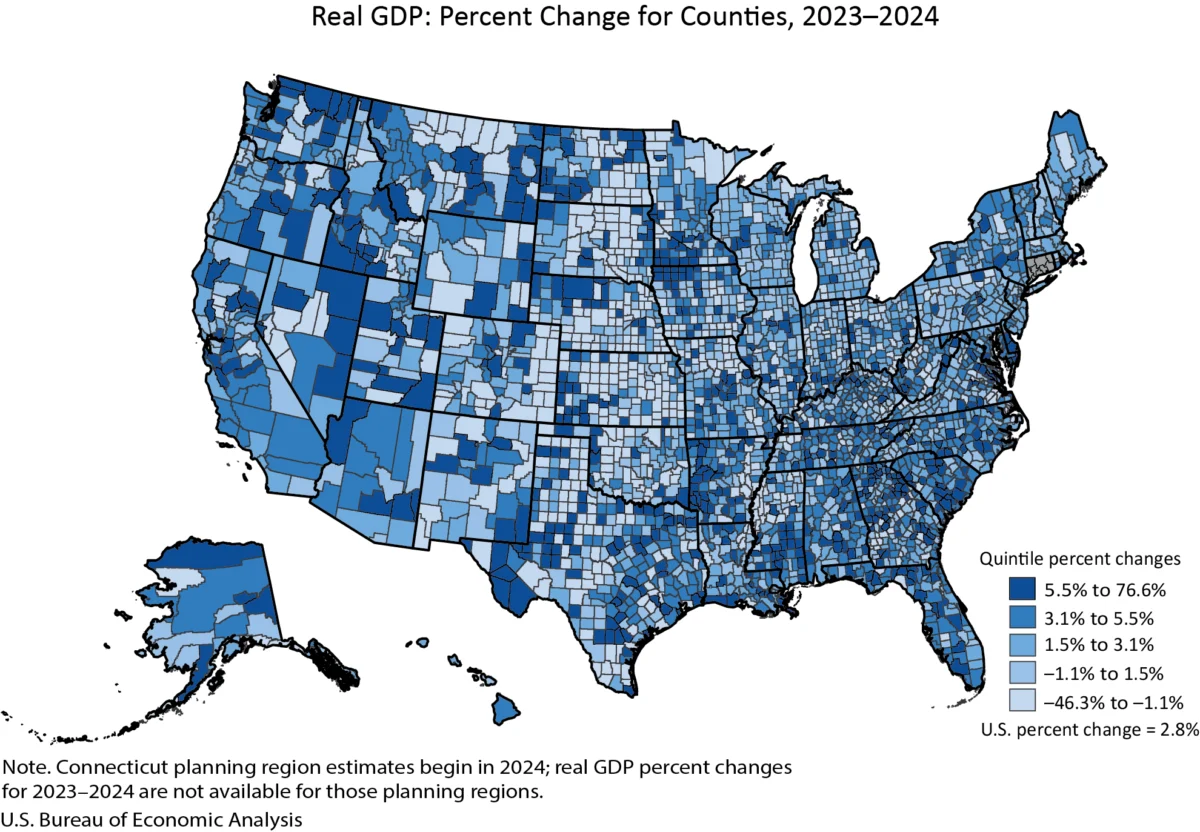
The U.S. Bureau of Economic Analysis (BEA) has released its latest county-level economic data, revealing a dynamic landscape across the nation in 2024. Real gross domestic product (GDP) experienced growth in a significant majority of counties, with 2,273 counties showing an increase, while 809 counties saw a decrease, and 24 remained unchanged. This data, reflecting the economic activity within individual local economies, offers a granular view of national trends and highlights the diverse economic fortunes of communities across the United States. The percent change in real GDP across all counties ranged from a remarkable surge of 76.6 percent in Carter County, Montana, to a substantial decline of 46.3 percent in Baca County, Colorado.
This comprehensive release, for the first time, consolidates annual GDP and personal income data by county into a single news release, aiming to provide a more holistic understanding of local economic health. The BEA’s decision to merge these previously separate reports signals a strategic move towards offering a more integrated economic narrative for American counties. This combined approach replaces two separate press releases, streamlining information dissemination and presenting a fuller picture of county economies simultaneously.
Economic Performance: A County-by-County Analysis
The BEA’s estimates for 2024 underscore the significant variations in economic performance at the county level. While over two-thirds of counties demonstrated economic expansion, the magnitude of these changes varied widely. Carter County, Montana, stands out with its impressive 76.6 percent GDP increase, a figure that suggests a significant boom in economic activity within that region. This could be attributed to various factors, such as resource extraction, agricultural output, or burgeoning local industries. Conversely, Baca County, Colorado, faced considerable economic headwinds, experiencing a 46.3 percent contraction in its real GDP. Such a sharp decline could point to significant challenges, perhaps related to the downturn in a key industry, outmigration, or broader economic disruptions.
The data also reveals the sheer scale of economic disparity between different counties. In 2024, the total level of real GDP, a measure of the total value of goods and services produced in a county, demonstrated this disparity. New York County, New York (Manhattan), continued its reign as a global economic powerhouse, with a real GDP of $813.7 billion. This figure alone dwarfs the total economic output of many states. At the other end of the spectrum, Issaquena County, Mississippi, recorded a real GDP of just $15.7 million, illustrating the vast differences in economic scale across the nation. These figures highlight the complex tapestry of the American economy, where metropolitan centers drive massive economic output while some rural and smaller counties grapple with significantly smaller economic bases.
Personal Income Trends Mirror Economic Activity
Complementing the GDP figures, the BEA also reported on personal income, a key indicator of household financial well-being. In 2024, personal income, measured in current dollars, saw an increase in 2,768 counties, a decrease in 331 counties, and remained unchanged in 7 counties. The percent change in personal income ranged from a robust 22.6 percent increase in Harding County, South Dakota, to a notable 23.3 percent decline in Issaquena County, Mississippi. The concurrent decline in both GDP and personal income in Issaquena County suggests a broad-based economic challenge in that region. Conversely, the strong growth in Harding County’s personal income, alongside its GDP performance, points to a period of significant economic uplift for its residents.
The distribution of personal income levels also reflects the economic stratification across the U.S. Los Angeles County, California, reported the highest total personal income at $818.5 billion, showcasing its immense economic influence and high population concentration. In contrast, Loving County, Texas, registered the lowest total personal income at $10.6 million. These figures underscore the direct correlation between economic output and the financial resources available to residents, a fundamental aspect of economic well-being.
A Deeper Dive: County Size and Economic Performance
The BEA’s analysis further breaks down economic trends by county population size, offering nuanced insights into how different types of communities are faring.
Large Counties (Population > 500,000): These economic giants, numbering 145 in 2024, experienced a predominantly positive trend, with 145 showing growth, none showing decline, and one remaining unchanged. The range of GDP growth in this category was from 0.0% in Johnson County, Kansas, to 10.7% in Pinal County, Arizona. Pinal County’s strong performance, particularly when considering its substantial population, suggests significant industrial or commercial expansion. The minimal or zero change in some large counties might indicate economic maturity, where growth is incremental rather than explosive, or that these economies are already operating at a high capacity. New York County (Manhattan) stands as a prime example of a large county with immense economic scale, contributing significantly to the nation’s GDP.
Medium Counties (Population 100,000 to 500,000): With 451 such counties, this group exhibited a healthy growth trend, with 451 showing increases, 20 declining, and 3 remaining unchanged. The GDP trend range here was from a -2.6% decline in Black Hawk County, Iowa, to a 12.4% increase in Jefferson County, Texas. Jefferson County’s robust growth indicates a thriving local economy, potentially driven by key industries like energy or manufacturing. The relatively small number of declining medium counties suggests a resilient economic base for many communities of this size.
Small Counties (Population < 100,000): This largest category, encompassing 1,677 counties, displayed the most varied economic performance. Of these, 1,677 saw GDP growth, 789 experienced a decline, and 20 remained unchanged. The trend range here was the most dramatic, mirroring the county-wide extremes: a 76.6% surge in Carter County, Montana, and a 46.3% decline in Baca County, Colorado. This wide spectrum highlights the vulnerability of smaller economies to specific industry fluctuations and external economic shocks, but also their potential for rapid growth when favorable conditions arise.

Updates and Methodological Changes
The release of the 2024 data is not merely an update but also incorporates significant methodological revisions. The estimates for 2024 are built upon annual updates to BEA’s GDP and personal income by county data, with revisions made to estimates from 2020 to 2023. These revisions integrate new and more comprehensive source data, ensuring greater accuracy and alignment with national economic accounts. Specifically, the county data has been synchronized with the annual update to the National Income and Product Accounts (NIPA) released on September 25, 2025, and the annual update to state-level GDP and personal income statistics released on September 26, 2025. This meticulous alignment process is crucial for maintaining the integrity and comparability of economic data across different levels of aggregation.
A notable geographical shift in the data presentation involves Connecticut. Beginning with the 2024 estimates, Connecticut’s economic data will be presented using its planning region geographic definitions rather than its traditional county definitions. This change, while creating a more localized statistical picture for Connecticut, means that these specific planning region estimates are not included in the national percent change ranges for counties in this release, as they represent a different geographical aggregation.
Furthermore, the BEA has introduced new estimates for per capita personal income for 2024, calculated using U.S. Census Bureau population figures for the period 2020 through 2024. Per capita personal income, a measure of average income per person, is a vital metric for understanding the economic well-being of residents within a specific area.
Strategic Shifts in Data Dissemination
The BEA has also implemented significant changes in how it disseminates county-level economic data. The decision to publish annual GDP and personal income by county in a single news release for the first time marks a strategic move towards integrated reporting. This consolidation aims to provide a more comprehensive and efficient overview of county economies.
In a broader shift affecting regional economic data, the BEA has discontinued the publication of statistics for metropolitan statistical areas (MSAs), micropolitan statistical areas, metropolitan divisions, combined statistical areas, and their metropolitan and nonmetropolitan portions. While GDP and personal income estimates will continue to be available by county, this discontinuation signifies a redirection of focus, emphasizing the granular county-level data as the primary reporting unit for these specific economic indicators. An FAQ on the BEA website provides further details on this change.
The presentation of tables has also been updated. Data previously embedded within the county news releases are now exclusively available through BEA’s online Interactive Data Application. This move aims to reduce redundancy, enhance efficiency, and direct users to a more flexible and comprehensive data platform. Customizable tables, offering full time series and various download options (PDF, Excel, CSV), are now accessible via links within the release.
Implications and Future Outlook
The detailed county-level data released by the BEA offers critical insights for policymakers, businesses, and researchers. For policymakers, understanding the economic disparities and growth trends at the local level is essential for targeted economic development initiatives, infrastructure investments, and fiscal policy decisions. Businesses can leverage this information for site selection, market analysis, and strategic planning. Researchers gain access to a rich dataset for in-depth economic studies and trend analysis.
The divergence in economic performance across counties highlights the importance of localized economic strategies. While large metropolitan areas often drive national economic growth, the vitality of smaller and rural communities is crucial for the overall health and equity of the nation’s economy. The significant growth in some smaller counties, such as Carter County, MT, demonstrates that economic opportunity is not solely concentrated in urban centers. Conversely, the declines observed in counties like Baca County, CO, underscore the persistent challenges faced by some regions and the need for continued support and adaptive economic strategies.
The BEA’s commitment to refining its data collection and presentation methods, including the integration of new data sources and the shift towards online interactive tools, signals an ongoing effort to provide the most accurate and accessible economic information. The discontinuation of MSA-level data, while a change, focuses resources on the county level, which can offer a more granular and potentially more responsive view of local economic dynamics.
The next release of GDP and personal income by county statistics is scheduled for December 2, 2026, at 8:30 a.m. EST, covering the 2025 data. This will supersede the 2024 data, with earlier figures archived for historical reference. The continuous release of these statistics provides a vital pulse on the American economy, offering an indispensable resource for understanding and navigating the complex economic landscape of the United States at its most fundamental level.