

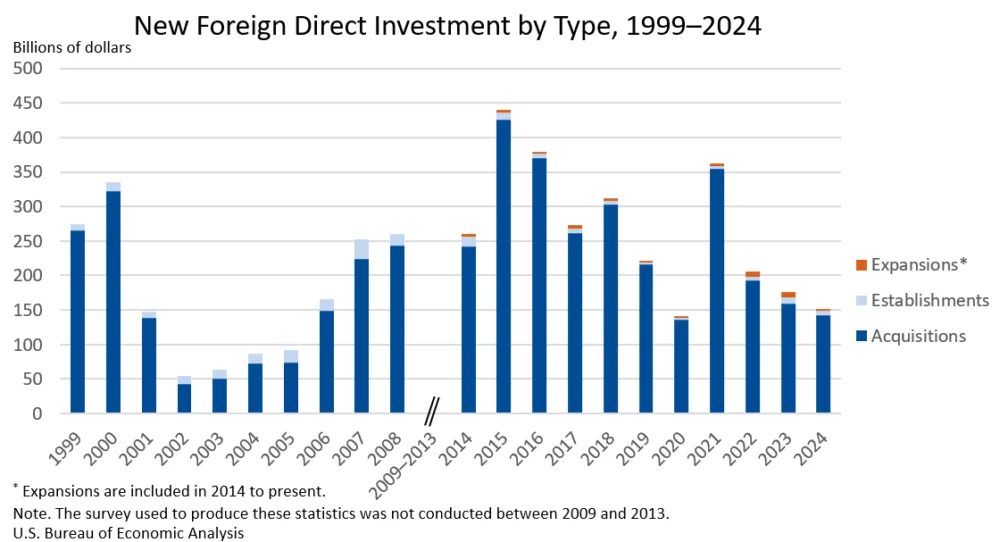
Expenditures by foreign direct investors to acquire, establish, or expand U.S. businesses totaled $151.0 billion in 2024, according to preliminary statistics released today by the U.S. Bureau of Economic Analysis (BEA). This represents a significant decrease of $24.9 billion, or 14.2 percent, from the revised 2023 figure of $176.0 billion. The 2024 total also falls considerably below the annual average of $277.2 billion recorded for the decade spanning 2014 to 2023, indicating a notable slowdown in new foreign investment.
Acquisitions of existing U.S. businesses remained the dominant form of foreign direct investment (FDI), accounting for the largest portion of the expenditures. In 2024, $143.0 billion was directed towards acquisitions, while $6.3 billion was invested in establishing new U.S. businesses, and $1.8 billion was allocated to expanding existing foreign-owned businesses. The BEA also reported planned total expenditures, which encompass both first-year and anticipated future outlays, at $157.0 billion, suggesting a slightly more optimistic outlook for upcoming investment beyond the initial year.
The impact of this investment on the U.S. labor market is also reflected in the BEA data. In 2024, newly acquired, established, or expanded foreign-owned businesses in the United States provided employment for 204,200 individuals. This figure highlights the ongoing role of FDI in job creation and economic activity across the nation.
A Closer Look at Investment Trends
The BEA’s detailed breakdown reveals significant sectoral and geographical concentrations of foreign investment. The manufacturing sector emerged as the primary recipient of new direct investment in 2024, attracting $67.7 billion, which constituted 44.9 percent of all expenditures. Within manufacturing, the chemical manufacturing sub-sector saw the largest share of investment, with $23.7 billion. Other key sectors attracting substantial foreign capital included finance and insurance, with $23.2 billion, and utilities, which received $16.0 billion in investment.
On a country-by-country basis, Ireland emerged as the leading investor in U.S. businesses in 2024, contributing $30.1 billion. Canada followed closely with $23.9 billion in investment. Geographically, Europe was the most significant source of new FDI, injecting $96.7 billion into the U.S. economy, representing 64.0 percent of the total. The Asia and Pacific region was the second-largest investing bloc, with expenditures totaling $23.2 billion.
At the state level, Texas garnered the largest share of investment expenditures in 2024, with $22.8 billion. Georgia also experienced substantial foreign investment, receiving $16.3 billion, followed by California with $12.9 billion. These figures underscore the continued attractiveness of these states for foreign businesses seeking to establish or expand their operations in the U.S.
Greenfield Investments: Laying the Foundation for Future Growth
Greenfield investments, which involve the establishment of new businesses or the expansion of existing foreign-owned ones, represented a smaller but still significant component of FDI. In 2024, greenfield expenditures amounted to $8.1 billion. The professional, scientific, and technical services sector led in greenfield investment, attracting $2.8 billion, with management, scientific, and technical consulting services being a key driver within this category ($1.6 billion).
By region, Europe again demonstrated strong engagement in greenfield projects, contributing $3.8 billion. Latin America and the Other Western Hemisphere region followed with $1.4 billion, and Asia and the Pacific invested $1.2 billion. At the state level, Wyoming attracted the highest level of greenfield investment, with $2.0 billion, followed by New Mexico at $1.4 billion. Planned total expenditures for greenfield investment initiated in 2024, including future outlays, reached $14.1 billion, signaling a commitment to long-term development.
Employment Dynamics in Foreign-Owned Enterprises
The BEA data also provides insights into employment figures associated with FDI. In 2024, the current employment within newly acquired enterprises stood at 203,600. When considering planned employment for newly established businesses and expansions, the total projected workforce reached 213,200.
The manufacturing sector accounted for the largest share of current employees in foreign-owned businesses, with 73,600 individuals. By country of origin, Ireland and Canada were significant employers, with 43,100 and 37,500 employees, respectively. Florida led the states in employment generated by new FDI, with 32,700 jobs, followed by Texas (18,200) and New York (14,200).
Revisions to 2023 Data Highlight Shifting Investment Landscape
The BEA’s release also included significant revisions to the 2023 foreign direct investment figures. Previously published first-year expenditures for 2023 were $148.8 billion, but this has been revised upwards to $176.0 billion. This upward revision indicates a stronger investment climate in 2023 than initially reported, driven by substantial increases in acquisitions ($158.7 billion from a prior estimate of $136.5 billion) and expansions ($8.3 billion from $5.0 billion). Planned total expenditures for 2023 were also revised upwards significantly, from $175.9 billion to $218.8 billion, suggesting a more robust pipeline of future investment.
These revisions provide a more accurate picture of the FDI landscape in recent years and offer a crucial baseline for understanding the current year’s trends. The substantial decrease observed in 2024, therefore, appears more pronounced when viewed against this revised and more robust 2023 data.
Broader Implications and Context
The decline in foreign direct investment in 2024, while notable, occurs within a complex global economic environment characterized by shifting geopolitical dynamics, evolving trade policies, and ongoing efforts to manage inflation and interest rates. While acquisitions continue to be the primary driver of FDI, the decrease in overall expenditures could be influenced by a variety of factors. These might include increased global competition for investment capital, greater economic uncertainty in some regions, or strategic shifts by multinational corporations.
The BEA’s detailed reporting on industry, country, and state-level investment provides policymakers and business leaders with valuable data for strategic planning. The strong performance of the manufacturing and finance sectors suggests areas of sustained interest for foreign investors, while the leading roles of Europe and specific countries like Ireland and Canada highlight key international partnerships. The distribution of investment across states also points to regional economic strengths and the continued appeal of certain U.S. markets.
The emphasis on greenfield investments is particularly important for long-term economic development. These investments not only bring capital but also new technologies, management expertise, and often represent a more significant commitment to establishing a physical presence and creating jobs from the ground up. The BEA’s updated data tables and supplemental resources offer a comprehensive toolkit for stakeholders to delve deeper into these trends and their potential implications for U.S. economic growth and competitiveness.
The discontinuation of certain historical data tables concerning sales, net income, and balance sheets of new affiliates, now archived, signifies an evolution in how statistical information is presented. This move, along with the ongoing refinement of data accessibility through interactive applications and supplemental tables, aims to streamline the dissemination of critical economic data for analysis and decision-making. As the BEA prepares to release its 2025 foreign direct investment statistics in July 2026, the current data for 2024 will become a part of the historical archive, offering a valuable record for future economic research and policy evaluations.


