Lana Rhoades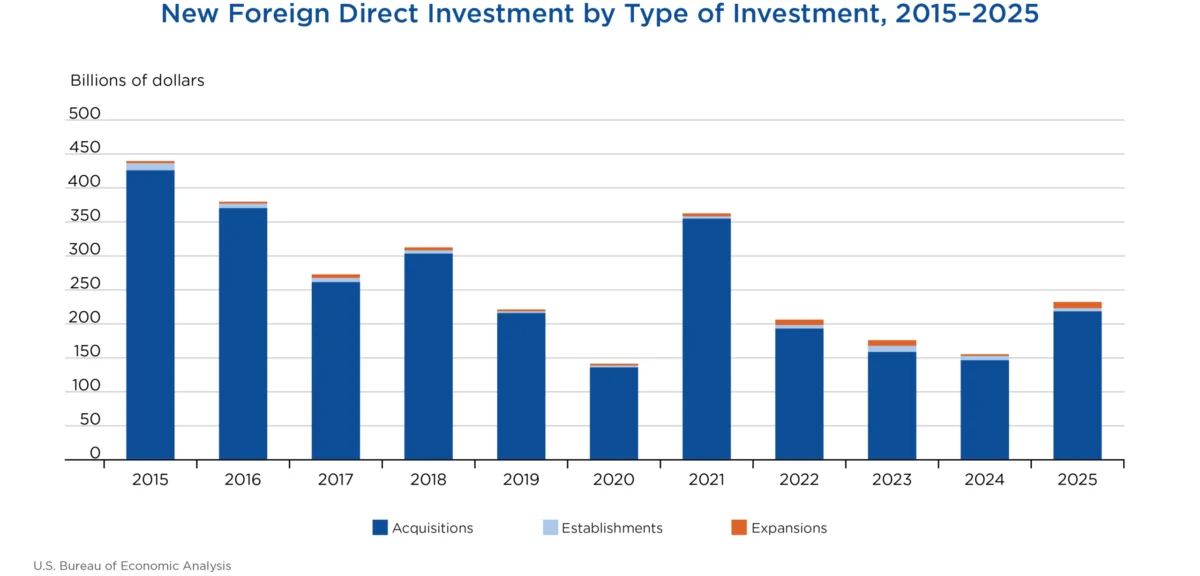
The United States witnessed a significant surge in foreign direct investment (FDI) in 2025, with expenditures totaling $232.2 billion to acquire, establish, or expand U.S. businesses. This represents a substantial increase of $76.8 billion, or 49.5 percent, compared to the $155.3 billion recorded in 2024, according to preliminary statistics released by the U.S. Bureau of Economic Analysis (BEA). Acquisitions of existing U.S. companies remained the dominant form of FDI, underscoring a trend that has characterized foreign investment in the American economy for years.
This robust growth in FDI signals a strong confidence from international investors in the U.S. economic landscape, despite potential global economic headwinds and evolving geopolitical dynamics. The substantial uptick suggests that the United States continues to be a premier destination for global capital seeking opportunities for growth, market access, and strategic positioning. The BEA’s revised figures for 2024 also indicate a more dynamic investment environment than initially reported, with first-year expenditures for that year revised upward from $151.0 billion to $155.3 billion, further emphasizing a positive trajectory.
Key Investment Drivers and Sectoral Breakdown
In 2025, the lion’s share of FDI was directed towards the acquisition of established U.S. businesses, accounting for $218.4 billion. Expenditures for establishing new U.S. businesses, often referred to as greenfield investments, reached $4.6 billion, while investments aimed at expanding existing foreign-owned businesses amounted to $9.2 billion. The total planned expenditures, encompassing both initial outlays and anticipated future investments, reached an impressive $284.5 billion, indicating a long-term commitment from foreign investors.
The manufacturing sector emerged as a primary beneficiary of this investment wave, attracting $121.8 billion, which constituted 52.5 percent of the total expenditures. Within manufacturing, specific sub-sectors demonstrated particularly strong appeal. Publishing industries led the charge with $50.7 billion in new direct investment, followed closely by chemicals manufacturing at $45.4 billion. Plastics and rubber products manufacturing also saw significant interest, with $19.0 billion invested. This concentration in manufacturing highlights the ongoing global demand for U.S. production capabilities, advanced technology, and skilled labor.
Beyond manufacturing, other sectors also drew considerable foreign capital, though at lower magnitudes. The BEA’s detailed data tables, available in the Supplemental Data section of their website, provide a granular view of these investments across various industries. These tables are crucial for understanding the nuanced flow of capital and identifying emerging investment trends.
Geographic Origin of Investment
Geographically, Japan was the leading source of FDI in 2025, investing $50.5 billion in the U.S. economy. Germany followed with $26.7 billion, and Canada contributed $23.5 billion. This trio of nations has consistently been among the top investors in the U.S., reflecting deep-seated economic ties and strategic partnerships.
On a regional basis, Europe emerged as the most significant investing bloc, contributing $116.6 billion, or 50.2 percent of all new FDI. The Asia and Pacific region was the second-largest contributor, with expenditures totaling $71.9 billion. This broad-based investment from major global economic powers underscores the United States’ continued attractiveness as a stable and lucrative market.
State-Level Impact and Greenfield Investments
California continued to be a magnet for foreign investment, attracting $59.7 billion in first-year investment expenditures in 2025. Texas followed with $21.5 billion, and Pennsylvania secured the third position with $20.9 billion. These states, known for their diverse economies, robust infrastructure, and skilled workforces, consistently rank high in attracting FDI.
Greenfield investments, which involve the creation of new businesses or the expansion of existing ones, totaled $13.8 billion in 2025. The transportation and warehousing sector led greenfield expenditures with $3.6 billion, indicating a growing need for logistics and supply chain infrastructure. Computers and electronics products manufacturing attracted $2.0 billion, while chemicals manufacturing received $1.8 billion in greenfield investments.
Investors from the Asia and Pacific region were particularly active in greenfield projects, contributing $8.3 billion. Australia led this group with $3.0 billion, followed by South Korea ($2.2 billion) and Japan ($1.7 billion). At the state level, Louisiana saw significant greenfield investment ($3.0 billion), followed by Arizona ($2.7 billion) and Texas ($1.9 billion). Planned total expenditures for greenfield investments initiated in 2025 reached $66.1 billion, signaling substantial future growth and job creation from these new ventures.
Employment Implications and Trends
The influx of FDI in 2025 had a direct impact on U.S. employment. A total of 213,100 employees were employed in newly acquired, established, or expanded foreign-owned businesses. Of this, current employment in acquired enterprises stood at 211,700. The total planned employment, encompassing current positions and projected future hires in new and expanded businesses, was estimated at 232,400.
By industry, plastics and rubber parts manufacturing provided the largest number of current employees (21,800), followed by transportation equipment manufacturing (17,300) and primary and fabricated metals manufacturing (16,400). This distribution highlights the labor-intensive nature of certain manufacturing sub-sectors and their reliance on foreign investment for sustained growth and employment.
Mexico was the leading country of origin for current employees, accounting for 54,600 jobs. Canada followed with 29,500 employees, and the United Kingdom contributed 26,800. California led the states in terms of current employment resulting from new FDI, with 37,200 jobs, followed by Illinois (17,600) and Texas (16,500). These figures underscore the widespread economic benefits of FDI across various regions and industries within the United States.
Revisions to 2024 Data and Methodological Notes
The BEA’s release also included important revisions to the 2024 FDI statistics. First-year expenditures for 2024 were revised upward to $155.3 billion from the previously reported $151.0 billion. This upward revision was seen across all categories: U.S. businesses acquired (revised to $146.4 billion from $143.0 billion), U.S. businesses established (revised to $6.4 billion from $6.3 billion), and U.S. businesses expanded (revised to $2.5 billion from $1.8 billion). Planned total expenditures for 2024 were also revised upwards to $164.0 billion from $157.0 billion.
These revisions reflect the dynamic nature of data collection and reporting in economics. The BEA employs a rigorous disclosure avoidance method that includes rounding, aggregation, and the use of ranges to protect the confidentiality of survey respondents while enabling the publication of more detailed data. This approach, which does not involve cell suppression or noise infusion, allows for greater transparency and accessibility of economic statistics.
Broader Economic Context and Future Outlook
The substantial increase in FDI in 2025 occurs against a backdrop of a global economy grappling with inflation, supply chain disruptions, and geopolitical uncertainties. The strong performance of U.S. FDI suggests that the nation’s inherent strengths – a large consumer market, a stable legal framework, technological innovation, and a skilled workforce – continue to outweigh these challenges for international investors.
The BEA’s data provides a critical snapshot of the U.S. economy’s integration into the global financial system. The trends observed in 2025, particularly the dominance of acquisitions and the strength in manufacturing, point towards a strategy by foreign investors to gain immediate market access and leverage existing U.S. industrial capabilities. The significant planned future expenditures suggest that this investment activity is likely to continue, with potential for further job creation and economic growth in the coming years.
The next release from the BEA, scheduled for June 2027, will provide statistics for New Foreign Direct Investment in the United States for 2026. This upcoming data will be crucial for assessing the sustained momentum of FDI and identifying any shifts in investment patterns as the global economic landscape continues to evolve. Investors, policymakers, and industry analysts will be closely watching these future releases to gauge the long-term impact of this latest surge in foreign investment on the U.S. economy. The detailed data tables made available by the BEA serve as an invaluable resource for in-depth analysis and informed decision-making, enabling a comprehensive understanding of the complex dynamics of global capital flows into the United States.