Lana Rhoades
The U.S. current-account deficit, a key measure of a nation’s international economic transactions, expanded by $5.8 billion, or 2.6 percent, to reach $226.8 billion in the first quarter of 2026. This widening, as reported by the U.S. Bureau of Economic Analysis (BEA) in its latest release, indicates a notable shift in the nation’s balance of trade and income flows with the rest of the world. The deficit was previously recorded at $221.1 billion in the revised fourth quarter of 2025.
This increase in the current-account deficit means that the United States spent more on foreign goods, services, and income payments than it earned from exports and income received from abroad. On a relative basis, the deficit accounted for 2.9 percent of current-dollar gross domestic product (GDP) in the first quarter, a marginal uptick from 2.8 percent in the preceding quarter, underscoring its persistent significance in the U.S. economic landscape.
Underlying Dynamics of the Widening Deficit
The primary driver behind the first-quarter expansion of the current-account deficit was a significant reversal in the balance on primary income. This component, which includes earnings on foreign investments by U.S. residents and payments to foreign investors in the U.S., swung from a surplus in the fourth quarter of 2025 to a deficit in the first quarter of 2026. While the exact figures for this shift were not detailed in the initial release beyond its impact on the overall deficit, such a reversal can stem from various factors, including increased dividend payments to foreign shareholders, higher interest payments on foreign-held U.S. debt, or a decline in income earned by U.S. entities abroad.
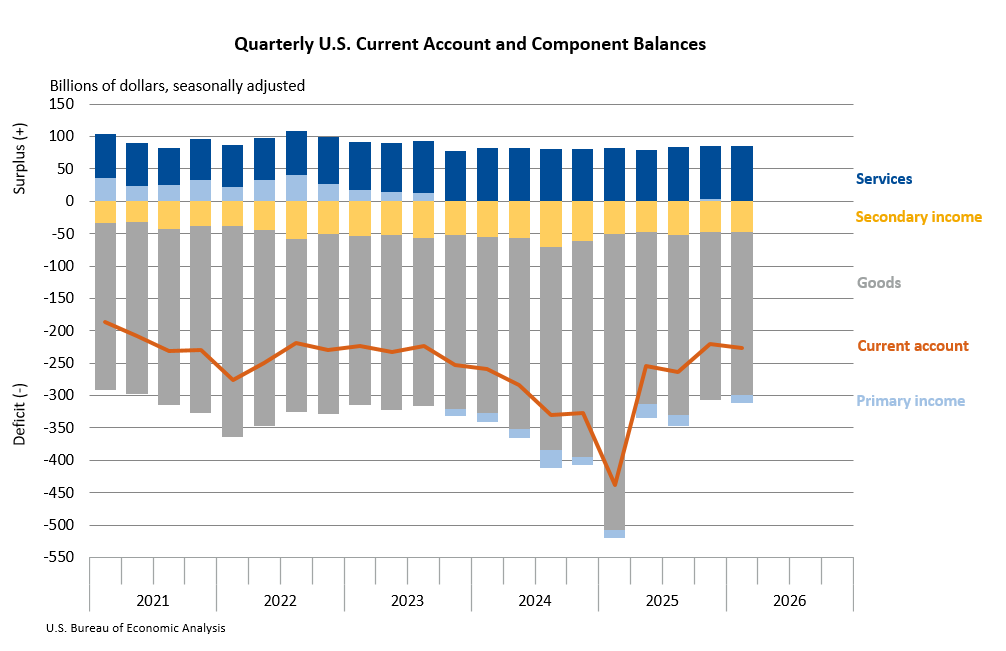
This negative swing in primary income was partially counteracted by a reduction in the deficit on goods. The balance of trade in goods, which has historically been a significant contributor to the U.S. current-account deficit, saw a decrease in its negative balance. This improvement could be attributed to a stronger performance in U.S. goods exports or a moderation in goods imports.
Trade in Goods and Services: A Mixed Picture
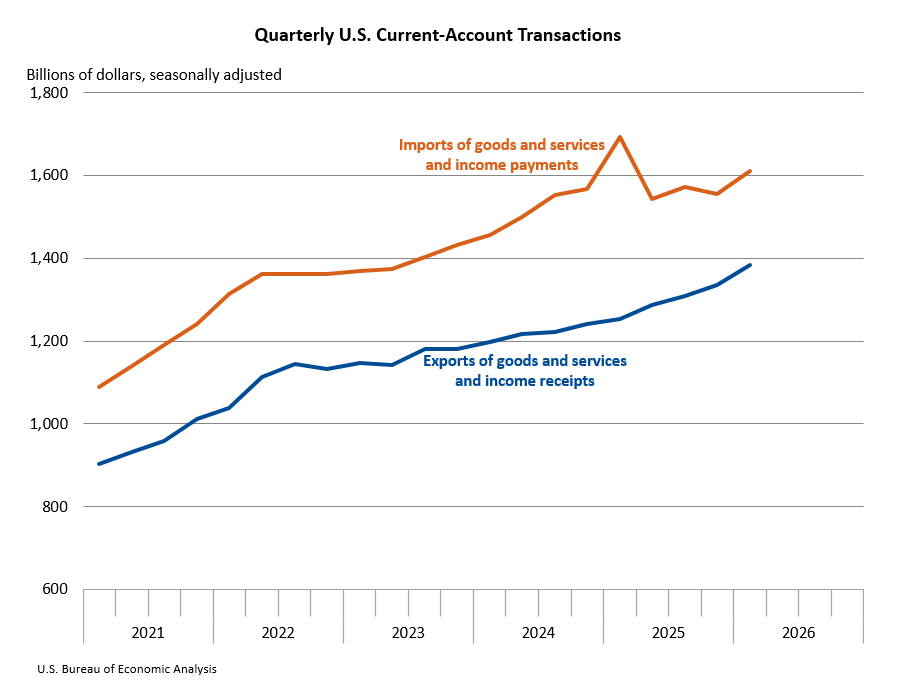
Overall exports of goods and services to, and income received from, foreign residents saw a substantial increase of $50.0 billion, bringing the total to $1.38 trillion in the first quarter. This growth was largely propelled by an expansion in goods exports. However, this positive momentum was tempered by a decrease in primary (earned) income receipts from abroad, suggesting that while U.S. companies sold more goods internationally, their earnings from overseas operations or investments may have experienced a setback.
Conversely, imports of goods and services from, and income paid to, foreign residents rose more sharply, by $55.8 billion, to a total of $1.61 trillion. This increase was fueled by both higher goods imports and a rise in primary (earned) income payments made to foreign residents. The larger increase in imports compared to exports contributed to the widening of the overall deficit.
Capital Transfers and Financial Account Transactions
In addition to the current account, the BEA report also provides insights into capital transfers and the financial account. Capital-transfer receipts experienced a notable increase of $3.3 billion, reaching $3.4 billion in the first quarter. Conversely, capital-transfer payments saw a decrease of $0.9 billion, settling at $2.0 billion. These transfers, which involve the movement of assets without any compensation, can influence the overall balance of international payments.
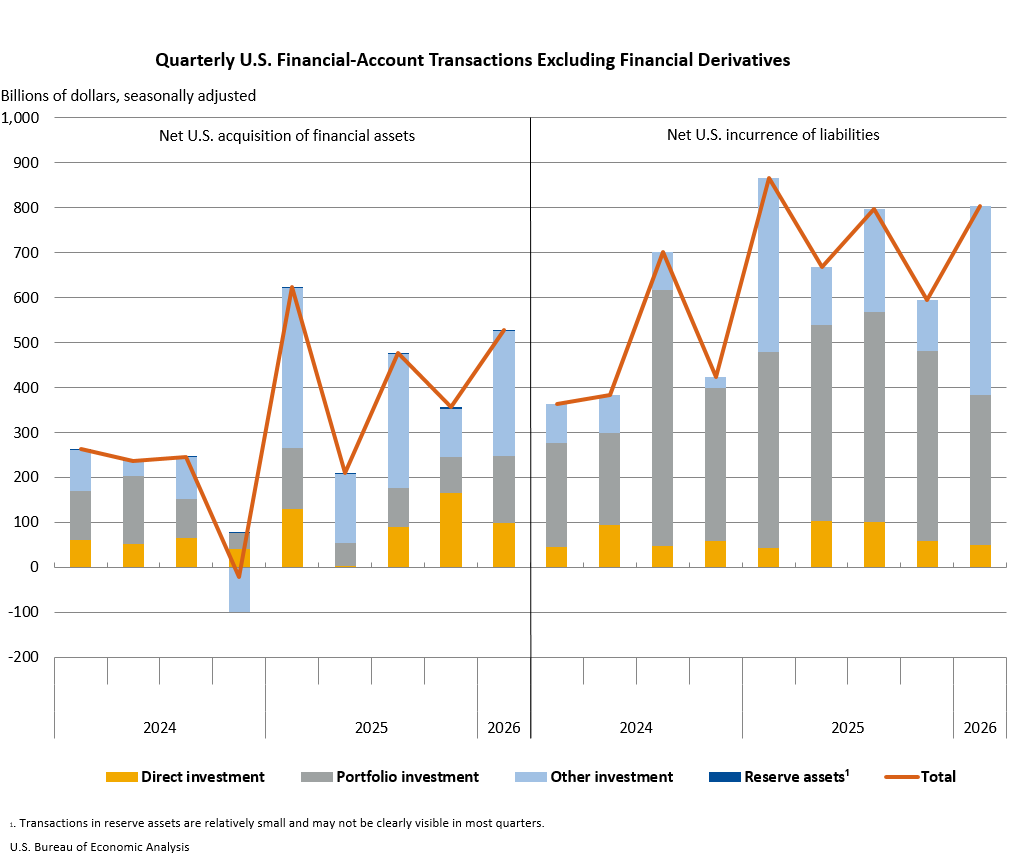
The net financial-account transactions for the first quarter of 2026 were recorded at -$209.0 billion. This figure represents net U.S. borrowing from foreign residents, indicating that foreign entities made greater investments in U.S. assets or provided more financing to the U.S. than U.S. residents did in foreign assets. Specifically, U.S. residents’ foreign financial assets increased by $527.3 billion, while U.S. liabilities to foreign residents, representing foreign ownership of U.S. assets or U.S. debt held by foreigners, surged by $803.7 billion.
It is important to note a clarification provided by the BEA regarding the net financial-account transactions figure. The initial release contained a typographical error where the negative sign was inadvertently omitted from the -$209.0 billion figure. This error has since been corrected and only affected this specific number in the printed news release, with the data appearing correctly in BEA’s Interactive Data Application and Application Programming Interface. This correction ensures the accurate interpretation of U.S. financial flows with the rest of the world.
U.S. Net International Investment Position
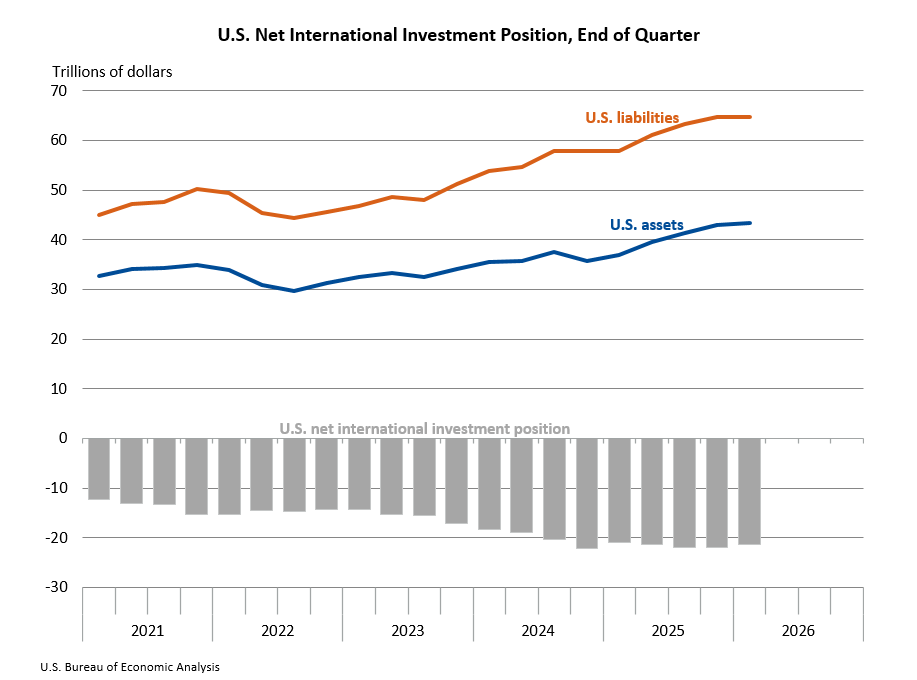
The cumulative impact of these international transactions is reflected in the U.S. net international investment position (NIIP), which measures the difference between U.S. residents’ foreign financial assets and liabilities. At the close of the first quarter of 2026, the U.S. NIIP stood at a deficit of -$21.27 trillion. This represents a slight improvement from the revised -$21.87 trillion at the end of the fourth quarter of 2025.
The total value of U.S. assets held abroad reached $43.37 trillion, while U.S. liabilities to foreign residents, or foreign holdings of U.S. assets, amounted to $64.64 trillion. The improvement in the net position was primarily driven by movements in the value of these assets and liabilities, influenced by both financial transactions and valuation changes such as exchange rate fluctuations and asset price adjustments.
Changes in Assets and Liabilities
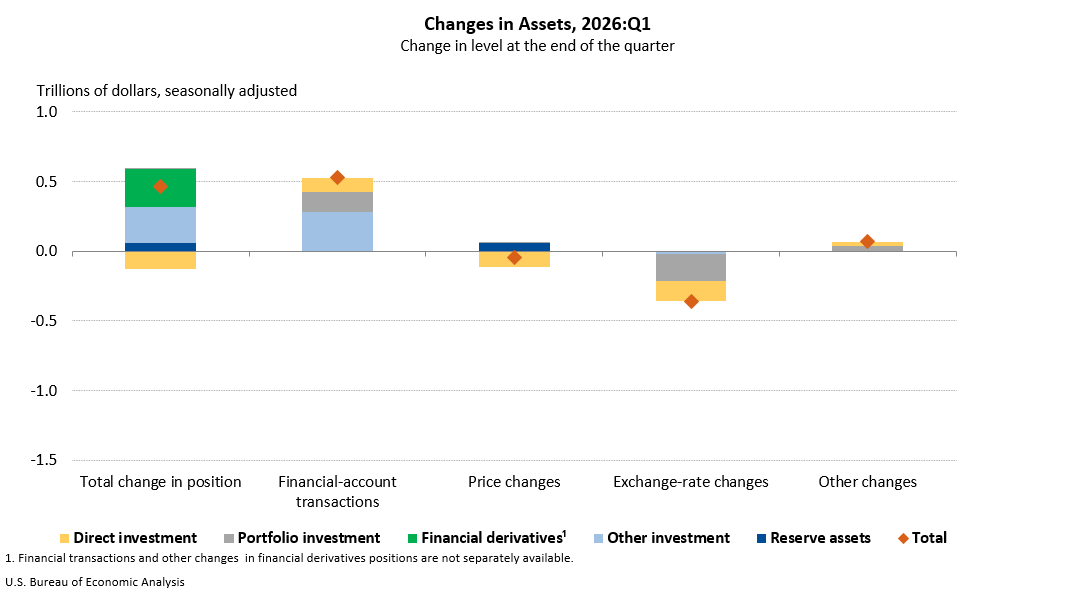
During the first quarter, U.S. assets abroad saw a net increase of $462.9 billion. This rise was broadly distributed across major investment categories, with the exception of direct investment, which may have experienced a decline or slower growth. Financial transactions contributed positively to this increase, but this was significantly offset by exchange-rate changes, which reduced the dollar value of foreign assets held by Americans by $357.1 billion. This highlights the impact of currency fluctuations on the reported value of international investments.
In contrast, U.S. liabilities to foreign residents experienced a net decrease of $140.4 billion during the same period. This reduction was primarily due to a decline in portfolio investment, which includes foreign holdings of U.S. stocks and bonds. While other major investment categories saw increases, the overall decrease in liabilities was a consequence of substantial price changes, leading to a markdown in the value of foreign-held U.S. assets by $1.18 trillion. This decrease was partially offset by the positive financial transactions that added $803.7 billion to U.S. liabilities, as noted earlier.
Annual Updates to International Accounts
The statistics released today also incorporate the annual updates to the U.S. International Transactions Accounts (ITAs) and the International Investment Position (IIP) Accounts. These comprehensive updates, a regular feature of BEA’s economic reporting, involve the incorporation of newly available and revised source data, as well as recalculations of seasonal and trading-day adjustments.
These annual revisions provide a more accurate and complete picture of the U.S. economic relationship with the rest of the world. For instance, the revisions for the fourth quarter of 2025 revealed significant adjustments to previously reported figures. The current-account balance for that quarter was revised from a preliminary estimate of -$190.7 billion to a revised -$221.1 billion. Similarly, the net financial-account transactions for the fourth quarter saw a substantial revision from a preliminary -$135.9 billion to a revised -$248.7 billion.
The table below summarizes key revisions for the fourth quarter of 2025:
| International Transactions Accounts Balances | Preliminary estimates (Billions of dollars, seasonally adjusted) | Revised estimates (Billions of dollars, seasonally adjusted) |
|---|---|---|
| Current-account balance | -190.7 | -221.1 |
| Goods balance | -241.5 | -259.4 |
| Services balance | 81.4 | 82.1 |
| Primary income balance | 23.9 | 3.4 |
| Secondary income balance | -54.6 | -47.2 |
| Net financial-account transactions | -135.9 | -248.7 |
The annual updates also brought significant revisions to the International Investment Position aggregates. The U.S. net international investment position at the end of the fourth quarter of 2025 was revised from a preliminary -$27.54 trillion to a much improved revised -$21.87 trillion. This revision reflects adjustments in both U.S. assets abroad and U.S. liabilities to foreign residents.
The table below shows the revised estimates for the International Investment Position at the end of the fourth quarter of 2025:
| International Investment Position Aggregates | Preliminary estimates (Trillions of dollars, not seasonally adjusted) | Revised estimates (Trillions of dollars, not seasonally adjusted) |
|---|---|---|
| U.S. net international investment position | -27.54 | -21.87 |
| U.S. assets | 42.96 | 42.91 |
| U.S. liabilities | 70.49 | 64.78 |
Enhanced Data Sources and Methodology
These annual updates are underpinned by the incorporation of a wide range of newly available and revised source data from various agencies. Key providers and the periods affected by their data include:
- BEA: Benchmark and quarterly insurance services surveys (2019–2025), quarterly international services surveys (2023–2025), and benchmark, annual, and quarterly direct investment surveys (2022–2025).
- U.S. Census Bureau: Revised source data for Census-basis goods (2023–2025).
- U.S. Department of the Treasury: Annual portfolio investment surveys (2024–2025) and quarterly and monthly portfolio and other investment surveys (2023–2025).
Furthermore, the BEA has updated its disclosure avoidance method to "coarsening," which involves rounding, aggregation, and the use of ranges. This methodological enhancement aims to allow BEA to publish more data while maintaining confidentiality for its survey respondents.
Broader Implications and Future Outlook
The widening current-account deficit in the first quarter of 2026, primarily driven by shifts in primary income, signals ongoing complexities in the U.S. international economic relationships. While the reduction in the goods deficit offers a slight positive, the swing in income balances warrants close observation. A persistent deficit means the U.S. is increasingly reliant on foreign capital to finance its consumption and investment, which can have long-term implications for national debt and economic stability.
The significant revisions in the annual updates, particularly the improvement in the net international investment position for the end of 2025, underscore the dynamic nature of these economic accounts and the importance of BEA’s continuous efforts to refine its data and methodologies. These updates provide a more robust foundation for economic analysis and policy decisions.
The BEA will continue to release updated statistics on U.S. international transactions and investment position quarterly. The next release, covering the second quarter of 2026, is scheduled for September 24, 2026. These ongoing releases will offer further insights into the evolving U.S. economic engagement with the global economy. More detailed analysis of the annual updates is available in the BEA’s Survey of Current Business, with further updates to U.S. International Economic Accounts: Concepts and Methods expected in September 2026.