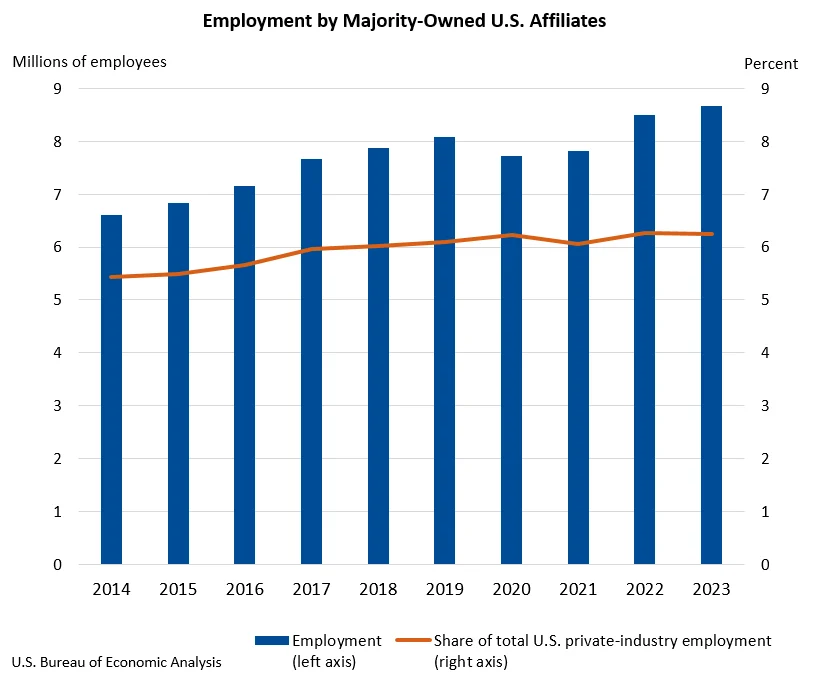
The United States economy experienced a significant boost in 2023 from the operations of majority-owned U.S. affiliates of foreign multinational enterprises (MNEs), with these entities employing a record 8.66 million workers. This figure represents a robust 1.9 percent increase from the 8.5 million workers employed in 2022, according to the latest statistics released by the U.S. Bureau of Economic Analysis (BEA). This sustained growth underscores the critical role foreign direct investment plays in the American labor market and overall economic output. While the absolute number of jobs created by these affiliates reached new heights, their share of total private-industry employment saw a slight decrease, moving from 6.3 percent in 2022 to 6.2 percent in 2023, indicating that the broader U.S. private sector also expanded.
The BEA’s comprehensive report, detailing the activities and financial operations of these U.S. subsidiaries of global corporations, also highlighted substantial increases in their economic contributions. The current-dollar value added by these majority-owned U.S. affiliates, a key metric reflecting their direct contribution to the nation’s Gross Domestic Product (GDP), surged by 6.3 percent to an impressive $1.47 trillion in 2023. This substantial growth in value added signifies not only an expansion of their existing operations but also an increase in the productivity and economic impact generated by these foreign-invested enterprises within the United States.
Further demonstrating a commitment to expanding their U.S. footprint, expenditures on property, plant, and equipment by these affiliates saw a corresponding 6.3 percent rise, reaching $322.7 billion in 2023. This significant investment in physical assets, including factories, offices, and machinery, signals long-term confidence in the U.S. market and contributes to job creation, technological advancement, and infrastructure development across various regions of the country. The BEA’s data also indicated a healthy increase in research and development (R&D) activities, with expenditures growing by 1.1 percent to $87.8 billion. This investment in innovation is crucial for maintaining U.S. competitiveness and fostering advancements in key technological sectors.
A Growing Force in the American Economic Landscape
The statistics released by the BEA provide a detailed snapshot of the profound and multifaceted impact of foreign-owned businesses on the U.S. economy. These majority-owned U.S. affiliates are not merely subsidiaries; they are integral components of the American economic fabric, contributing significantly to employment, innovation, and overall economic output. The steady rise in employment figures, particularly in 2023, is a testament to the continued attractiveness of the U.S. market for foreign direct investment (FDI).
Key Employment Trends:
- 2023: 8.66 million workers employed.
- 2022: 8.50 million workers employed.
- Percentage Increase: 1.9%
While the absolute number of jobs generated by these affiliates is a positive indicator, a nuanced analysis of their share of total private-industry employment reveals a slight dilution from 6.3% in 2022 to 6.2% in 2023. This shift, though marginal, suggests that the overall U.S. private sector experienced robust growth as well, absorbing a slightly larger proportion of the total workforce. Nevertheless, the sheer volume of employment provided by foreign-owned entities remains substantial, underscoring their indispensable role in the national labor market.
Economic Contributions Beyond Employment
The economic influence of these majority-owned U.S. affiliates extends far beyond job creation. Their contributions to the U.S. GDP are substantial and growing, as evidenced by the significant increase in value added. Value added, a measure akin to GDP at the firm or industry level, captures the market value of goods and services produced by these affiliates, after accounting for the cost of intermediate inputs. The 6.3% rise in value added to $1.47 trillion signifies enhanced productivity and expanded economic activity.
Value Added Growth:
- 2023: $1.47 trillion
- Percentage Increase: 6.3%
This increase in value added directly translates into greater contributions to the U.S. economy, supporting economic growth and generating tax revenues. It also reflects the successful integration of these foreign-invested operations into the domestic supply chains and markets.
Investment in the Future: Capital Expenditures and Innovation
The commitment of foreign MNEs to the U.S. economy is further solidified by their substantial investments in capital goods. The BEA reported a 6.3% increase in expenditures for property, plant, and equipment, totaling $322.7 billion in 2023. This investment is crucial for several reasons:
- Job Creation: Construction and expansion projects associated with new or upgraded facilities directly create jobs.
- Productivity Gains: Investments in modern machinery and technology enhance operational efficiency and output.
- Infrastructure Development: Enhanced facilities contribute to the nation’s overall industrial and commercial infrastructure.
- Long-Term Commitment: Significant capital outlays signal a strong, long-term commitment to operating and growing within the United States.
Furthermore, the reported 1.1% increase in research and development (R&D) performed by these affiliates, reaching $87.8 billion, is a vital indicator of their role in driving innovation. This investment in R&D is instrumental in developing new technologies, products, and processes, which can have spillover effects across the U.S. economy, fostering a more competitive and technologically advanced landscape.
Expenditures on Property, Plant, and Equipment:
- 2023: $322.7 billion
- Percentage Increase: 6.3%
Research and Development Expenditures:
- 2023: $87.8 billion
- Percentage Increase: 1.1%
Historical Context and Trend Analysis
The statistics released today build upon a long-standing trend of foreign direct investment in the United States. Historically, the U.S. has been a prime destination for FDI due to its stable political environment, large consumer market, skilled workforce, and robust legal framework. The BEA’s data collection on the activities of U.S. affiliates of foreign MNEs began decades ago, providing valuable insights into the evolving nature and impact of global investment.
The period following World War II saw a gradual increase in FDI as global trade and investment barriers began to fall. The 1980s and 1990s witnessed a significant acceleration, driven by globalization and the liberalization of investment policies in many countries, including the U.S. The early 21st century has seen continued strong inflows, although the patterns and sectors of investment have evolved, influenced by technological advancements, shifts in global economic power, and evolving geopolitical considerations.
The current data for 2023 reflects a continuation of this upward trajectory in employment and investment, even amidst global economic uncertainties. This resilience suggests that the fundamental drivers of FDI into the U.S. remain strong. The BEA’s ongoing revisions to historical data, such as the updated figures for 2022, are crucial for accurately assessing these trends and understanding the dynamics of foreign investment over time.
Revisions to 2022 Data: Enhancing Accuracy
The BEA also provided updated statistics for 2022, incorporating newly available and revised source data. These revisions are a standard part of the statistical process, ensuring the highest degree of accuracy in economic reporting. The preliminary estimates for 2022, released in November 2024 and highlighted in the December 2024 issue of the Survey of Current Business, have been refined.
Key Revisions for 2022 Data (Billions of dollars, except as noted):
| Metric | Preliminary Estimate | Revised Estimate |
|---|---|---|
| Number of employees (thousands) | 8,351.0 | 8,503.1 |
| Value added | 1,350.1 | 1,382.1 |
| Expenditures for property, plant, and equipment | 299.1 | 303.5 |
| Research and development expenditures | 80.3 | 86.8 |
These revisions demonstrate the BEA’s commitment to providing the most accurate economic intelligence. The upward adjustments in employment, value added, and capital expenditures for 2022 provide a more complete picture of the economic contributions made by foreign-owned affiliates in that year, reinforcing the positive trends observed in the 2023 data.
Broader Implications and Analysis
The sustained growth in employment and investment by majority-owned U.S. affiliates of foreign MNEs carries significant implications for the U.S. economy.
Economic Stability and Growth: These companies act as a stabilizing force, providing consistent employment and contributing to GDP even during periods of domestic economic slowdown. Their global reach and diversified operations can insulate them, to some extent, from localized economic downturns.
Technological Transfer and Innovation: The R&D investments not only benefit the individual companies but also contribute to the broader U.S. innovation ecosystem. Knowledge spillovers, adoption of new technologies, and training of a skilled workforce can enhance the overall technological capacity of the nation.
Regional Development: Investments in property, plant, and equipment often occur in various regions across the U.S., supporting economic development in communities that might not otherwise attract such large-scale investments. This can lead to job creation, infrastructure improvements, and increased local tax revenues.
Trade and Global Integration: These affiliates are key players in international trade, both importing and exporting goods and services. Their activities facilitate U.S. integration into global supply chains and contribute to the balance of trade.
Potential Concerns and Future Outlook:
While the overall picture is positive, it is important to consider potential nuances. The slight decrease in the percentage share of private-industry employment, as noted earlier, could be a point of monitoring. It might suggest that domestic companies are also experiencing strong growth, or it could indicate shifts in the composition of the U.S. workforce.
Furthermore, the nature of foreign investment can vary. While many foreign MNEs are deeply integrated into the U.S. economy, contributing significantly to innovation and local communities, there are always discussions about the long-term strategic interests of foreign investors versus domestic economic development goals. However, the BEA’s data focuses on the measurable economic impact, which in this case is overwhelmingly positive.
Looking ahead, the BEA’s release schedule indicates that statistics for 2024 will be released on July 10, 2026. This allows for a consistent and predictable flow of information, enabling policymakers, businesses, and researchers to track these critical economic trends.
Data Accessibility and Discontinuation of Tables
The BEA emphasizes that comprehensive data tables, including detailed breakdowns by industry, country of origin, and state-level information, are available on its website. This commitment to data transparency allows for in-depth analysis by a wide range of stakeholders.
It is important to note that the BEA is also undergoing changes in its data dissemination. As of December 5, 2025, some data tables previously produced alongside these news releases have been discontinued. This includes certain statistics related to U.S. affiliates with 50 percent or less foreign ownership and supplemental industry statistics. These changes are aimed at streamlining data production and focusing resources on the most impactful datasets. Interested parties are encouraged to consult the BEA’s Interactive Data Application and comprehensive data tables for the most current and relevant information.
The ongoing reporting and analysis of the activities of U.S. affiliates of foreign multinational enterprises by the Bureau of Economic Analysis remain a vital resource for understanding the dynamic and essential role these global businesses play in shaping the American economic landscape. The 2023 data paints a picture of continued growth, significant investment, and a strong commitment to the U.S. workforce and economy.