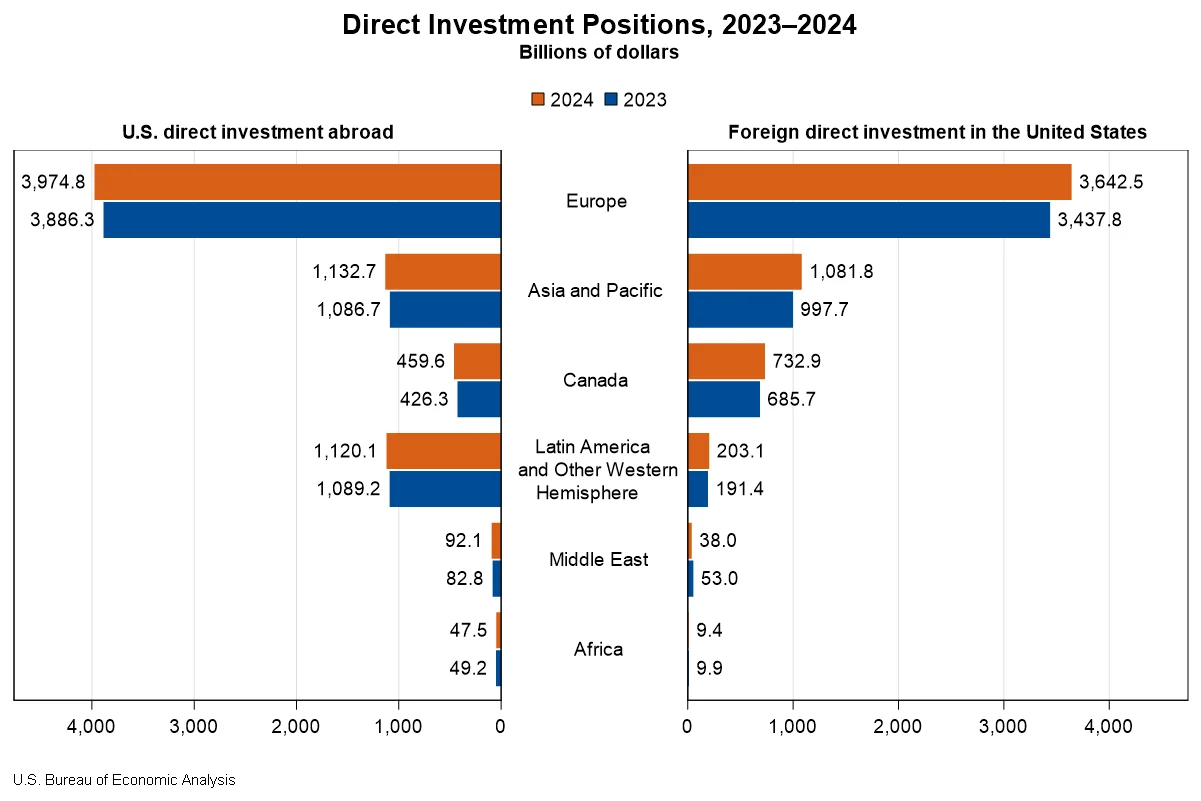
The cumulative level of U.S. direct investment abroad reached $6.83 trillion at the close of 2024, marking an increase of $206.3 billion from the previous year, according to recently released statistics from the U.S. Bureau of Economic Analysis (BEA). This expansion was primarily driven by a substantial $88.4 billion rise in investment within Europe, with Luxembourg and Germany emerging as key destinations. On the other side of the ledger, foreign direct investment in the United States also experienced robust growth, climbing by $332.1 billion to a total of $5.71 trillion. Europe was again the leading source of this investment, contributing $204.7 billion, with notable increases from the United Kingdom and Germany.
These figures underscore a dynamic and increasingly interconnected global economic landscape, reflecting ongoing trends in capital flows and international business expansion. The BEA’s comprehensive data provides a granular view of where and how multinational enterprises are allocating their resources across borders, offering critical insights for policymakers, investors, and industry analysts.
U.S. Direct Investment Abroad: A Deep Dive into Global Expansion
U.S. multinational enterprises (MNEs) maintain a widespread global presence, with investments in virtually every nation. However, a significant portion of the total U.S. direct investment abroad position is concentrated in a handful of key economies. At the end of 2024, the United Kingdom held the largest share of this investment, with a substantial $1,024.6 billion. This was closely followed by the Netherlands, which accounted for $1,012.0 billion, and Luxembourg with $569.6 billion. Singapore and Ireland rounded out the top five, with positions of $467.6 billion and $466.8 billion, respectively. These countries often serve as strategic hubs for European operations, financial services, or as gateways to larger regional markets.
By industry, holding companies represented the largest segment of U.S. direct investment abroad, capturing 47.3 percent of the total position in 2024. This indicates a strategic use of holding structures for managing international assets and subsidiaries. Manufacturing affiliates ranked second, accounting for 16.0 percent of the investment, with a notable surge in the manufacturing of computers and electronic products. Finance and insurance affiliates followed, representing 14.2 percent of the U.S. investment abroad. When examining the investment by the industry of the U.S. parent company, manufacturing MNEs were the most active investors, contributing 50.9 percent of the total position. MNEs in the finance and insurance sectors were the second-largest contributors, at 15.1 percent.
The income generated from these overseas investments reflects the health and profitability of U.S. MNEs’ foreign operations. In 2024, U.S. MNEs earned $601.9 billion on their cumulative direct investment abroad, a 3.8 percent increase from the previous year. The finance and insurance sector saw the most significant income growth, with an increase of $12.0 billion, or a remarkable 17.6 percent rise from 2023. This surge highlights the strong performance and growing importance of financial services in the international investment landscape.
Foreign Direct Investment in the United States: A Magnet for Global Capital
The United States continues to be a prime destination for foreign capital, attracting significant direct investment from MNEs worldwide. At the close of 2024, the total foreign direct investment position in the U.S. stood at $5.71 trillion, an increase of $332.1 billion. This growth was substantially influenced by a $204.7 billion increase in investment originating from Europe. Key European contributors included the United Kingdom, with an additional $52.9 billion invested, and Germany, which saw an increase of $39.7 billion.
When analyzed by the country of the foreign parent, Japan remained the leading investor in the U.S. market, with a position of $754.1 billion at the end of 2024. The United Kingdom followed closely with $742.7 billion, then Canada with $732.9 billion, and the Netherlands with $726.4 billion. These four countries collectively accounted for over half of the total foreign direct investment in the United States.
A more nuanced perspective emerges when considering the country of the ultimate beneficial owner (UBO). Under this classification, which traces investment to the entity at the top of the global ownership chain, Japan again led with $819.2 billion, followed by Canada at $811.7 billion, and Germany at $677.3 billion. The data also revealed a significant difference between investment reported by the country of the foreign parent and the country of the UBO for countries like the Netherlands and Luxembourg. This suggests that a considerable portion of investment originating from these European financial centers is ultimately owned by investors based in other nations, indicating their role as intermediaries in global capital flows.
The U.S. manufacturing sector was a primary recipient of foreign direct investment, accounting for 42.3 percent of the total position. Within manufacturing, chemical manufacturing alone attracted $827.5 billion, representing a third of the total manufacturing investment. This substantial investment underscores the global competitiveness and strategic importance of U.S. chemical production. The finance and insurance sector also attracted significant foreign capital, with $599.4 billion invested, followed by wholesale trade, which received $520.5 billion.
The income generated by foreign MNEs from their investments in the U.S. demonstrated strong performance. In 2024, foreign MNEs earned $310.9 billion on their cumulative investments in the United States, a notable 13.1 percent increase compared to 2023. This robust income growth signals a favorable and profitable environment for foreign businesses operating within the U.S. economy.
Revisiting Historical Data: A Picture of Stability and Growth
The BEA also released revisions to previously published statistics for 2022 and 2023. These revisions, which incorporate newly available and updated source data, provide a more accurate historical context for the current year’s figures. For instance, the U.S. direct investment abroad position for 2022 was revised from $6,313 billion to $6,245 billion, and for 2023, from $6,676 billion to $6,620 billion. Similarly, foreign direct investment in the U.S. for 2022 was adjusted from $5,167 billion to $5,124 billion, and for 2023, from $5,394 billion to $5,376 billion. These adjustments, while relatively minor in percentage terms, are crucial for maintaining the integrity and precision of economic reporting.
Implications and Broader Economic Context
The trends highlighted in the BEA’s latest release point to several key economic dynamics. The continued strength of both outward U.S. investment and inward foreign investment suggests a global economy that, despite various geopolitical and economic uncertainties, remains open to cross-border capital flows. This is often interpreted as a vote of confidence in the stability and growth prospects of the U.S. economy, as well as a strategic imperative for U.S. companies to expand their global reach and market share.
The significant investment in U.S. manufacturing, particularly in the chemical sector, could indicate a reshoring or nearshoring trend, or simply a recognition of the sector’s enduring global importance and technological advancements. The dominance of holding companies in outbound U.S. investment further illustrates the sophisticated financial strategies employed by multinational corporations to optimize their global operations and tax structures.
The BEA’s detailed breakdowns by country and industry are invaluable for understanding the intricate web of global commerce. For policymakers, this data informs decisions on trade, investment, and regulatory frameworks. For businesses, it provides essential market intelligence for strategic planning, mergers and acquisitions, and operational expansion.
Future Outlook and Data Accessibility
The BEA’s commitment to providing detailed and timely data on direct investment is crucial for economic transparency and analysis. The agency continues to refine its data collection and reporting methodologies to ensure accuracy and relevance. With the release of the 2025 direct investment statistics scheduled for July 2026, the 2024 data will be archived, allowing for long-term historical analysis.
The discontinuation of certain detailed tables, while noted, is a reflection of evolving data dissemination practices, with the BEA directing users to its comprehensive Interactive Data Application and other online resources for access to archived information. This shift aims to streamline data delivery and enhance user accessibility to a broader range of statistical products. The continued availability of data on the U.S. direct investment abroad and foreign direct investment in the United States positions, broken down by country, industry, and even by ultimate beneficial owner, offers an unparalleled resource for researchers and market participants seeking to understand the complex currents of global economic integration.