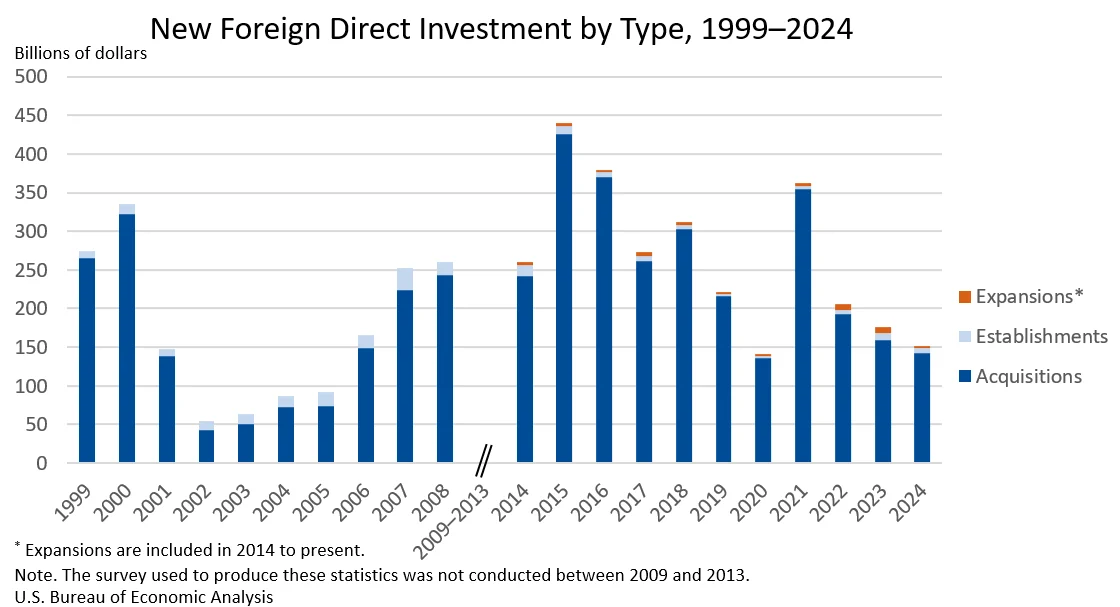
Expenditures by foreign direct investors to acquire, establish, or expand U.S. businesses totaled $151.0 billion in 2024, according to preliminary statistics released today by the U.S. Bureau of Economic Analysis (BEA). This figure represents a significant decrease of $24.9 billion, or 14.2 percent, from the revised $176.0 billion recorded in 2023. The 2024 total also falls considerably below the annual average of $277.2 billion observed between 2014 and 2023, signaling a notable contraction in inbound foreign investment activity. Acquisitions of existing U.S. businesses continued to be the dominant form of foreign direct investment (FDI), accounting for the majority of the expenditures.
The BEA data reveals that within the $151.0 billion in 2024 expenditures, acquisitions of existing U.S. businesses represented $143.0 billion. The establishment of new U.S. businesses attracted $6.3 billion, while the expansion of existing foreign-owned businesses accounted for a smaller $1.8 billion. The overall picture of planned expenditures, which encompasses both first-year outlays and projected future investments, stood at $157.0 billion for the year. This metric offers a forward-looking perspective on foreign investor commitment to the U.S. economy.
The impact of this investment on the U.S. labor market is also quantified by the BEA’s findings. In 2024, newly acquired, established, or expanded foreign-owned businesses in the United States provided employment for an estimated 204,200 individuals. This figure underscores the critical role of FDI in job creation and economic growth across various sectors.
A Detailed Look at Investment Trends
Sectoral Distribution of Investment
Analyzing the investment by industry provides a granular view of where foreign capital is being deployed. The manufacturing sector emerged as the largest recipient of new direct investment in 2024, attracting $67.7 billion, which constitutes a substantial 44.9 percent of the total expenditures. Within this broad sector, chemical manufacturing proved to be particularly attractive, drawing $23.7 billion in investments. Beyond manufacturing, the finance and insurance sector also saw significant inflows, with expenditures reaching $23.2 billion. The utilities sector followed, garnering $16.0 billion in foreign investment. These figures highlight the continued appeal of U.S. industrial and financial infrastructure to global investors.
Geographic Origins of Investment
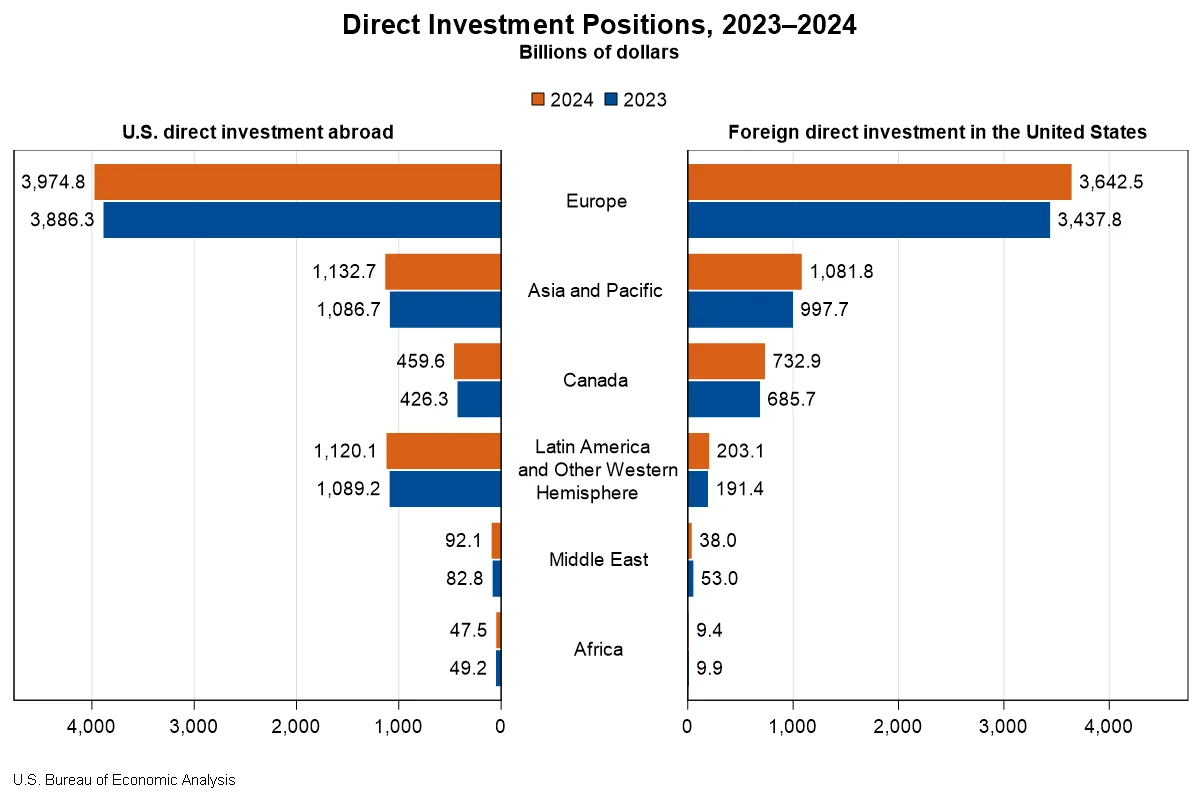
The origin of foreign investment offers insights into global economic relationships and investor confidence. In 2024, Ireland stood out as the country with the largest investment in the U.S., contributing $30.1 billion. Canada followed closely, with $23.9 billion in expenditures. On a regional basis, Europe was the most significant source of new FDI, accounting for $96.7 billion, or an impressive 64.0 percent of all new investment. The Asia and Pacific region represented the second-largest investing bloc, with expenditures totaling $23.2 billion. This regional concentration suggests strong transatlantic investment ties and a robust flow of capital from European economies into the U.S. market.
State-Level Investment Patterns
At the state level, Texas led the nation in attracting FDI in 2024, with investment expenditures reaching $22.8 billion. Georgia also experienced substantial foreign investment, with $16.3 billion, followed by California, which secured $12.9 billion. These leading states often benefit from a combination of strategic location, skilled labor forces, and favorable business environments, making them prime destinations for international capital.
Greenfield Investments: Building from the Ground Up
Greenfield investments, which involve establishing new businesses or expanding existing ones, represent a direct commitment to long-term growth and operational presence in the U.S. In 2024, greenfield expenditures amounted to $8.1 billion. This category is further broken down by sector, with professional, scientific, and technical services leading the way, attracting $2.8 billion in greenfield investments. Management, scientific, and technical consulting services specifically accounted for $1.6 billion of this total.
Regionally, Europe again demonstrated its significant role in greenfield investments, contributing $3.8 billion. Latin America and the Other Western Hemisphere region followed with $1.4 billion, and the Asia and Pacific region with $1.2 billion. At the state level, Wyoming attracted the highest level of greenfield investment, with $2.0 billion, and New Mexico followed with $1.4 billion. Planned total expenditures for greenfield investments initiated in 2024, including future commitments, reached $14.1 billion, indicating a pipeline of future growth.
Employment Dynamics in Foreign-Owned Enterprises
The BEA’s data also sheds light on the employment landscape shaped by FDI. In 2024, the current employment within newly acquired foreign-owned enterprises stood at 203,600. When considering the planned employment for newly established businesses and expansions, the total projected workforce reached 213,200.
Employment by Sector and Country
The manufacturing sector was the largest employer among acquired enterprises, accounting for 73,600 jobs. By country of origin, Ireland and Canada were the leading sources of employment through their U.S. investments, with 43,100 and 37,500 employees, respectively. These figures highlight the substantial contribution of these nations to the U.S. job market via FDI.
State-Level Employment Impact
At the state level, Florida saw the largest number of current employees resulting from new FDI, with 32,700 individuals. Texas followed with 18,200 employees, and New York with 14,200. This distribution of employment reflects the broader patterns of investment, with states attracting significant capital also becoming major job creators through foreign-owned entities.
Revisions and Historical Context
The BEA’s release also included significant revisions to the 2023 data, illustrating the dynamic nature of economic reporting. Previously published first-year expenditures for 2023 were $148.8 billion, which have now been revised to $176.0 billion. This upward revision indicates a stronger FDI performance in 2023 than initially assessed, driven by increased spending on acquisitions ($158.7 billion from $136.5 billion), new establishments ($9.0 billion from $7.4 billion), and expansions ($8.3 billion from $5.0 billion).
Similarly, planned total expenditures for 2023 were revised from $175.9 billion to $218.8 billion, reflecting a more optimistic outlook for future investments in that year. These revisions underscore the importance of ongoing data collection and refinement in understanding economic trends.
The historical context provided by the BEA’s ten-year average (2014-2023) of $277.2 billion highlights that the 2024 figures, while representing a decline from 2023, are part of a broader trend that has seen significant fluctuations. The period from 2014 to 2019, for instance, often saw robust FDI inflows, driven by economic recovery and global market opportunities. However, the subsequent years have been influenced by various factors, including geopolitical shifts, trade policy adjustments, and the global pandemic, leading to more volatile investment patterns. The current decline in 2024, therefore, warrants careful observation in the context of these broader economic forces.
Analysis of Implications and Future Outlook
The decrease in foreign direct investment in 2024, particularly the substantial drop from the previous year, could have several implications for the U.S. economy. A slowdown in FDI might translate to slower job creation in sectors reliant on foreign capital, reduced technology transfer, and potentially less competition in certain industries, which could affect consumer prices and innovation. The strong performance of the manufacturing and finance sectors suggests that these areas remain resilient, but the overall decline indicates a need to understand the underlying causes.
Potential contributing factors to this decline could include a more uncertain global economic outlook, rising interest rates making capital more expensive, increased regulatory scrutiny in some areas, or a shift in investment strategies by foreign entities prioritizing other markets. The BEA’s data on planned expenditures, while lower than the revised 2023 figures, suggests that foreign investors still see value in the U.S. market, albeit with a more cautious approach.
The BEA’s detailed data tables, available through its Interactive Data Application and Supplemental Data Tables, provide a crucial resource for policymakers, businesses, and researchers seeking to understand these trends. The discontinuation of certain older data tables, while noted, is a standard practice as statistical agencies evolve their reporting methods to better serve current analytical needs.
As the U.S. economy navigates these evolving global investment dynamics, continued monitoring of FDI trends will be essential. The next release of data in July 2026, covering 2025, will provide further clarity on whether the 2024 decline represents a temporary setback or the beginning of a more sustained shift in foreign investment patterns. The interplay of domestic economic policies, global stability, and the attractiveness of the U.S. market will undoubtedly shape the future trajectory of foreign direct investment.
1 As measured by country of ultimate beneficial owner (UBO; see “Additional Information” for a description).