
 Lana Rhoades
The U.S. Bureau of Economic Analysis (BEA) has unveiled its latest comprehensive report detailing the economic significance of the nation’s outdoor recreation sector. For 2024, the outdoor recreation economy added a substantial $696.7 billion to the current-dollar Gross Domestic Product (GDP), representing a significant 2.4 percent of the total U.S. economic output. This figure underscores the enduring and growing importance of outdoor activities, from hiking and boating to gardening and attending outdoor concerts, as a powerful engine for national prosperity. The newly released data also provide granular insights into the performance of this sector across all 50 states and the District of Columbia, revealing a diverse economic landscape shaped by varying geographic, demographic, and industry-specific factors.
National Economic Performance and Trends
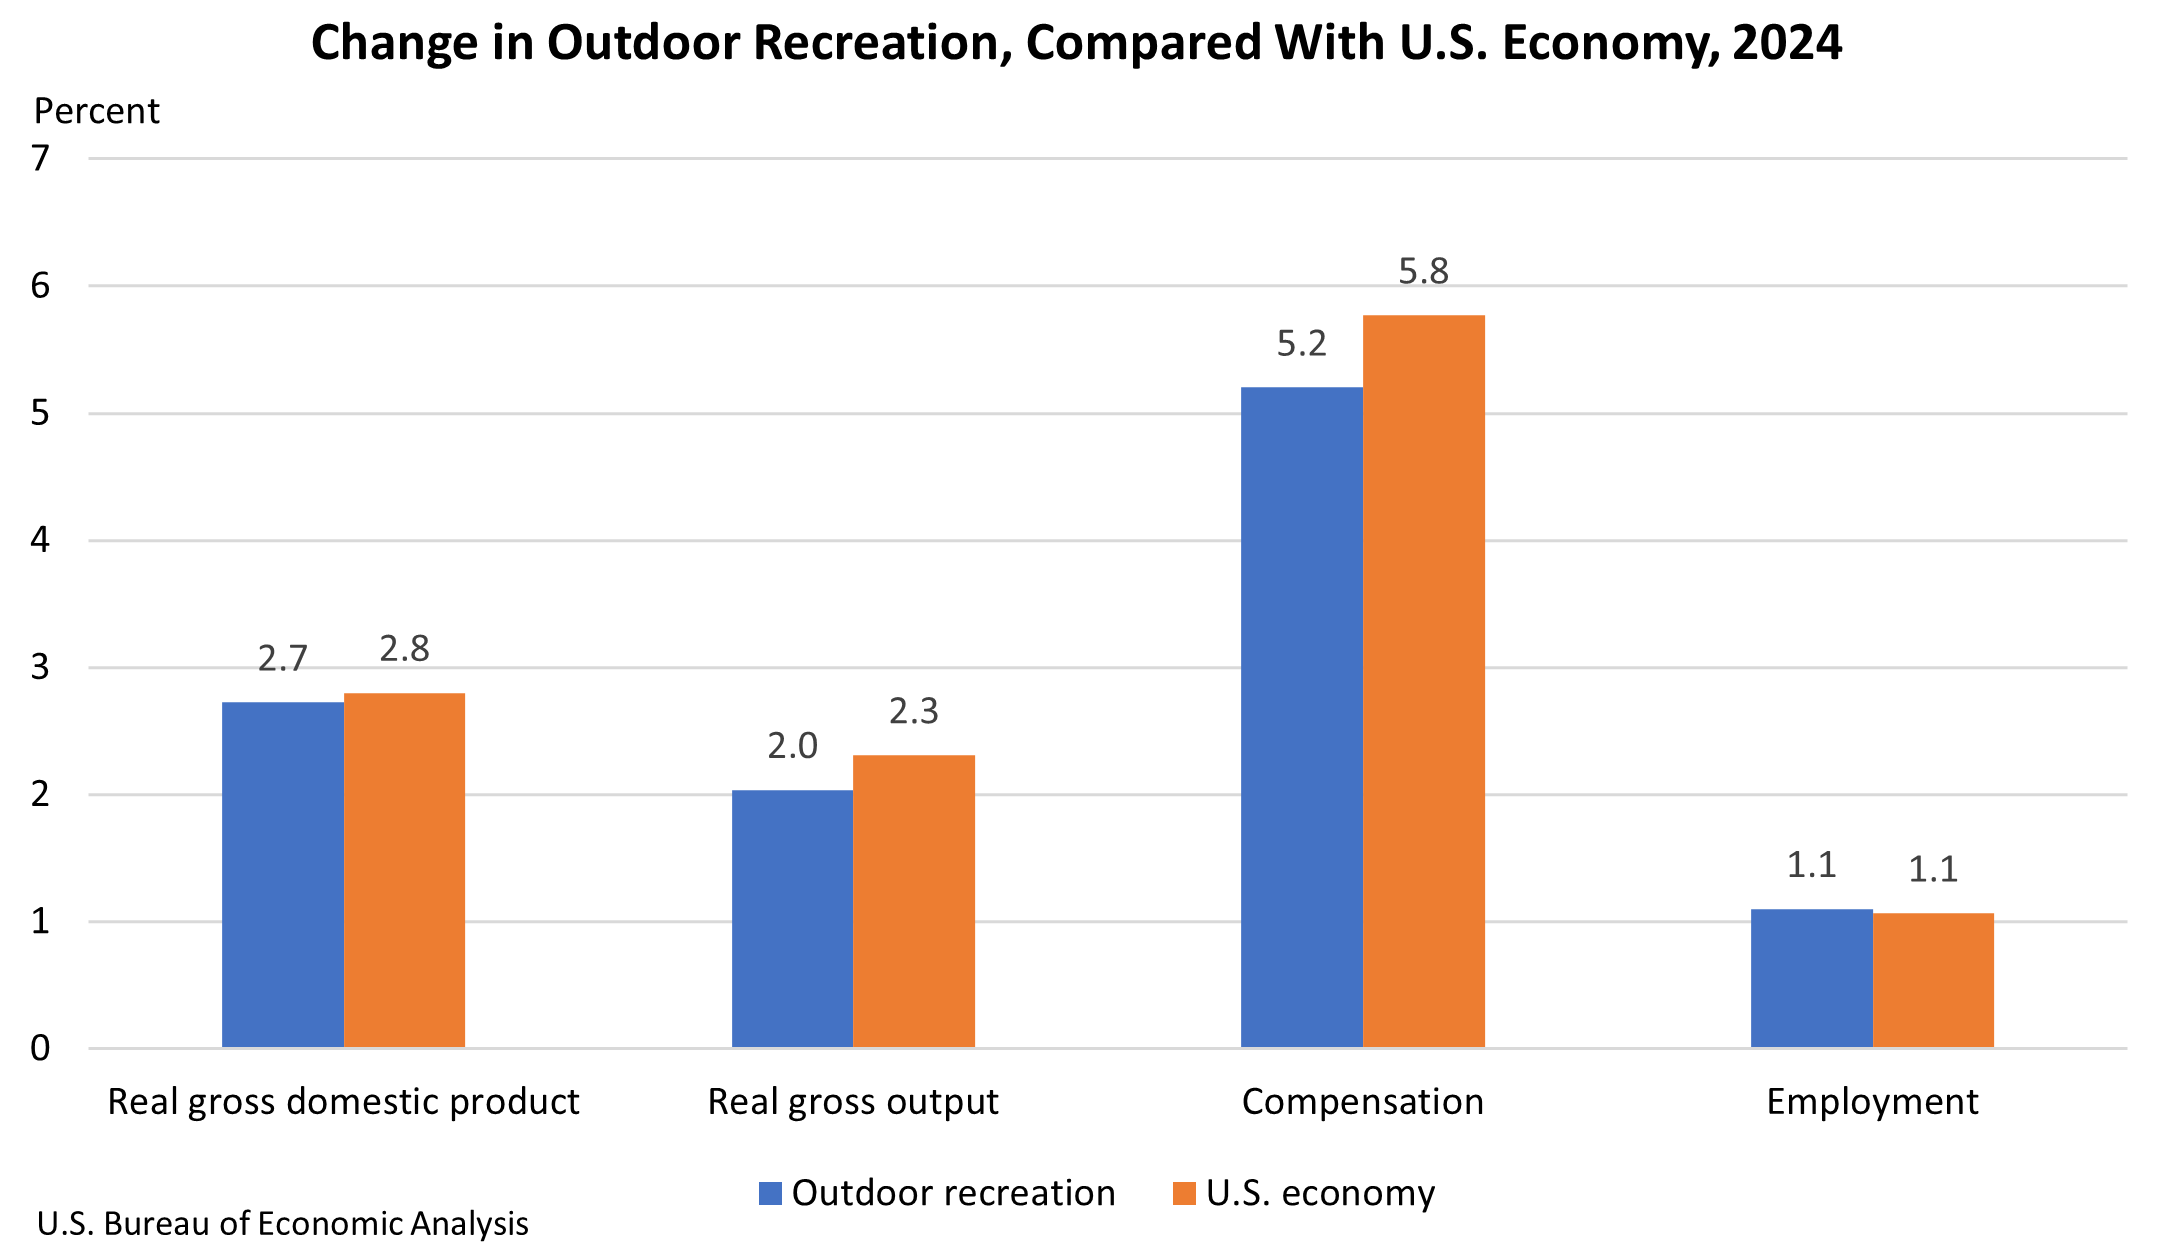
On a national level, the outdoor recreation economy demonstrated resilience and continued expansion in 2024. Inflation-adjusted ("real") GDP for the sector experienced a 2.7 percent increase. While this growth rate is slightly lower than the overall U.S. economy’s 2.8 percent expansion in the same year, it still signifies a robust upward trajectory. This moderation in growth is a notable shift from the exceptionally strong rebound observed in 2023, when the outdoor recreation sector saw a remarkable 5.3 percent increase, reflecting a post-pandemic surge in demand for outdoor experiences.
The BEA’s analysis further indicates that real gross output for the outdoor recreation economy rose by 2.0 percent in 2024. Compensation for workers in this sector saw a more substantial increase of 5.2 percent, suggesting a healthy rise in wages and earnings for those employed in outdoor recreation-related industries. Employment within the sector also grew, with a 1.1 percent increase in jobs nationwide. This growth in employment, though modest, points to the sector’s capacity to absorb labor and contribute to overall job creation.
The BEA’s annual update process, which incorporates the latest source data and economic accounting methodologies, ensures that these statistics are as accurate and comprehensive as possible. The 2024 data reflect updates to national economic accounts for the period 2020-2023, as well as newly available and revised source data. This rigorous updating process provides policymakers, businesses, and researchers with the most current and reliable information to understand and leverage the economic power of outdoor recreation.
State-Level Economic Contributions
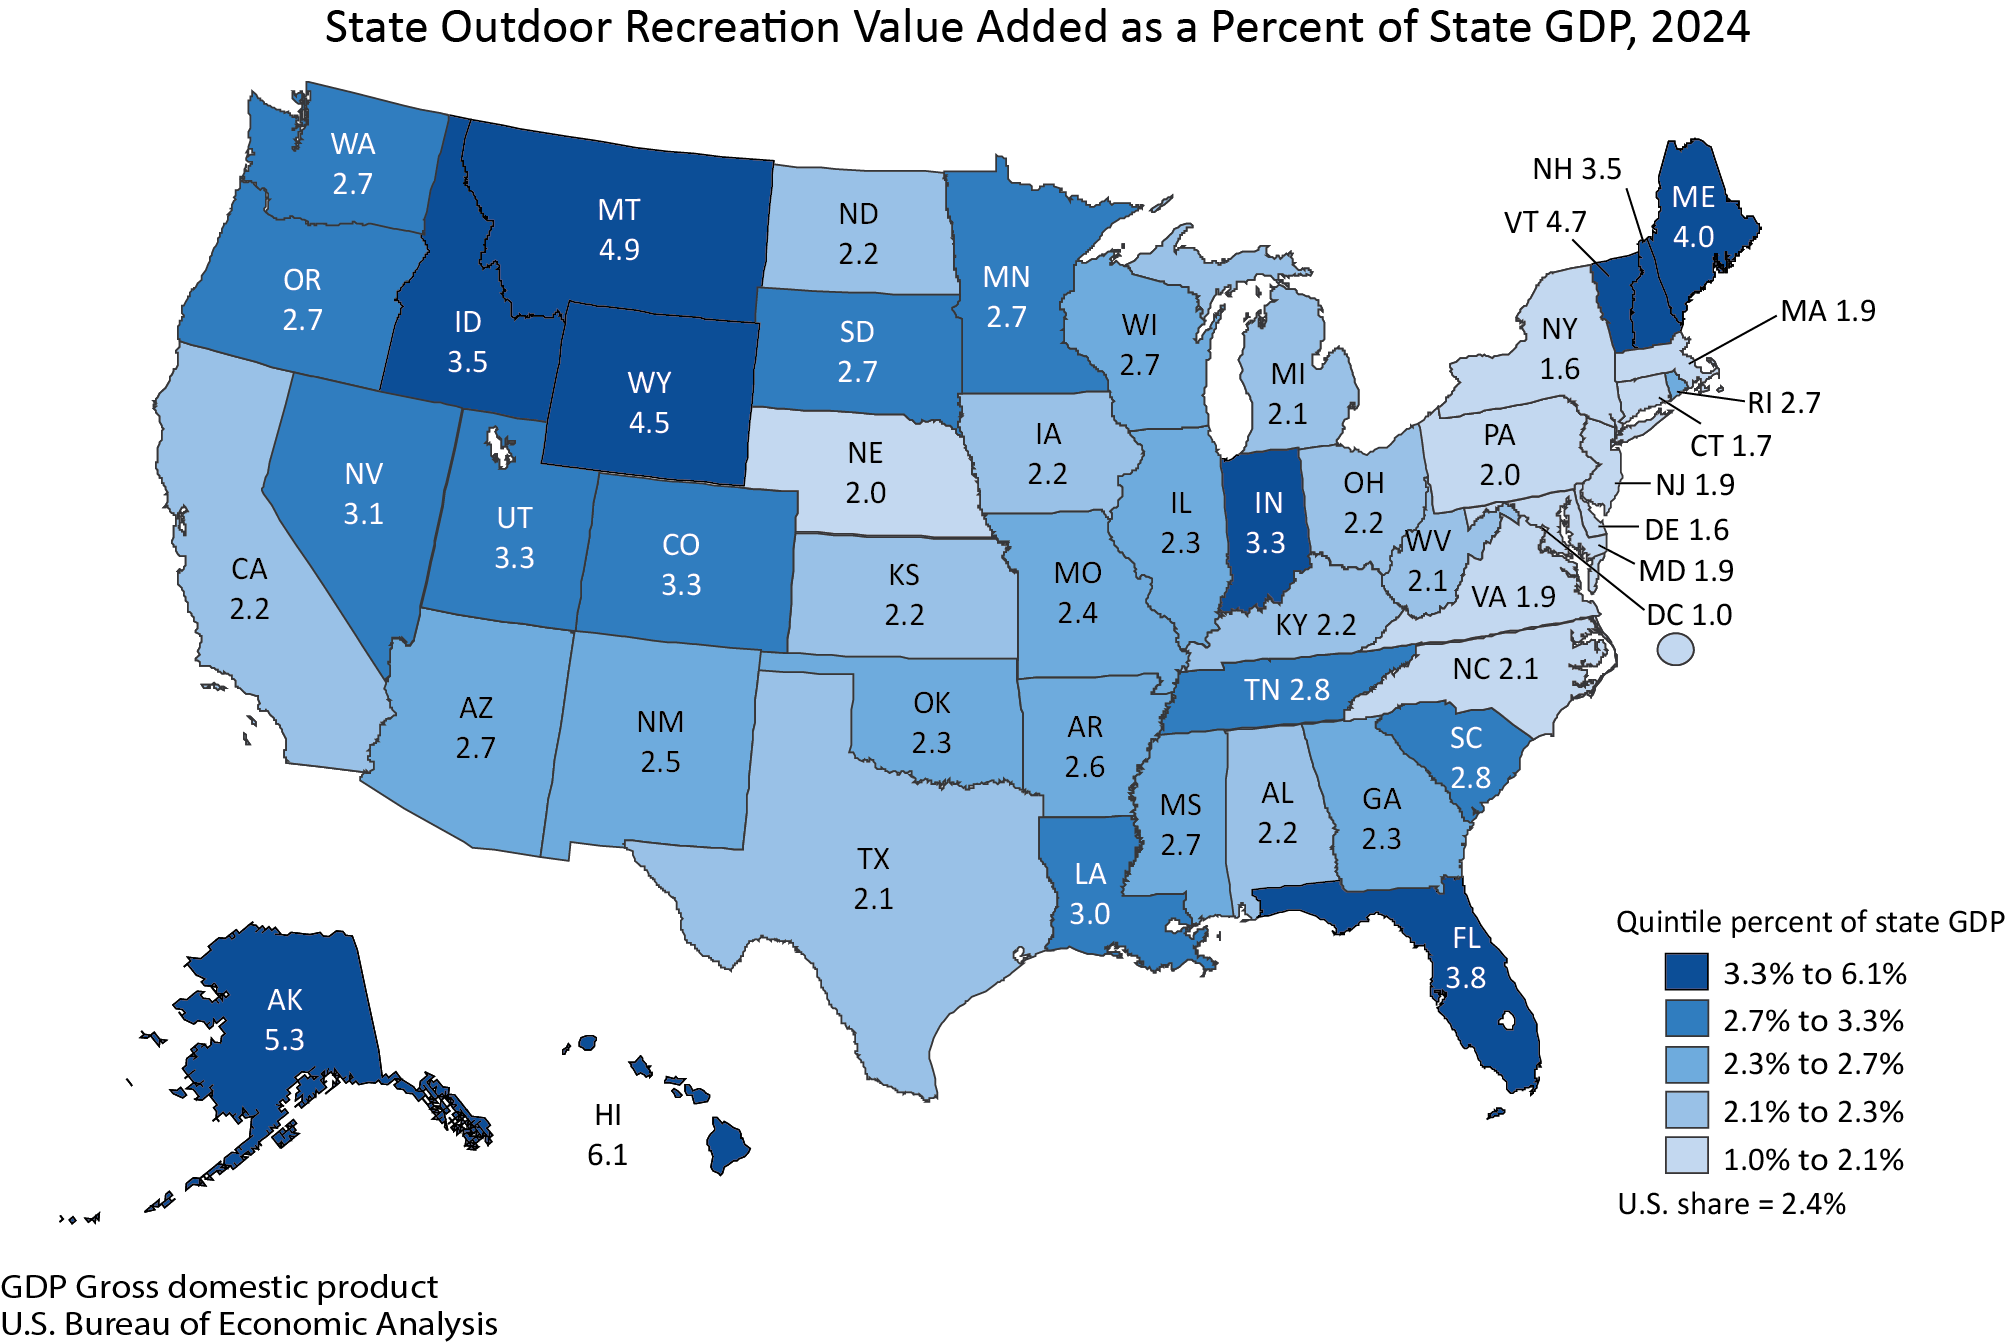
The impact of outdoor recreation varies significantly across the United States, as evidenced by the state-level data. Hawaii emerged as the state where outdoor recreation constitutes the largest share of its state GDP, accounting for an impressive 6.1 percent. This high proportion is likely driven by the state’s unique natural beauty, its robust tourism industry heavily reliant on outdoor activities such as surfing, hiking, and exploring volcanic landscapes, and a strong local culture that embraces outdoor pursuits.
In contrast, the District of Columbia recorded the lowest share of its GDP attributable to outdoor recreation, at 1.0 percent. This is understandable given its primary function as a center for government and national institutions, with a different economic base than states heavily reliant on tourism or natural resource-based industries.
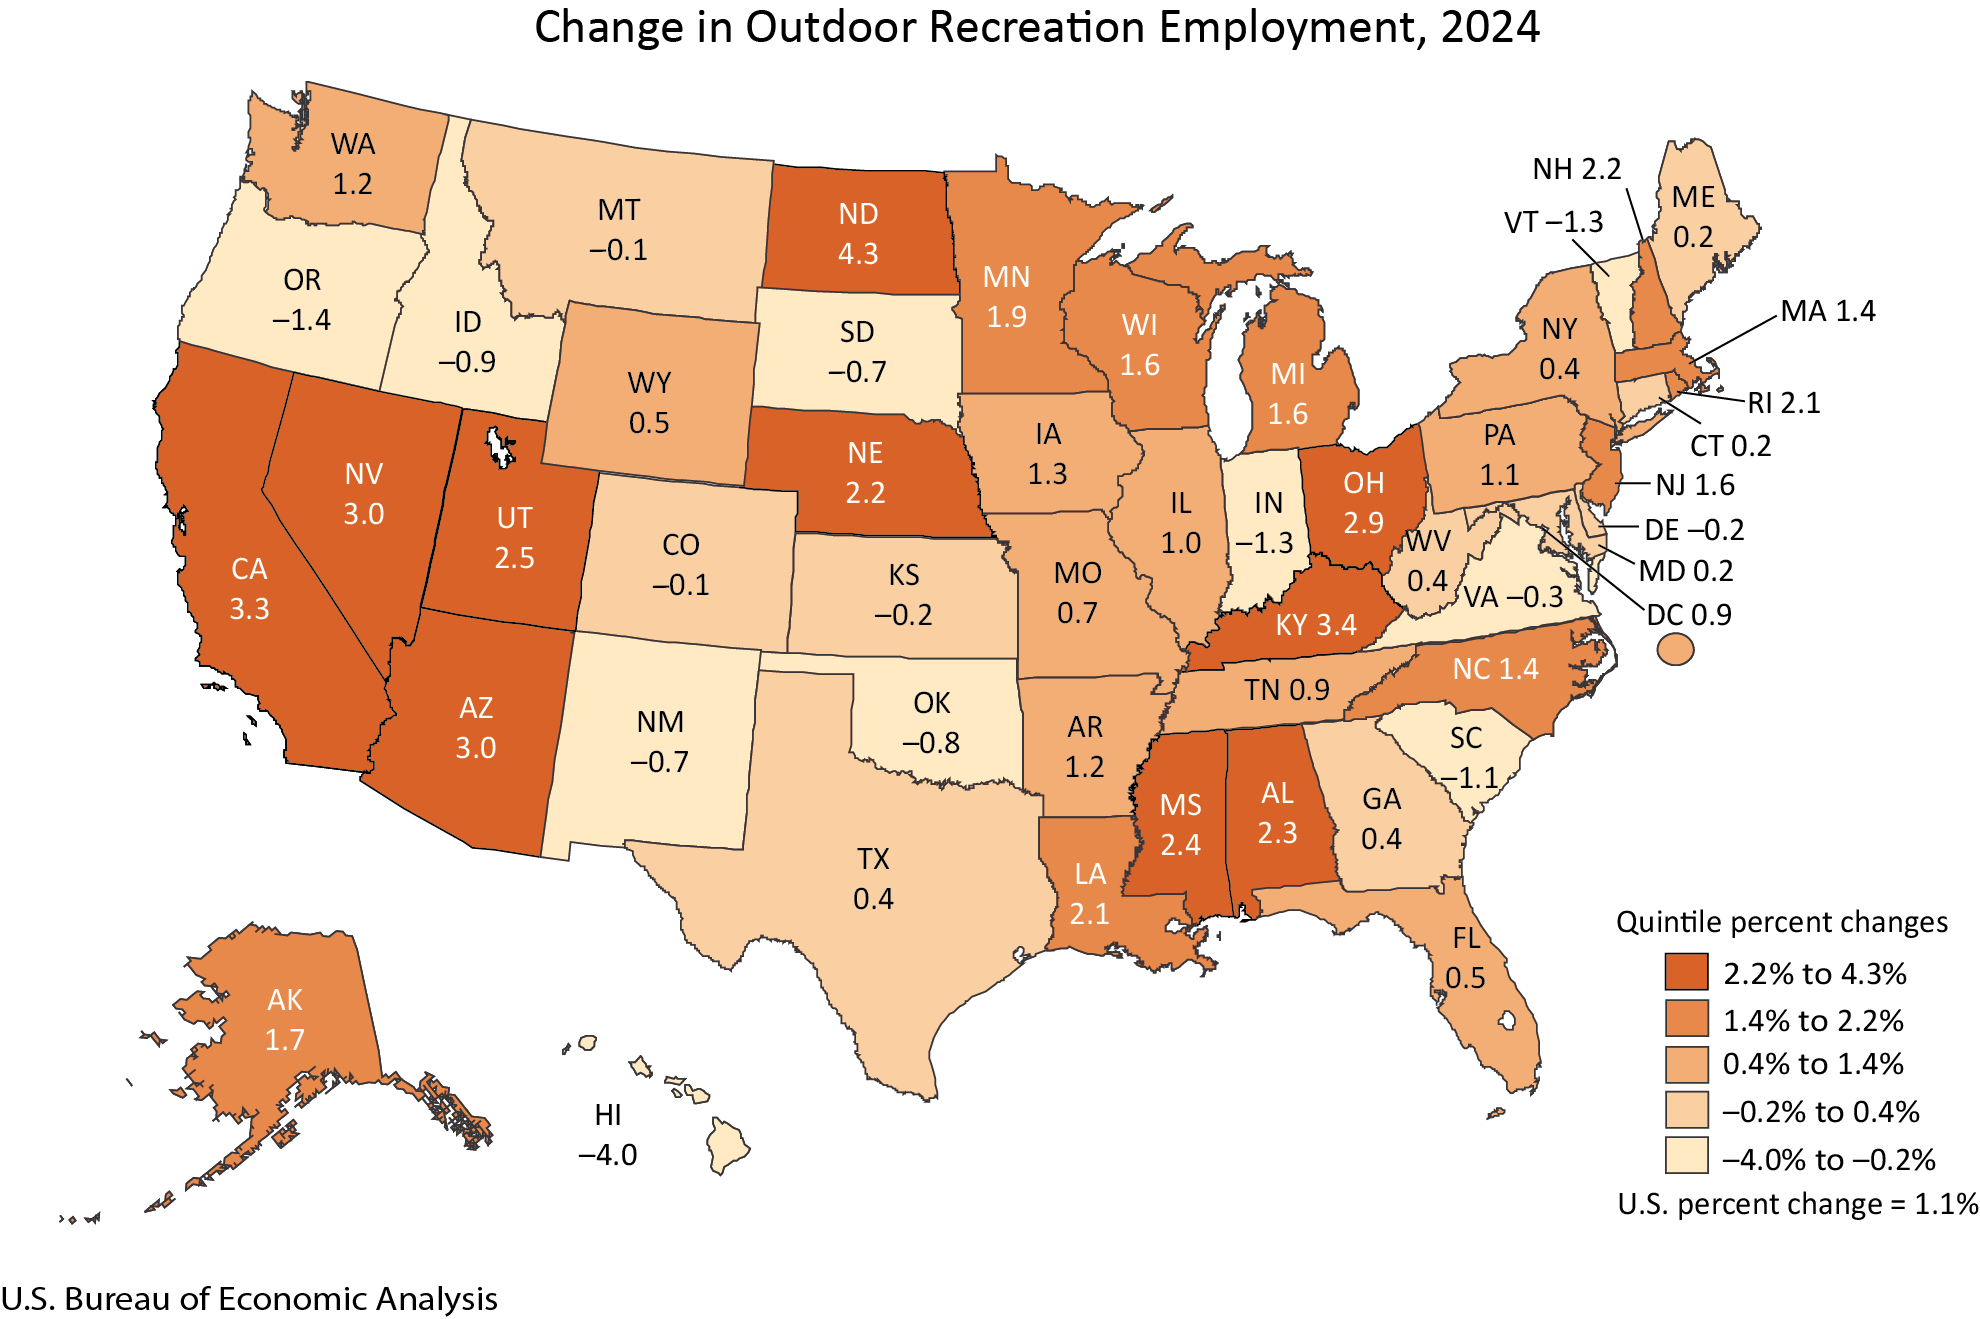
The BEA’s interactive tables, accessible through the BEA website, allow for detailed exploration of these state-specific figures. For instance, the change in outdoor recreation employment in 2024 paints a varied picture. North Dakota saw the highest percentage increase in outdoor recreation jobs, with a growth of 4.3 percent. This may be linked to increased activity in areas like hunting, fishing, or state park utilization. Conversely, Hawaii experienced a decline in outdoor recreation employment by 4.0 percent, a trend that warrants further investigation into potential contributing factors such as shifts in tourism patterns, labor availability, or changes in specific outdoor recreation businesses.
The data reveal that outdoor recreation employment expanded in 36 states and the District of Columbia, indicating a widespread positive trend in job creation across the nation. This broad-based growth highlights the sector’s capacity to generate employment opportunities in diverse geographic regions.
Deconstructing Outdoor Recreation: Activities and Industries
The BEA categorizes outdoor recreation activities into three broad groups: conventional activities, other activities, and supporting activities.
-
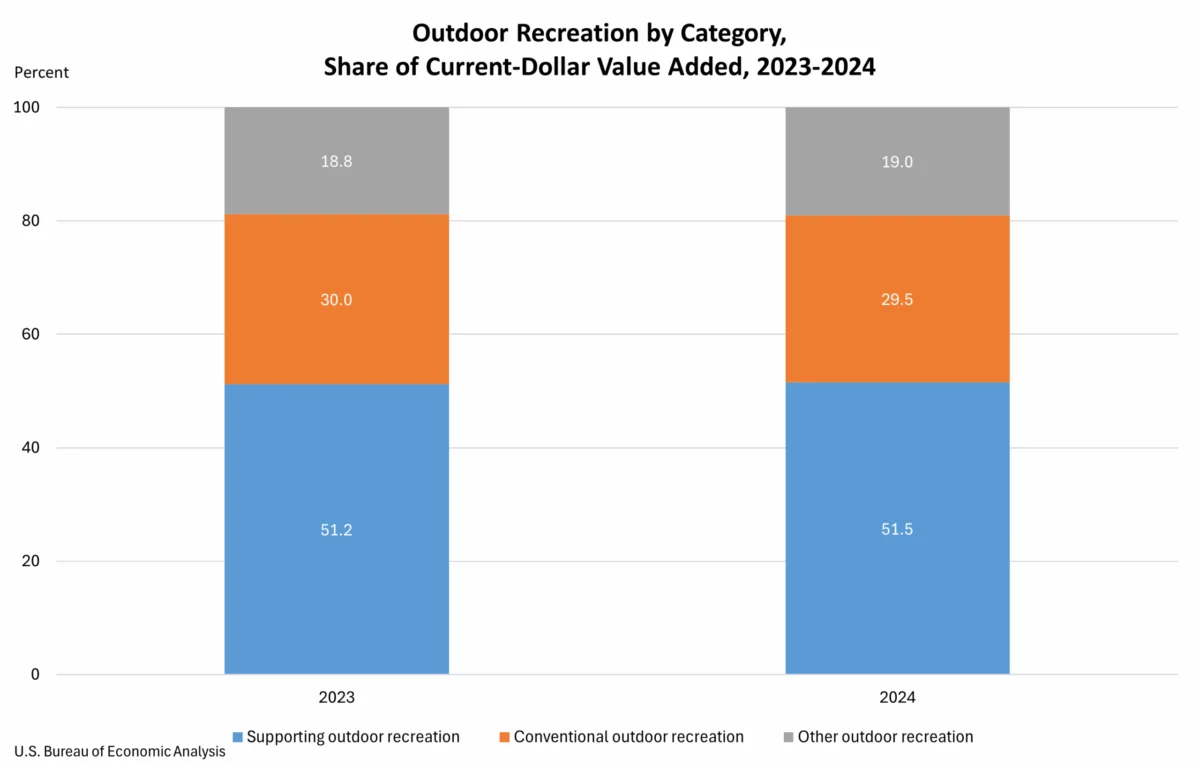
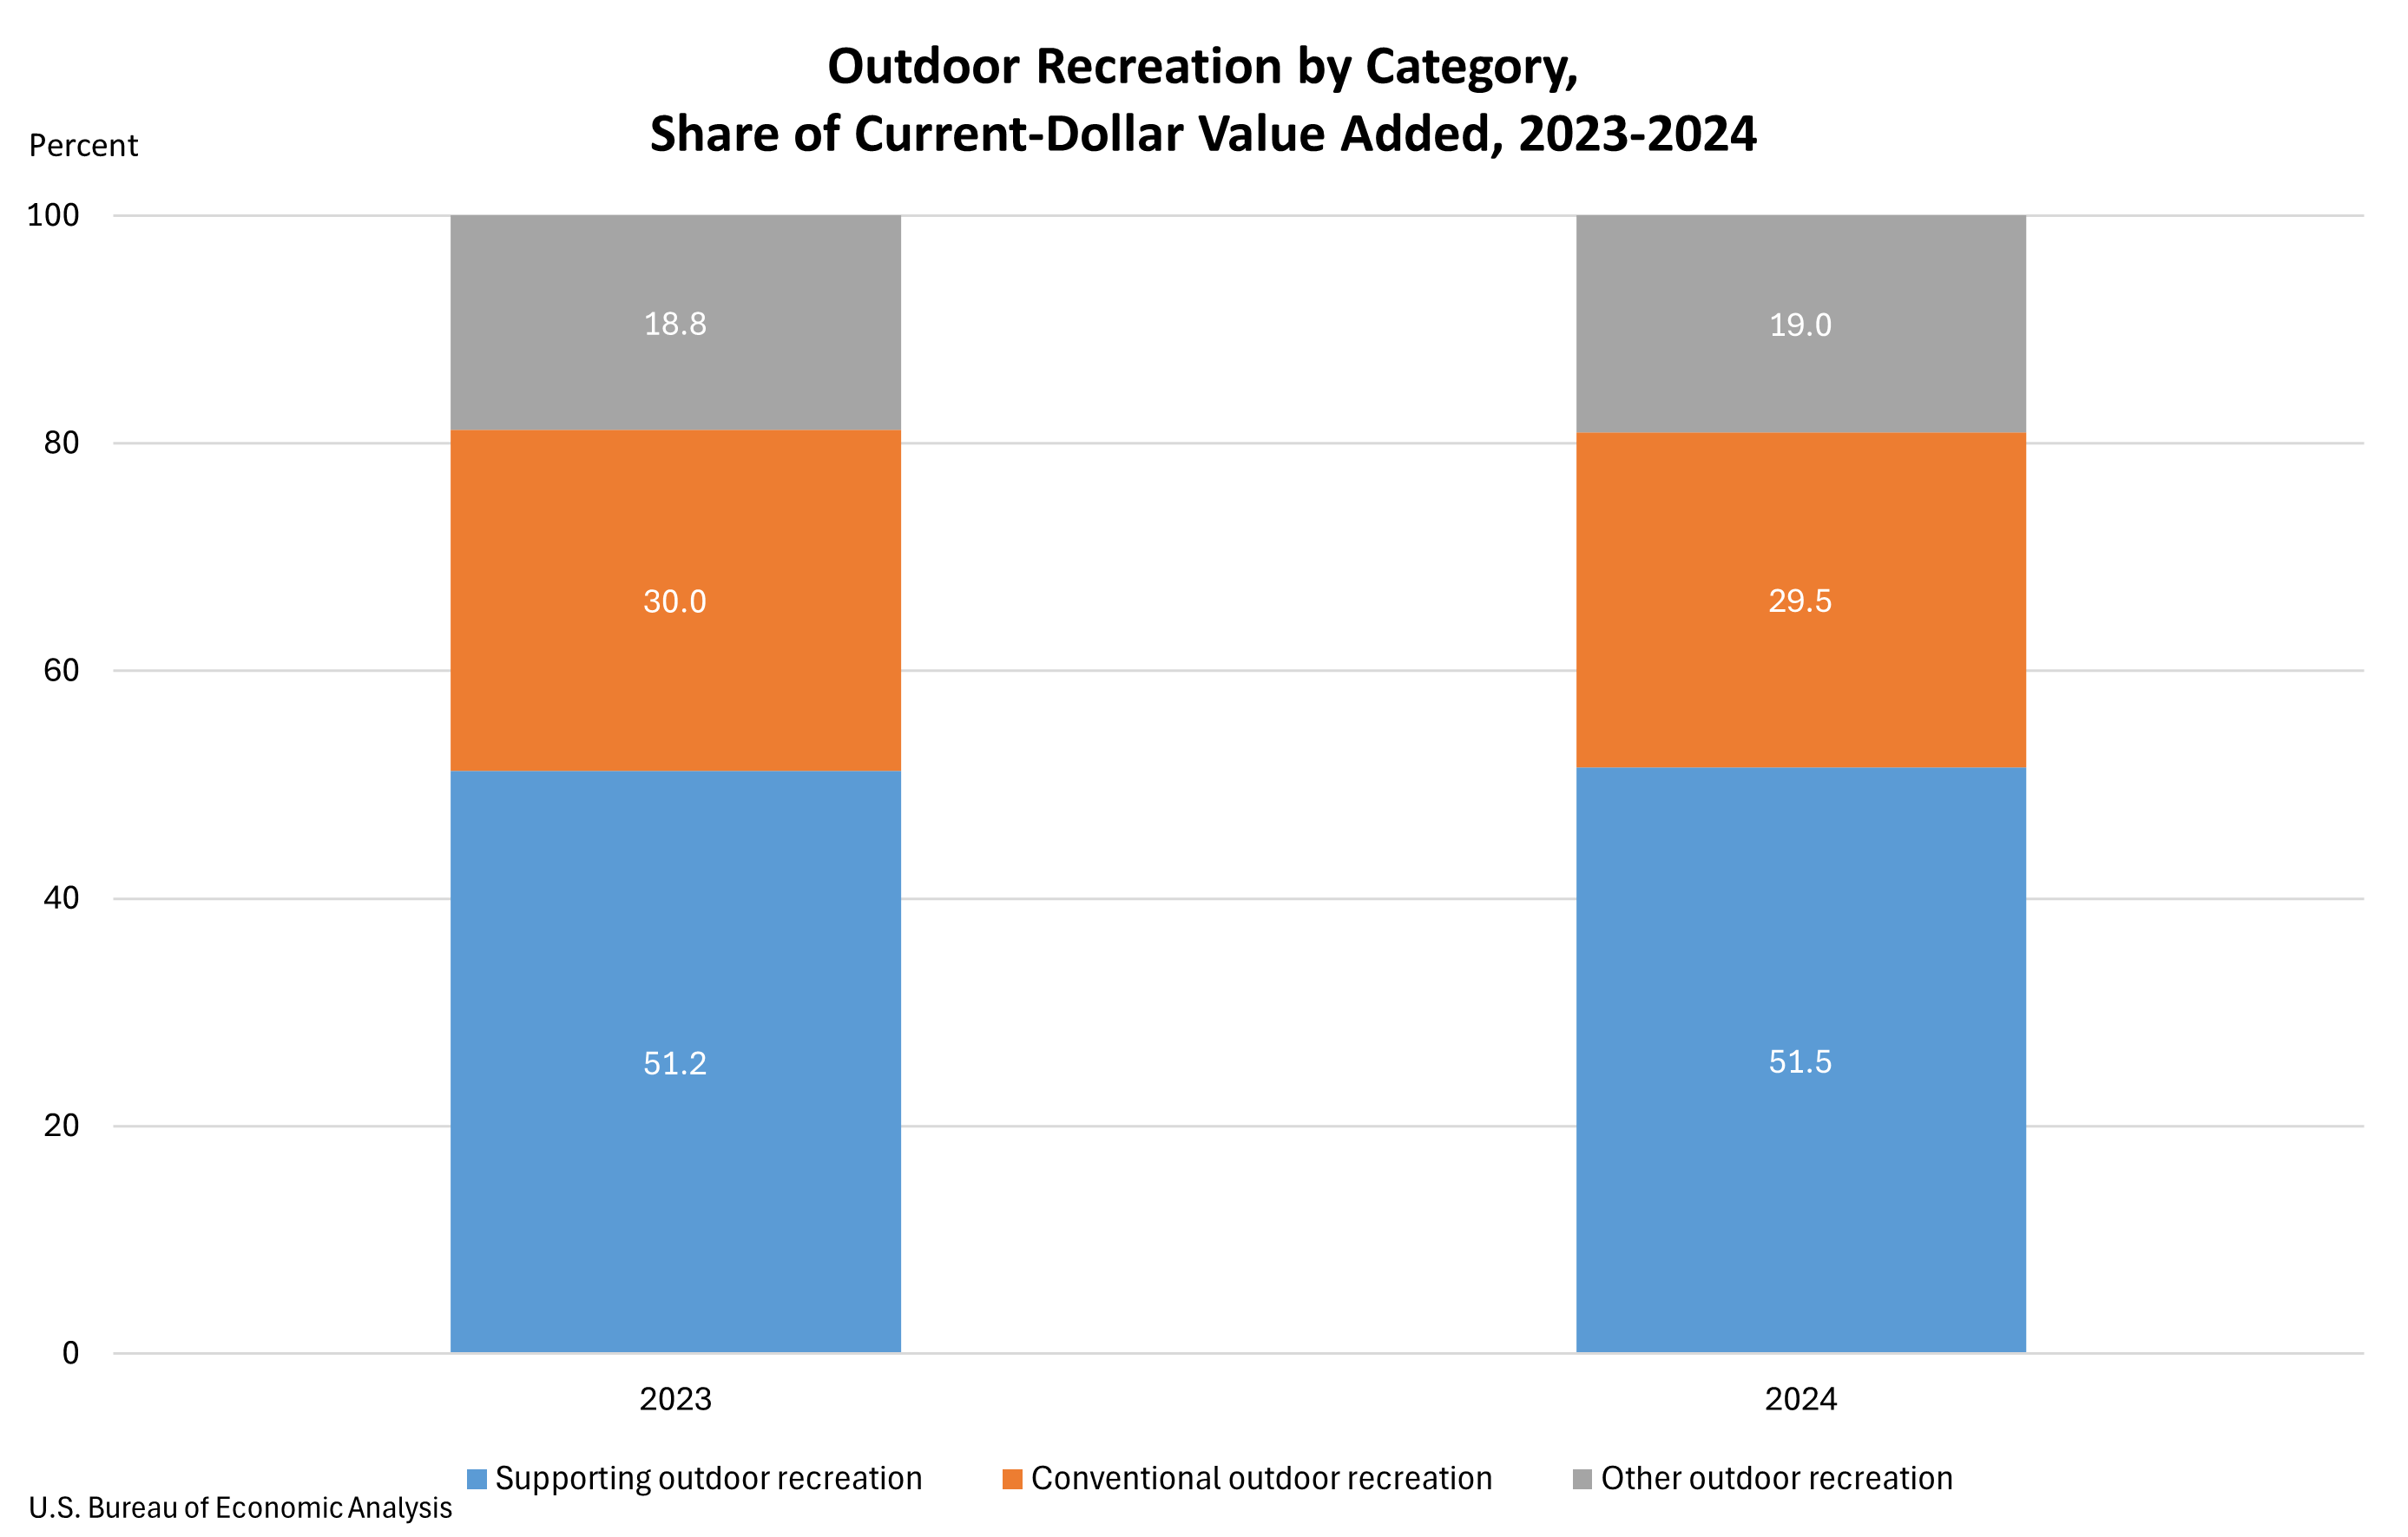
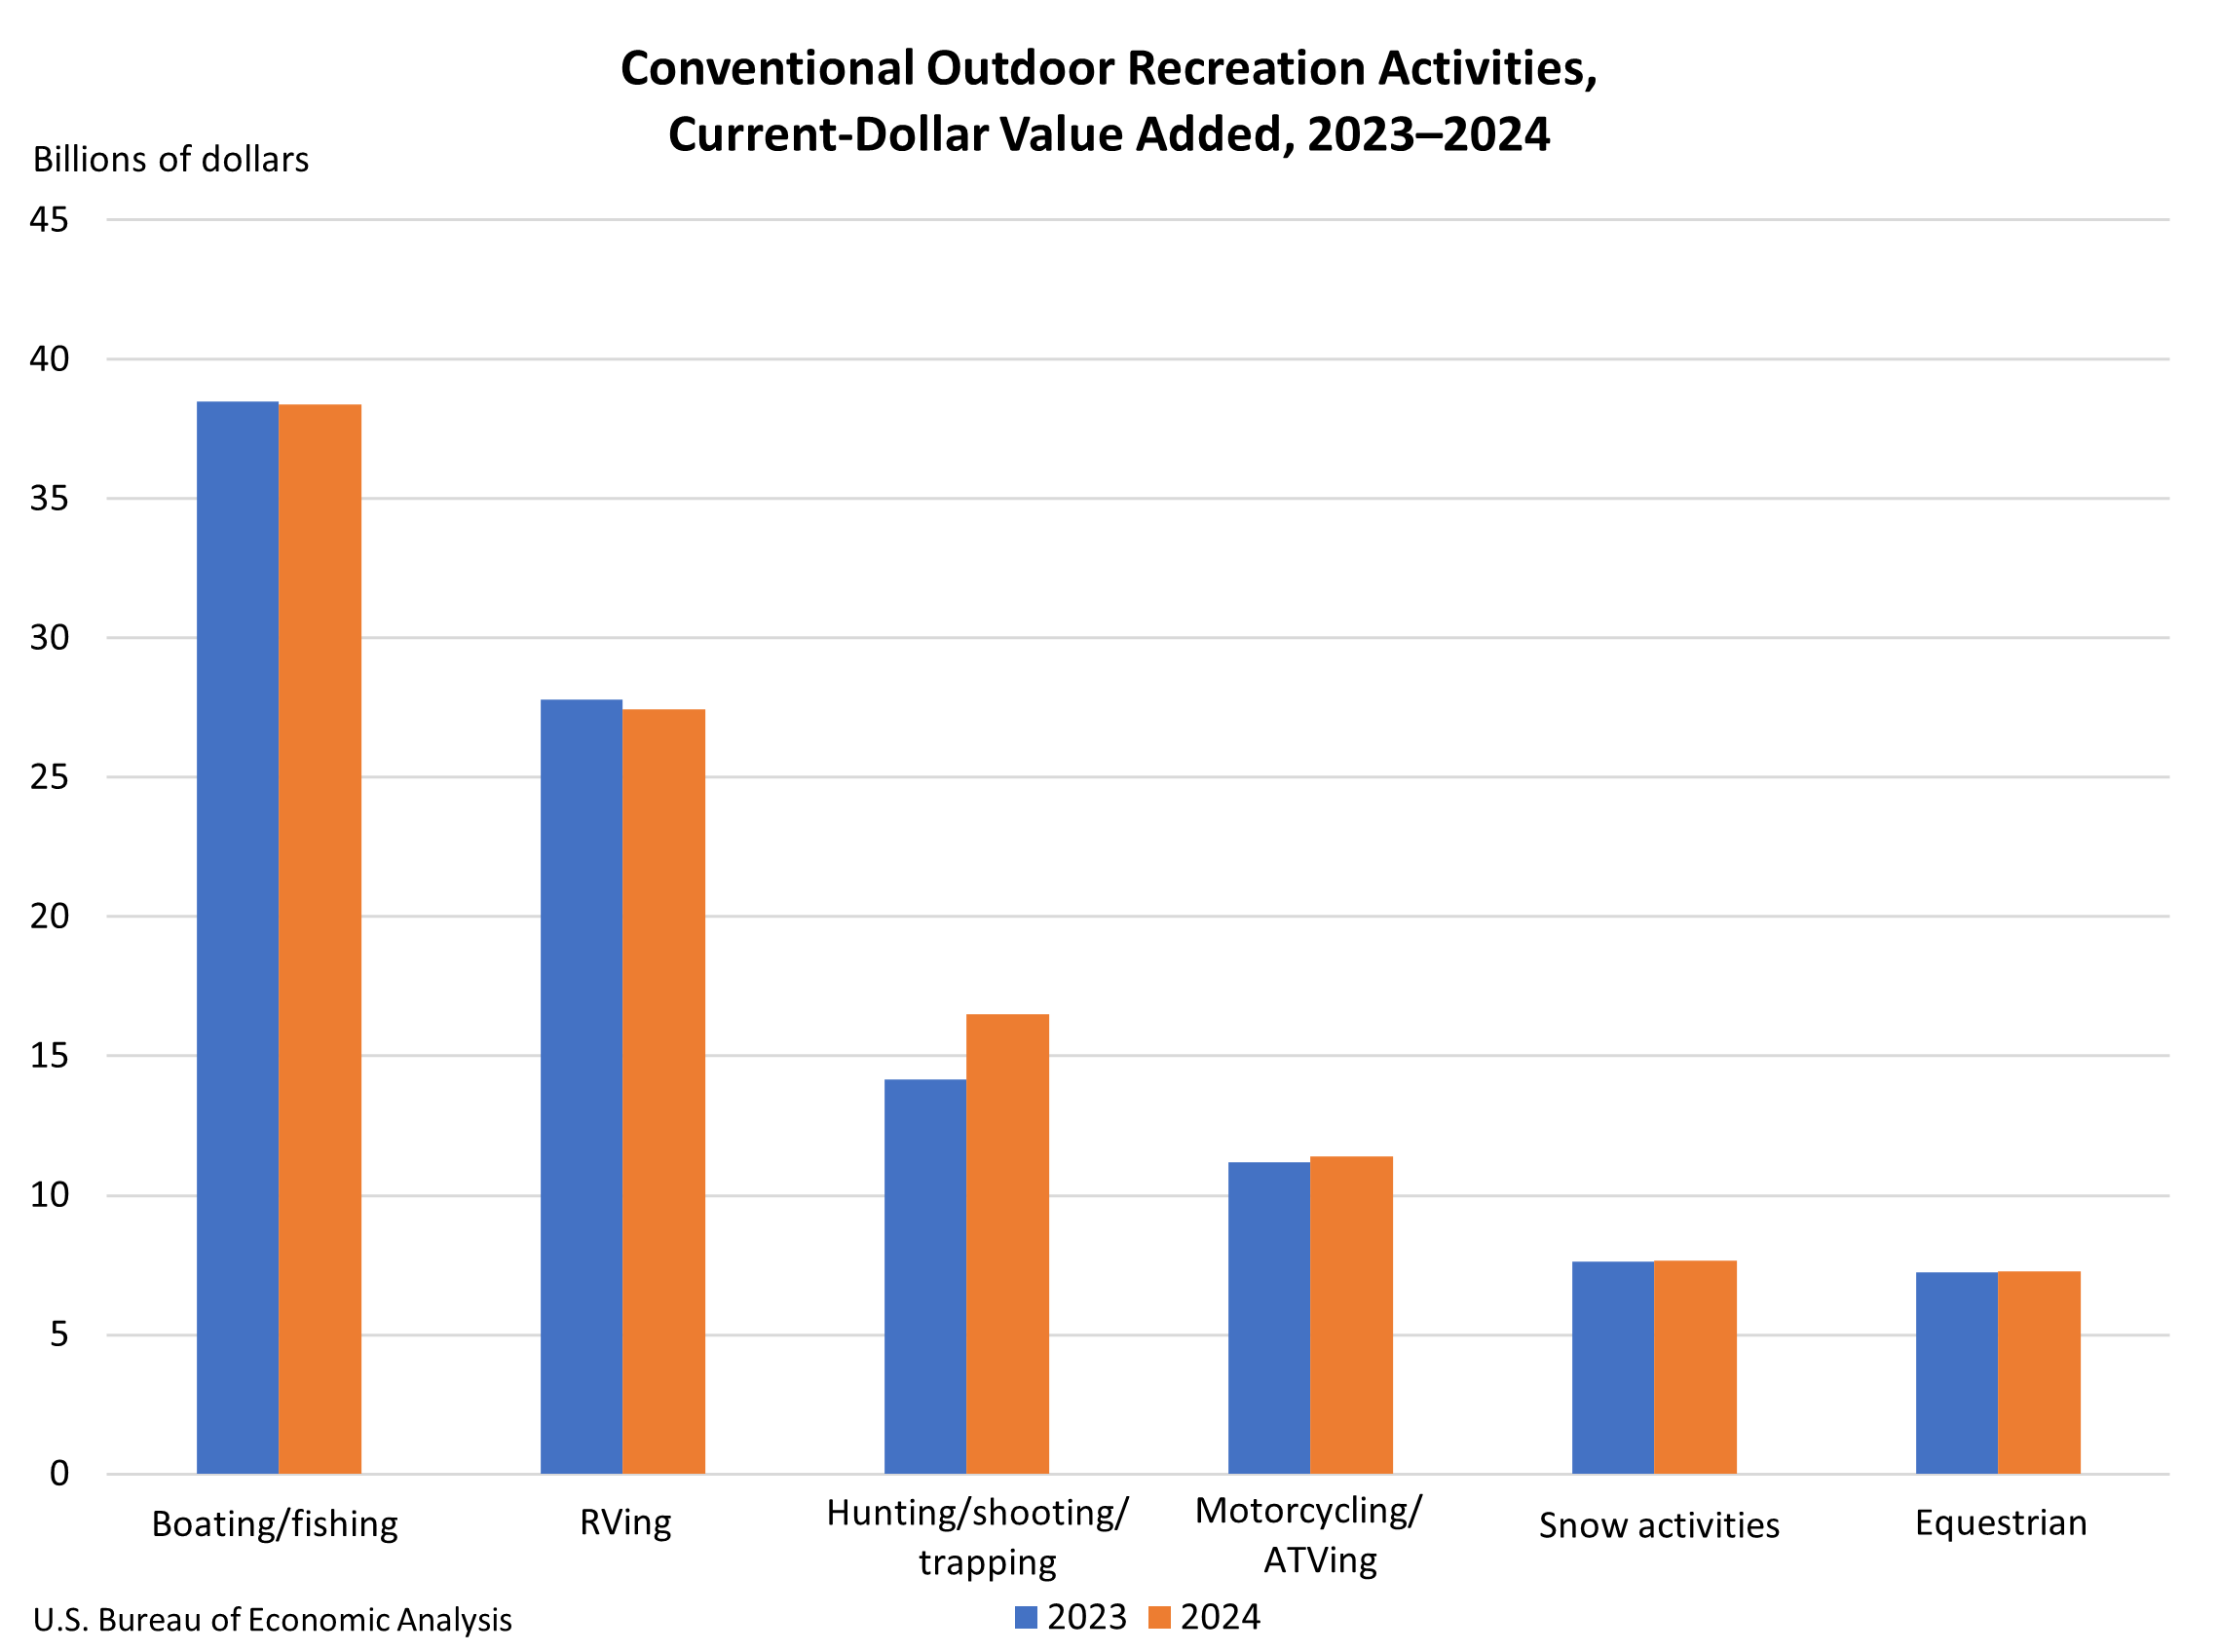
Conventional Activities: This category includes traditional pursuits such as bicycling, boating, hiking, camping, hunting, fishing, and skiing. In 2024, conventional outdoor recreation accounted for 29.5 percent of the total value added in the outdoor recreation economy. This represents a slight decrease from 30.0 percent in 2023, suggesting a relative shift in spending towards other categories.
-
Other Outdoor Recreation: This group encompasses activities like gardening, outdoor concerts, festivals, and recreational sports not typically classified as conventional. In 2024, these activities made up 19.0 percent of the value added, a marginal increase from 18.8 percent in 2023. This slight uptick may reflect growing popularity of community events and accessible recreational pastimes.
-
Supporting Activities: This is the largest and most encompassing category, accounting for 51.5 percent of the value added in 2024, up from 51.2 percent in 2023. Supporting activities include essential components that enable outdoor recreation, such as construction of recreational facilities, travel and tourism infrastructure, local transportation services, and government expenditures related to parks and public lands. The growth in this category was notably driven by travel and tourism, which includes spending on transportation, accommodation (hotels), and food services. This indicates that the infrastructure and services that facilitate outdoor experiences are crucial drivers of the sector’s overall economic contribution.
The BEA’s detailed breakdowns by activity reveal nuances within these broad categories. For example, within conventional activities, the contribution of specific pursuits such as bicycling, hiking, and camping can be analyzed, providing insights into consumer preferences and market trends. Similarly, understanding the drivers of growth in supporting activities, particularly in travel and tourism, is vital for stakeholders in the hospitality and transportation sectors.
Industry Contributions to the Outdoor Recreation Economy
The BEA also provides a detailed breakdown of how different industries contribute to the overall outdoor recreation economy. This analysis helps to identify the key sectors that benefit from and support outdoor activities.
The Arts, Entertainment, Recreation, Accommodation, and Food Services industry group stands out as the largest contributor to the U.S. outdoor recreation economy. In 2024, this sector generated $174.4 billion in value added, representing 25.0 percent of the total. This comprehensive industry group encompasses a wide range of businesses, from amusement parks and museums to hotels, restaurants, and sports facilities, all of which are intrinsically linked to outdoor recreation experiences.
At the state level, this industry group was the leading contributor to outdoor recreation value added in 23 states and the District of Columbia. California, with its diverse range of attractions and a massive population, led the nation with $24.1 billion in value added from this sector. Florida, a perennial tourist destination, followed closely with $22.7 billion, and New York contributed $11.8 billion, highlighting the economic power of its hospitality and entertainment offerings tied to outdoor pursuits.
The Retail Trade sector was the second-largest contributor to the national outdoor recreation economy, accounting for $169.1 billion, or 24.3 percent of the value added. This sector includes businesses that sell outdoor gear, apparel, sporting goods, and recreational equipment. Retail trade emerged as the largest contributor to outdoor recreation value added in 24 states, demonstrating its broad-based impact across the country. California again led in this category with $19.3 billion, followed by Texas ($14.4 billion) and Florida ($13.4 billion). The significant contribution of retail trade underscores the direct consumer spending associated with engaging in outdoor activities.
The Manufacturing sector ranked as the third-largest contributor, generating $91.3 billion, or 13.1 percent of the value added. This sector is responsible for producing a wide array of goods used in outdoor recreation, including vehicles (boats, RVs, ATVs), sporting equipment, and apparel. Manufacturing was the primary industry for outdoor recreation value added in two states: Indiana and Louisiana. Texas led the nation in manufacturing contributions to outdoor recreation with $13.1 billion, followed by California ($11.6 billion) and Indiana ($9.1 billion). This highlights the critical role of domestic production in supplying the goods that fuel the outdoor recreation market.
Other significant industry contributors include Construction, Transportation and Warehousing, and Professional, Scientific, and Technical Services, all of which play vital roles in developing, accessing, and enhancing outdoor recreational opportunities.
Background and Significance of the BEA’s Outdoor Recreation Statistics
The U.S. Bureau of Economic Analysis began producing official statistics on the outdoor recreation economy in 2020, a response to growing recognition of the sector’s economic impact and the need for more detailed data to inform policy and business decisions. The annual release of these statistics, often coinciding with key periods for outdoor activity and planning, provides a vital benchmark for understanding economic trends and opportunities.
The BEA’s methodology for calculating these figures is rigorous, drawing upon a wide array of data sources, including surveys of businesses and households, government records, and national economic accounts. The inclusion of both national and state-level data allows for a comprehensive understanding of the sector’s economic footprint.
The outdoor recreation economy is not merely a leisure pursuit; it is a significant economic driver that supports jobs, generates revenue, and contributes to community well-being. The data released today underscore its resilience and its capacity for growth, even in the face of broader economic fluctuations. For communities that rely heavily on tourism and outdoor-related businesses, these statistics provide critical evidence of their economic importance and can inform strategies for sustainable development and investment.
Broader Implications and Future Outlook
The consistent growth of the outdoor recreation economy, despite a slight moderation in 2024, signals a durable consumer preference for activities that connect people with nature. This trend has profound implications for land management, conservation efforts, and the development of infrastructure that supports outdoor access. As demand continues to rise, there will be increasing pressure on public lands and a greater need for investment in trails, parks, and recreational facilities.
Businesses operating within the outdoor recreation sector can leverage these statistics to identify growth opportunities, understand market trends, and advocate for policies that support their industry. For instance, the strong performance of supporting activities, particularly travel and tourism, suggests that investments in transportation infrastructure and hospitality services can yield significant economic returns.
Furthermore, the BEA’s data can inform government policy at federal, state, and local levels. Understanding which activities and industries are driving growth can help policymakers allocate resources effectively for infrastructure development, workforce training, and conservation initiatives. The focus on employment and compensation also highlights the sector’s role in providing livelihoods for many Americans.
The BEA’s commitment to providing annual updates ensures that these vital economic indicators remain current, allowing for timely analysis and informed decision-making. As the outdoor recreation economy continues to evolve, these statistics will serve as an indispensable tool for navigating its complexities and harnessing its full potential. The next release, scheduled for Fall 2026, will provide updated data for the 2025 calendar year, offering further insights into the ongoing trajectory of this dynamic sector.