Lana Rhoades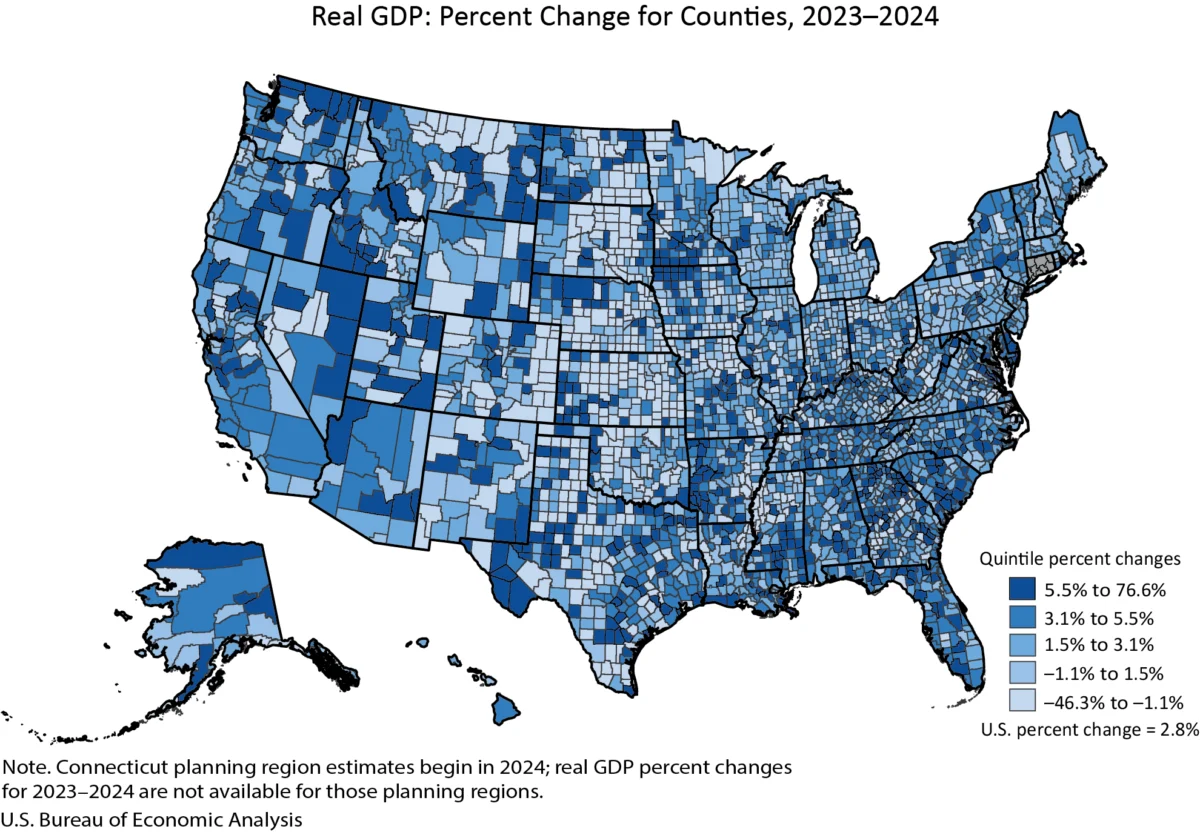
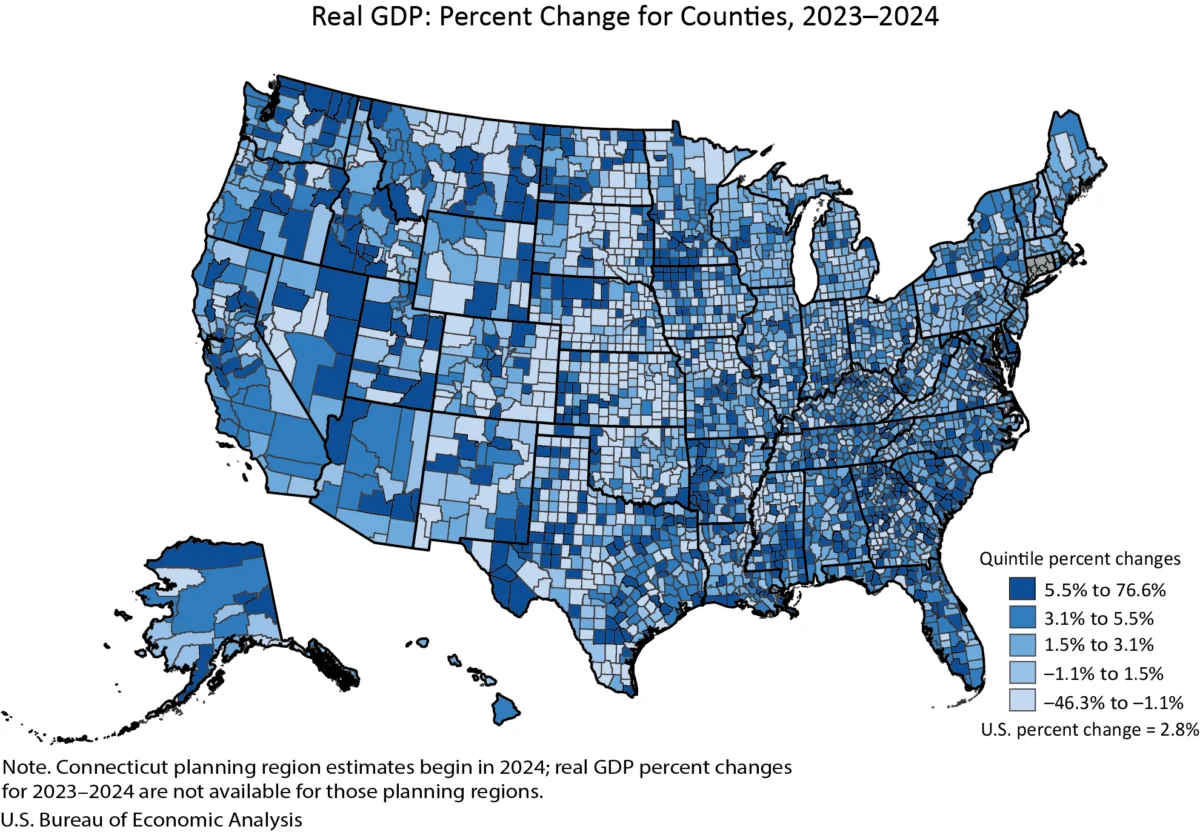
The economic landscape of the United States in 2024 presented a mixed picture at the county level, with significant variations in both gross domestic product (GDP) growth and personal income trends. According to the latest estimates released by the U.S. Bureau of Economic Analysis (BEA), real GDP expanded in 2,273 counties, while 809 counties experienced a decline, and 24 remained unchanged. This divergence highlights the localized nature of economic activity and the varied impacts of national and global economic forces across different regions of the country.
County-Level Economic Performance: A Detailed Look
The U.S. Bureau of Economic Analysis, a primary source for national economic statistics, unveiled its comprehensive county-level data for 2024, offering an intricate view of economic vitality across the nation’s sub-state regions. The report underscores that economic performance is far from uniform, with some counties experiencing robust expansion and others grappling with contraction.
Real Gross Domestic Product (GDP):
The BEA’s findings indicate that a substantial majority of U.S. counties saw their real GDP increase in 2024. Specifically, 2,273 counties experienced positive GDP growth. Conversely, a notable portion of counties, numbering 809, recorded a decrease in their real GDP, suggesting localized economic challenges or a shift in industrial output. An additional 24 counties reported no significant change in their real GDP for the year.
The magnitude of these changes varied dramatically. Carter County, Montana, stood out with an impressive 76.6 percent increase in its real GDP, signaling a period of significant economic acceleration. In stark contrast, Baca County, Colorado, faced a considerable economic downturn, with its real GDP declining by 46.3 percent. These extreme figures underscore the vast disparities in economic fortunes at the county level.
Scale of County Economies:
The sheer size of county economies, as measured by real GDP, also exhibits considerable variation. In 2024, New York County, New York (Manhattan), continued to be an economic powerhouse, boasting a total real GDP of $813.7 billion. This figure dwarfs that of Issaquena County, Mississippi, which registered the smallest real GDP at $15.7 million. This disparity in economic scale often correlates with population density, industrial diversity, and the presence of major corporate headquarters and financial centers.
Personal Income Trends: A Broader Economic Indicator
Beyond GDP, personal income serves as a critical indicator of the economic well-being of residents within a county. The BEA’s data for 2024 revealed a generally positive trend in personal income across the nation’s counties.
Personal Income Growth:
In 2024, personal income, measured in current dollars, saw an increase in 2,768 counties. This suggests that a widespread rise in earnings and other income sources contributed to improved financial standing for a significant portion of the U.S. population at the county level. However, 331 counties experienced a decrease in personal income, and 7 counties reported no change.
The range of change in personal income also demonstrated significant variation. Harding County, South Dakota, recorded the highest percentage increase in personal income at 22.6 percent. On the other end of the spectrum, Issaquena County, Mississippi, saw its personal income decline by 23.3 percent, mirroring its negative GDP trend.
Levels of Personal Income:
Similar to GDP, personal income levels exhibit substantial differences across counties. Los Angeles County, California, led the nation with a total personal income of $818.5 billion in 2024. In contrast, Loving County, Texas, reported the lowest total personal income at $10.6 million. These figures reflect the economic output and employment opportunities available within these regions, directly impacting the disposable income of their residents.
County Economic Performance by Population Size
The BEA report also provided insights into economic trends when categorized by county population size, offering a more nuanced understanding of how different types of communities are faring.
Large Counties (Population > 500,000)
- Trends: In 2024, 145 large counties experienced GDP growth, while none reported a decline, and one remained unchanged. This indicates a strong and relatively consistent economic performance among the nation’s most populous counties.
- Trend Range: The GDP growth in these large counties ranged from a high of 10.7 percent in Pinal County, Arizona, to 0.0 percent in Johnson County, Kansas, suggesting robust expansion in many of these economic centers.
- Size Range: New York County, New York, was the largest in terms of real GDP at $813.7 billion, while Pinal County, Arizona, had a significant GDP of $12.7 billion.
Medium Counties (Population 100,000 to 500,000)
- Trends: Medium-sized counties showed a healthy economic trend, with 451 experiencing GDP growth, 20 reporting a decline, and 3 remaining unchanged.
- Trend Range: The GDP growth in this category was led by Jefferson County, Texas, with a 12.4 percent increase, and the decline was less severe than in smaller counties, with Black Hawk County, Iowa, experiencing a -2.6 percent change.
- Size Range: Mercer County, New Jersey, recorded a substantial GDP of $46.6 billion, while Liberty County, Texas, had a GDP of $2.6 billion.
Small Counties (Population < 100,000)
- Trends: Small counties exhibited the most varied economic performance. A total of 1,677 small counties saw GDP growth, but a significant 789 experienced a decline, and 20 remained unchanged. This highlights the vulnerability of smaller economies to external shocks and sector-specific downturns.
- Trend Range: The extreme ends of GDP performance were predominantly found in small counties, with Carter County, Montana, at the top with a 76.6 percent increase, and Baca County, Colorado, at the bottom with a -46.3 percent decline.
- Size Range: Martin County, Texas, had a notable GDP of $15.1 billion, while Issaquena County, Mississippi, represented the lower end with $15.7 million.
Personal Income by Population Size
The analysis of personal income by population size also reveals distinct patterns:
Large Counties (Population > 500,000)
- Trends: Large counties saw 146 experiencing personal income growth.
- Trend Range: San Joaquin County, California, led with a 9.7 percent increase, while Philadelphia County, Pennsylvania, saw a 2.7 percent increase, indicating a positive income trajectory.
- Size Range: Los Angeles County, California, had the highest personal income at $818.5 billion, and Pinal County, Arizona, had $26.1 billion.
Medium Counties (Population 100,000 to 500,000)
- Trends: 474 medium counties experienced personal income growth.
- Trend Range: Merced County, California, reported a 10.9 percent increase, and Genesee County, Michigan, saw a 1.6 percent increase, demonstrating moderate income growth.
- Size Range: Collier County, Florida, had a personal income of $62.5 billion, and Floyd County, Georgia, had $4.9 billion.
Small Counties (Population < 100,000)
- Trends: The trend of personal income growth was most pronounced in small counties, with 2,148 experiencing growth, 331 declining, and 7 unchanged.
- Trend Range: Harding County, South Dakota, showed the highest personal income growth at 22.6 percent, while Issaquena County, Mississippi, experienced the largest decline at -23.3 percent.
- Size Range: Teton County, Wyoming, had a personal income of $12.4 billion, and Loving County, Texas, had $10.6 million.
Background and Methodology of the BEA Update
The release of these 2024 county-level statistics is part of the BEA’s ongoing commitment to providing timely and comprehensive economic data. The estimates for 2024 incorporate the results of the BEA’s annual updates to GDP and personal income by county, which were released concurrently. This update also included revisions to county data from 2020 to 2023, ensuring a more accurate historical context.
Data Revisions and Integration:
These revisions are crucial as they integrate new and more complete source data. This meticulous process aligns the county-level data with broader national economic accounts, including the National Income and Product Accounts (NIPA) and state-level GDP and personal income statistics. The BEA’s annual updates are designed to reflect the most current and accurate economic picture available, drawing from a wide array of sources such as tax records, business surveys, and government administrative data.
Geographic Definition Changes:
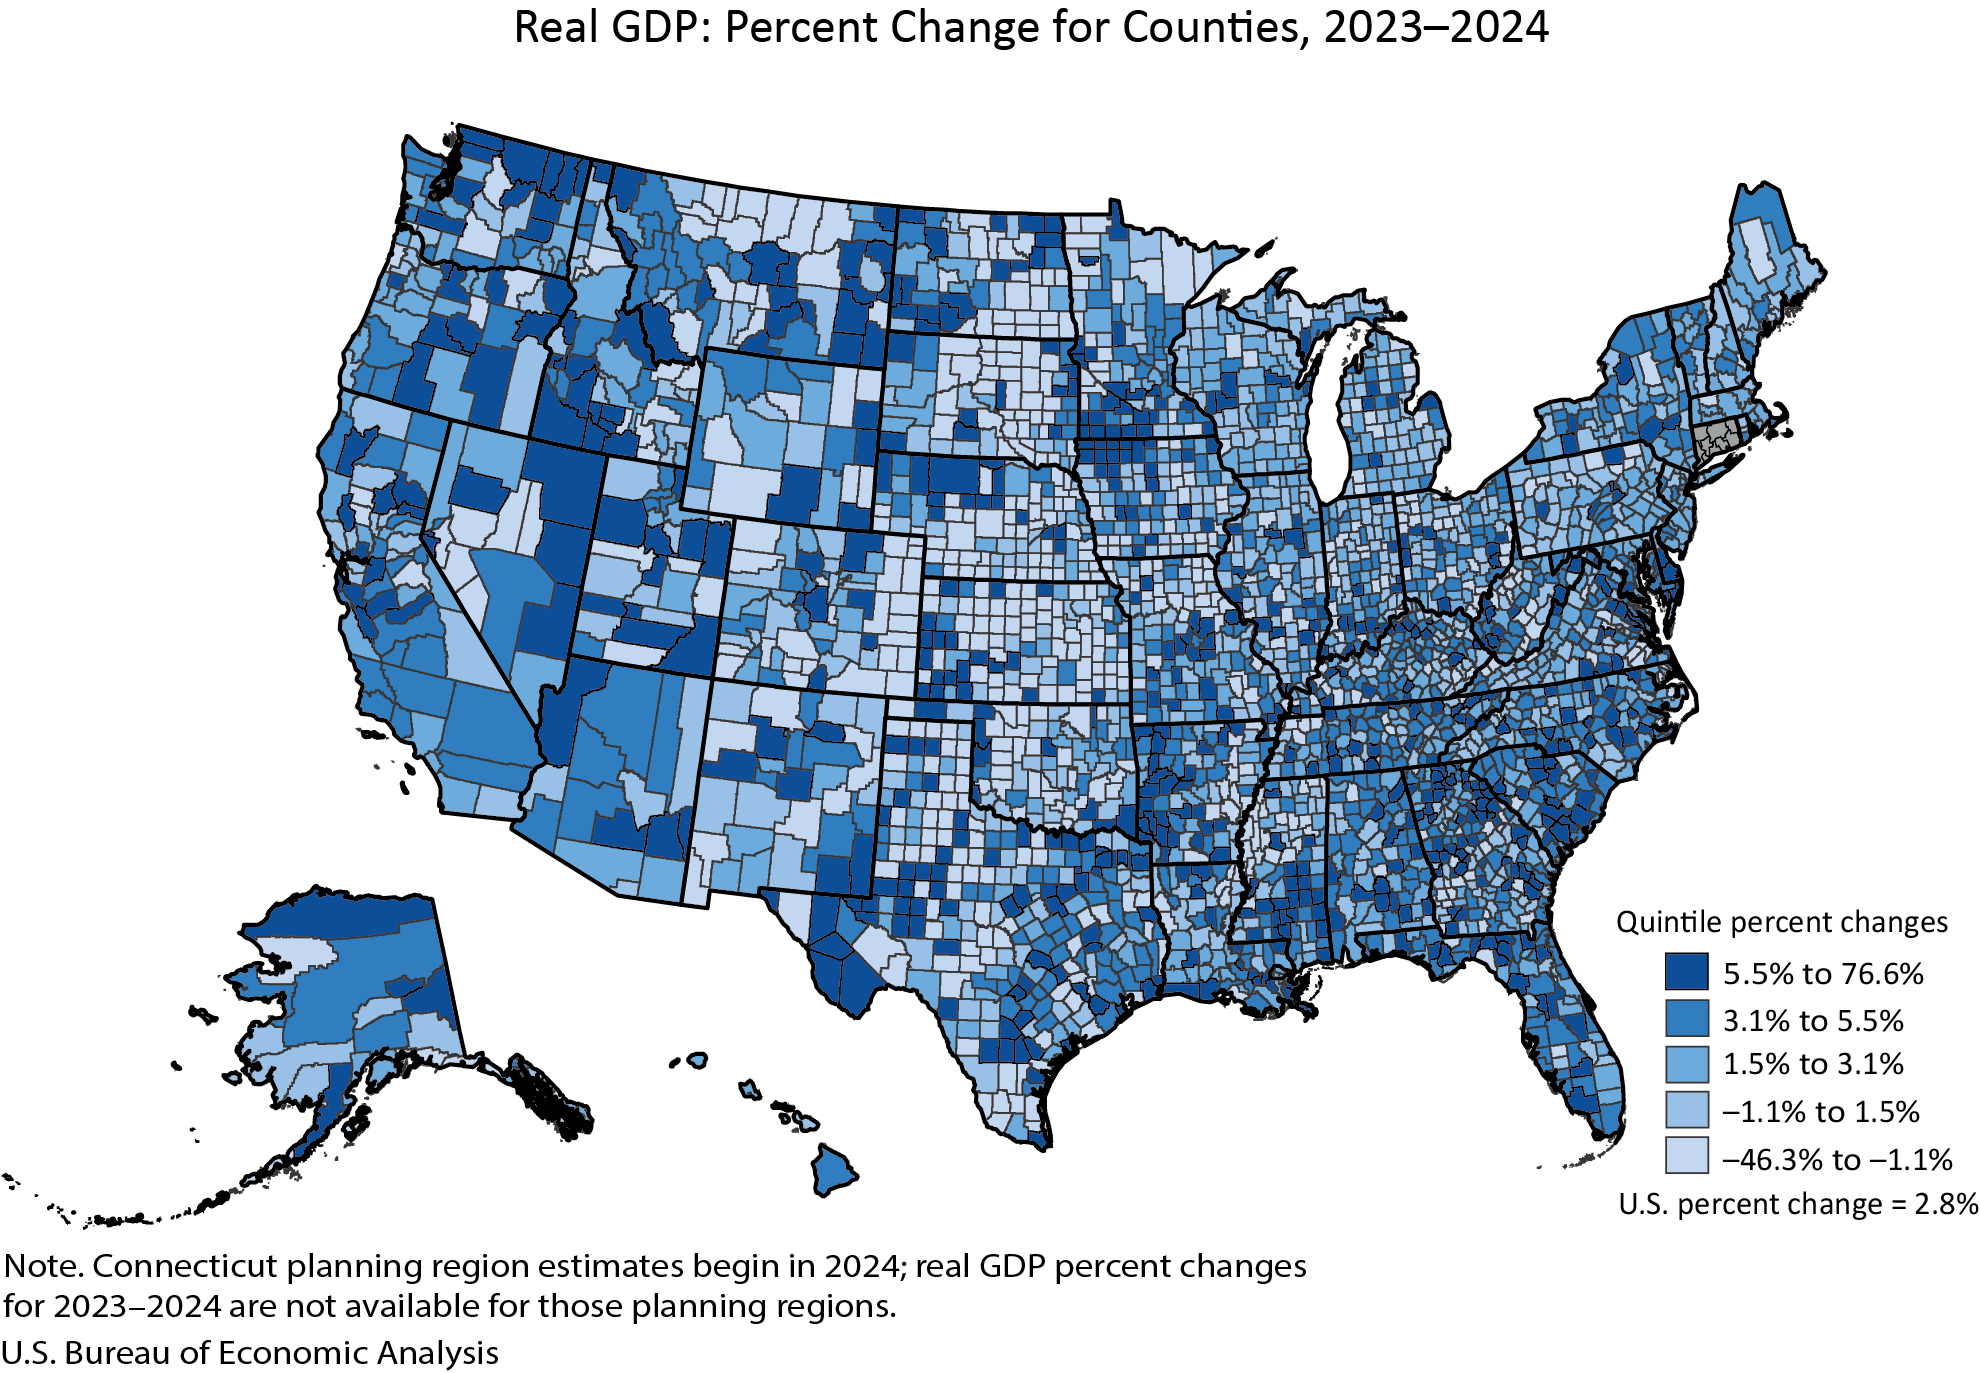
A significant methodological shift noted in this release concerns Connecticut. Beginning with the 2024 estimates, Connecticut’s data will be presented using its planning region geographic definitions instead of traditional county boundaries. This change, while providing a more granular view of regional economic activity within the state, means that Connecticut’s data is not included in the percent change ranges for counties presented in this specific release.
Per Capita Personal Income:
In addition to GDP and total personal income, the BEA also released new estimates for per capita personal income for 2024. These figures are calculated by dividing total personal income by U.S. Census Bureau population estimates for the corresponding years, providing an average income level per person in each county.
Evolution of BEA County Data Releases
This year’s release marks a notable change in how BEA presents its county-level economic data. For the first time, the annual GDP and personal income by county statistics are being published in a single, combined news release. This consolidation aims to provide a more holistic view of county economies and replaces the previous practice of issuing two separate releases on different days.
Discontinuation of Metropolitan Area Statistics:
In a significant shift, the BEA has also announced the discontinuation of its publication of statistics for metropolitan statistical areas (MSAs), micropolitan statistical areas, metropolitan divisions, combined statistical areas, and their metropolitan and nonmetropolitan portions. While GDP and personal income will continue to be available at the county level, these broader statistical area classifications will no longer be directly updated by the BEA in this context. This decision reflects a strategic alignment with data user needs and a focus on the most granular level of economic reporting.
Modernized Data Presentation:
Furthermore, the BEA has updated its data presentation methods. Tables that were previously embedded within the news releases are now exclusively available through BEA’s online Interactive Data Application. This change is intended to reduce redundancy, increase efficiency, and direct users to a more flexible and comprehensive data platform. The Interactive Data Application allows for customizable table generation, full time-series analysis, and data downloads in various formats, including PDF, Excel, and CSV. Links to these interactive tables are provided within the news release for user convenience.
Implications and Broader Economic Context
The divergent trends in county-level GDP and personal income have several potential implications for regional economic development, policy-making, and individual economic well-being.
Regional Disparities:
The significant differences in growth rates and income levels highlight persistent regional economic disparities in the United States. Counties experiencing robust growth may be benefiting from strong sectoral performance, strategic investments, or favorable business environments. Conversely, counties with declining economies may be facing challenges such as deindustrialization, labor shortages, out-migration, or vulnerability to commodity price fluctuations.
Policy Relevance:
These detailed county-level statistics are invaluable for policymakers at federal, state, and local levels. They inform decisions regarding infrastructure investment, workforce development programs, tax incentives, and targeted economic aid. Understanding which counties are thriving and which are struggling allows for more precise and effective policy interventions.
Investment and Business Decisions:
For businesses and investors, these data provide critical insights into the economic health and potential of specific geographic areas. Identifying counties with strong GDP growth and rising personal incomes can signal opportunities for expansion, new market entry, or talent acquisition. Conversely, areas with declining economic indicators may require careful consideration or present unique investment challenges.
Consumer Spending and Local Economies:
Personal income trends directly influence consumer spending, which is a major driver of local economies. Counties with growing personal incomes are likely to see increased demand for goods and services, supporting local businesses and employment. In contrast, declining personal incomes can lead to reduced consumer spending, potentially impacting job growth and business vitality.
Future Outlook and Data Availability
The BEA has outlined its release schedule for future county-level economic data. The next release, scheduled for December 2, 2026, will cover the 2025 GDP and personal income statistics for counties. This regular update cycle ensures that economic data users have access to the most current information for analysis and decision-making.
Data Archiving:
It is important for users to note that with each new release, the previous year’s data will be superseded in the Interactive Data Application. Historical data, including the original figures from this 2024 release, will be accessible through BEA’s Data Archive. This ensures that researchers and analysts can access and compare data across different time periods.
The BEA’s commitment to providing detailed county-level economic data remains a cornerstone of its mission to promote understanding of the U.S. economy. The insights derived from these statistics are crucial for navigating the complex and ever-evolving economic landscape of the United States.