

 Lana Rhoades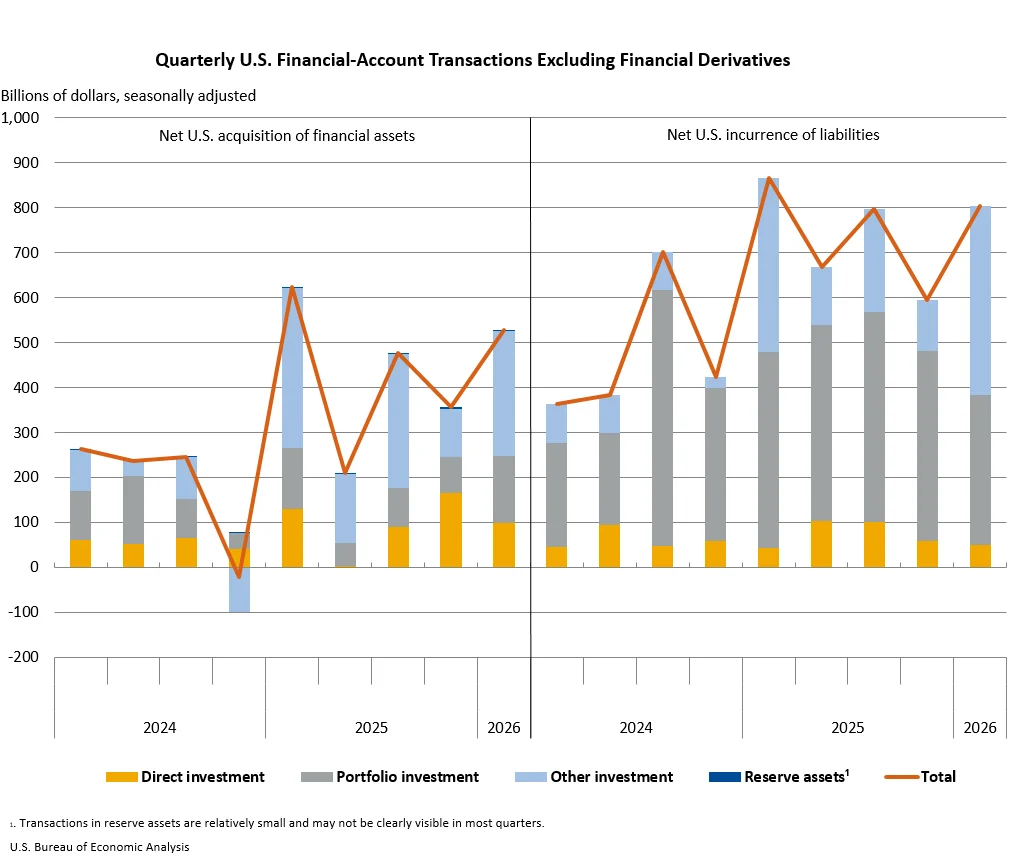
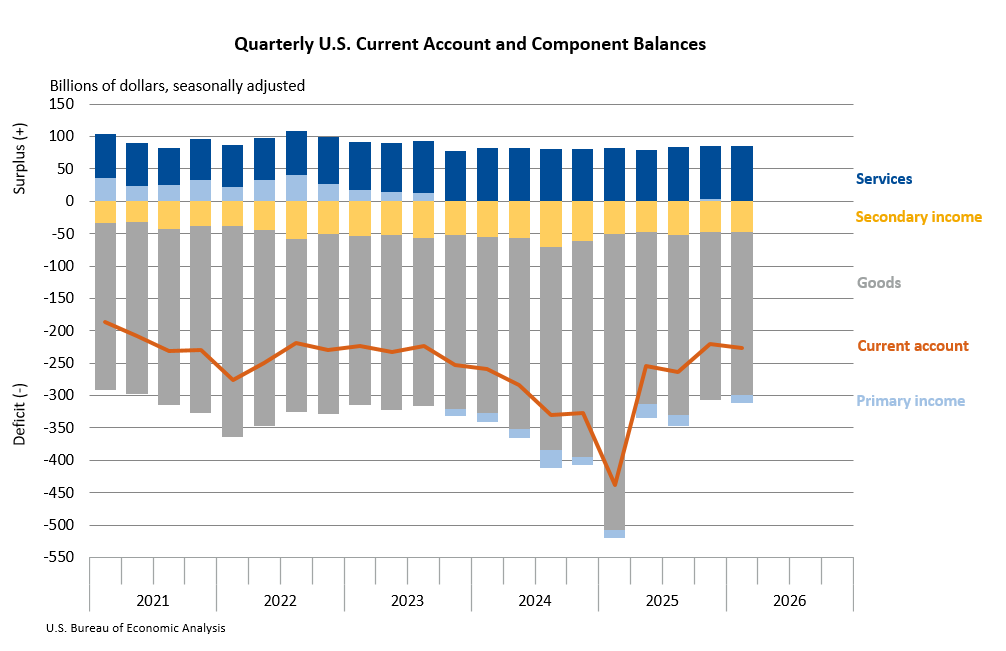
The U.S. current-account deficit, a key indicator of a nation’s international economic transactions, expanded by $5.8 billion, or 2.6 percent, to reach $226.8 billion in the first quarter of 2026. This widening trend, as detailed in the latest statistics released by the U.S. Bureau of Economic Analysis (BEA), signifies a notable shift in the nation’s trade and income relationships with the rest of the world. The deficit was previously reported at $221.1 billion in the fourth quarter of 2025, underscoring a clear acceleration in the imbalance during the initial months of 2026.
This latest figures reveal that the current-account deficit represented 2.9 percent of the U.S. current-dollar gross domestic product (GDP) in the first quarter, an increase from 2.8 percent observed in the preceding quarter. This uptick in the deficit’s proportion to the overall economy suggests a growing reliance on foreign capital to finance domestic consumption and investment, a dynamic that warrants close observation by policymakers and market participants alike.
The primary driver behind the first-quarter widening of the current-account deficit was a significant swing in the balance on primary income. This component, which encompasses earnings from investments abroad and income earned by foreign residents on their U.S. investments, shifted from a surplus in the fourth quarter of 2025 to a deficit in the first quarter of 2026. While this shift exerted upward pressure on the overall deficit, it was partially counterbalanced by a reduction in the deficit on goods.
Detailed Breakdown of International Transactions
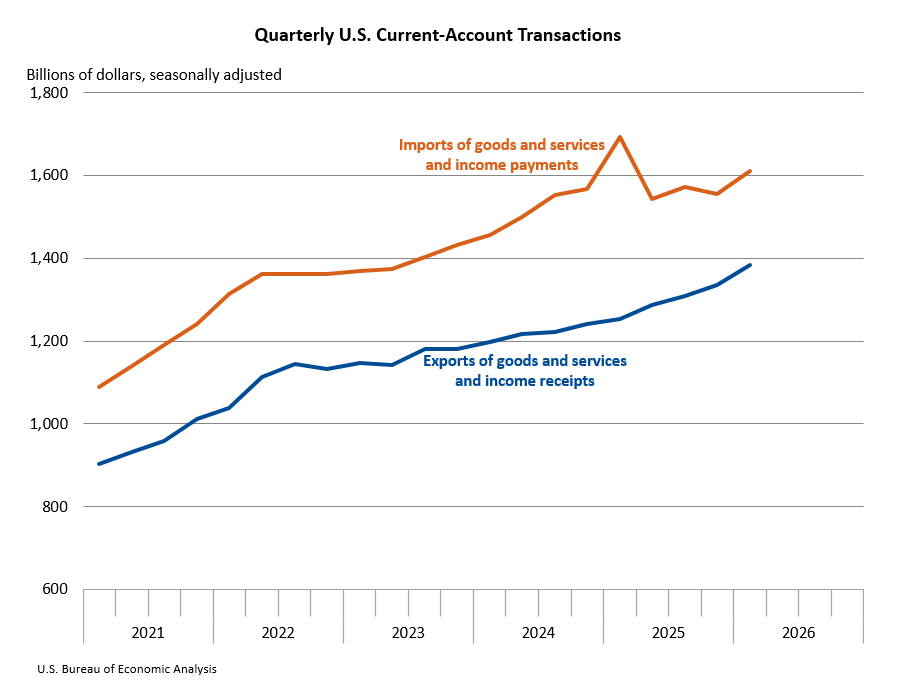
The BEA’s comprehensive data provides a granular view of the forces shaping the U.S. current account. Total exports of goods and services to, and income received from, foreign residents saw a substantial increase of $50.0 billion, bringing the aggregate to $1.38 trillion in the first quarter. This robust growth in exports was primarily fueled by an increase in goods exports, a positive development that signals continued demand for American products on the global stage. However, this positive momentum was somewhat dampened by a decrease in primary (earned) income receipts from abroad.
Conversely, imports of goods and services from, and income paid to, foreign residents experienced an even larger increase of $55.8 billion, reaching $1.61 trillion. This surge in imports reflects a dual impact: a rise in the import of goods, indicating robust domestic demand for foreign-made products, and a notable increase in primary (earned) income payments to foreign residents. The interplay between these import and export dynamics directly contributed to the widening trade deficit component of the current account.
Shifting Income Balances: A Key Factor
The reversal in the primary income balance from a surplus to a deficit is a critical element in understanding the first-quarter deficit’s expansion. While specific details on the composition of this shift were not elaborated upon in the release, such movements can be influenced by various factors, including changes in foreign direct investment income, portfolio investment income, and employee compensation. A decrease in income earned by U.S. residents from their overseas investments, or an increase in income paid to foreign investors on their U.S. holdings, would contribute to this unfavorable swing. For instance, a decline in profits reported by U.S. multinational corporations operating abroad, or a rise in dividend payments to foreign shareholders in U.S. companies, could be contributing factors.
Capital Transfers and Their Limited Impact
In addition to the current account, the BEA also tracks capital transfers. In the first quarter of 2026, capital-transfer receipts saw a significant increase of $3.3 billion, reaching $3.4 billion. This rise suggests an influx of capital related to non-repayable transactions, such as inheritances or gifts. Concurrently, capital-transfer payments decreased by $0.9 billion, settling at $2.0 billion. While these movements are noted, their overall impact on the current-account balance is generally less pronounced compared to trade and income flows.
Financial Account Dynamics: Net Borrowing from Abroad
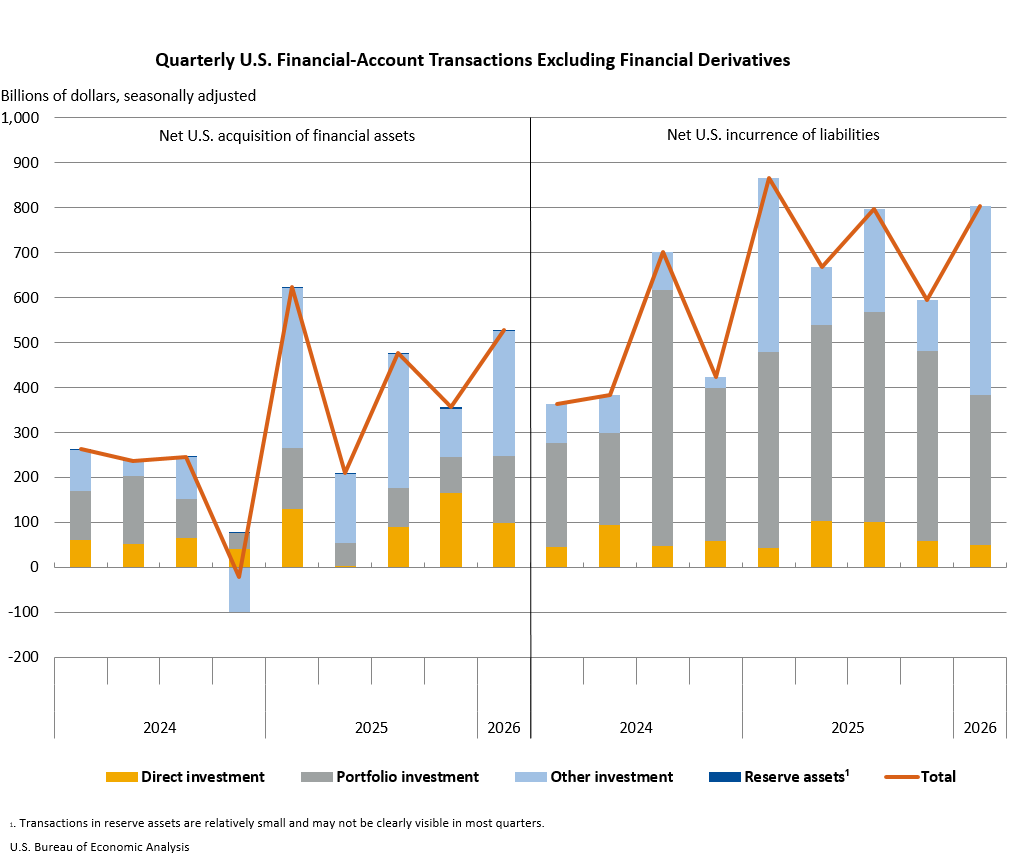
The financial account, which records transactions in financial assets and liabilities, provides further context to the U.S. international economic position. In the first quarter of 2026, net financial-account transactions registered at -$209.0 billion. This figure signifies net U.S. borrowing from foreign residents, meaning that foreign entities acquired more U.S. financial assets or reduced their U.S. liabilities by a greater amount than U.S. residents did in foreign financial assets or liabilities.
During the quarter, U.S. residents’ foreign financial assets increased by $527.3 billion, indicating an expansion of U.S. investments abroad. Simultaneously, U.S. liabilities to foreign residents surged by $803.7 billion. The net result of these movements is a substantial net outflow of capital, reinforcing the picture of the U.S. economy drawing on foreign savings. It is important to note that a typo in the original release identified net financial transactions as $209.0 billion without a negative sign. This error, which has since been corrected, affected only this single number and did not appear in the BEA’s interactive data applications.
U.S. Net International Investment Position: A Deepening Net Liability
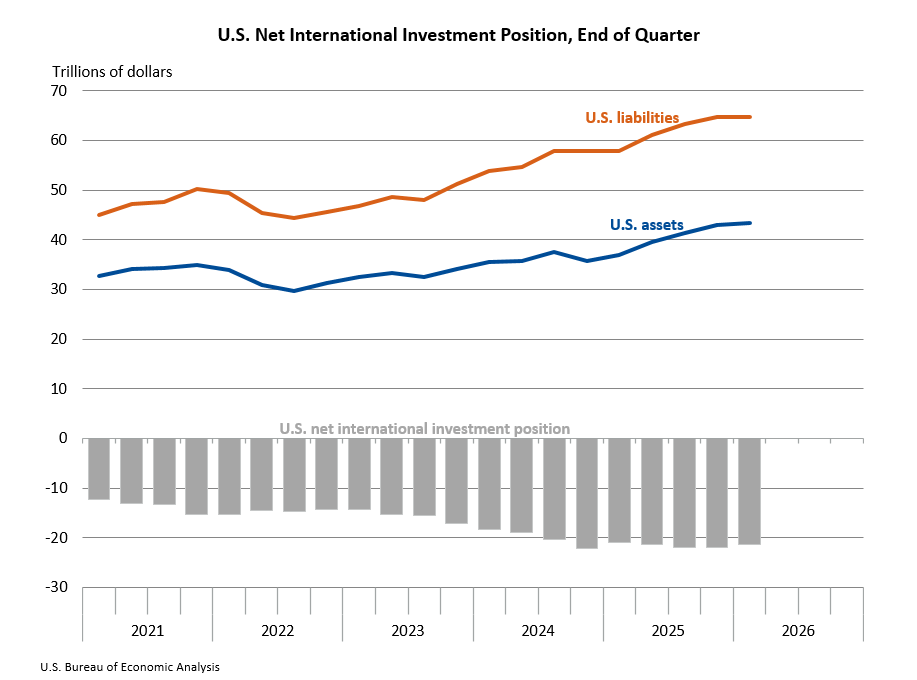
The cumulative effect of these ongoing international transactions is reflected in the U.S. net international investment position (NIIP), which represents the difference between U.S. residents’ foreign financial assets and liabilities. At the end of the first quarter of 2026, the U.S. NIIP stood at a net liability of -$21.27 trillion. This signifies that U.S. liabilities to foreign residents exceeded U.S. assets abroad by this substantial margin.
Breaking down this position, U.S. assets held abroad totaled $43.37 trillion, while U.S. liabilities to foreign residents amounted to $64.64 trillion. These figures represent significant stockpiles of international claims and obligations. For comparative context, the revised NIIP at the end of the fourth quarter of 2025 was -$21.87 trillion, indicating a slight improvement in the net liability position during the first quarter, despite the widening current-account deficit.
Fluctuations in Assets and Liabilities
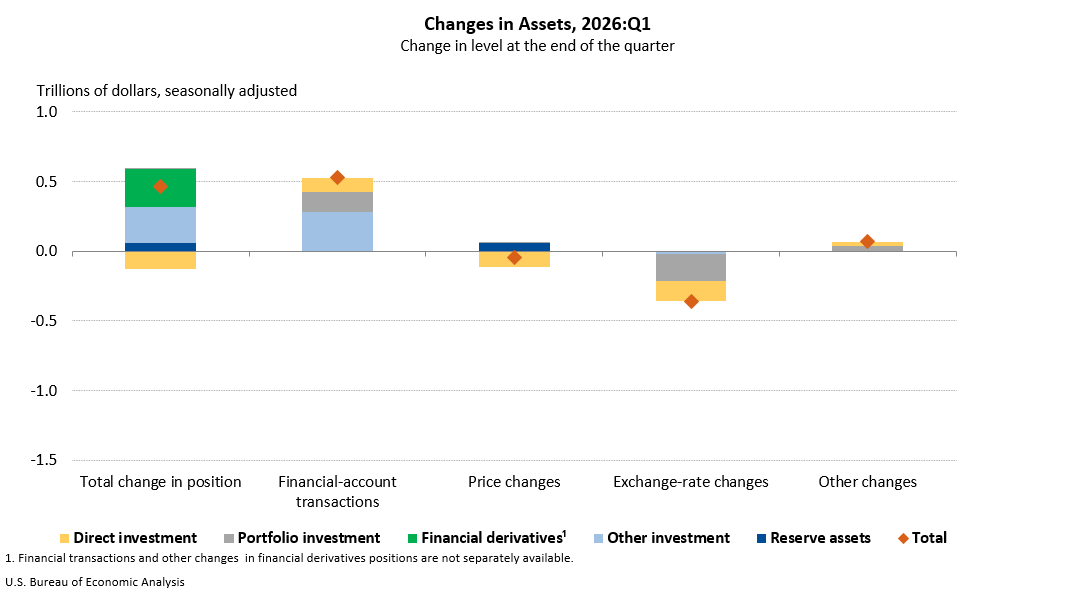
The changes in U.S. assets and liabilities during the first quarter were influenced by both financial transactions and valuation adjustments. U.S. assets abroad increased by $462.9 billion. This growth was driven by increases across most major investment categories, with the exception of direct investment. Financial transactions contributed $527.3 billion to this increase, but this was partially offset by exchange-rate changes, which resulted in a negative valuation adjustment of -$357.1 billion. This highlights the impact of currency fluctuations on the reported value of international holdings.
U.S. liabilities to foreign residents, conversely, decreased by $140.4 billion in the first quarter. This decline was primarily attributed to a reduction in portfolio investment, although this was partly counteracted by increases in other major investment categories. The overall decrease in liabilities was largely driven by substantial price changes, resulting in a negative valuation adjustment of -$1.18 trillion. This significant downward adjustment in the value of foreign-held U.S. assets suggests that market valuations of U.S. securities and other financial instruments held by foreigners experienced a considerable decline during the quarter, even as new financial inflows occurred.
Annual Updates and Data Revisions
The statistics released today are part of the annual updates to the U.S. International Transactions Accounts (ITAs) and the International Investment Position (IIP) Accounts. These updates are crucial for incorporating newly available and revised source data, ensuring the accuracy and comprehensiveness of the U.S. economic statistics. The BEA conducts these annual revisions to reflect changes in methodologies, incorporate updated survey data, and improve the measurement of international economic activity.
For the fourth quarter of 2025, significant revisions were made to preliminary estimates. The current-account balance was revised downward from a preliminary estimate of -$190.7 billion to a revised -$221.1 billion. This revision was driven by a widening of the goods balance (from -$241.5 billion to -$259.4 billion) and a decrease in the primary income balance (from $23.9 billion to $3.4 billion). The net financial-account transactions for the fourth quarter also saw a substantial revision, moving from a preliminary -$135.9 billion to a revised -$248.7 billion, reflecting significant adjustments in the flow of financial capital.
The U.S. net international investment position also underwent notable revisions for the fourth quarter of 2025. The preliminary estimate of -$27.54 trillion was revised to -$21.87 trillion. This substantial upward revision suggests that the BEA’s refined data indicated a less negative net international investment position than initially reported, likely due to updated valuations of assets and liabilities.
Source Data Enhancements
The annual updates incorporate a wide array of newly available and revised source data from various government agencies. The BEA itself provided updated data from its benchmark and quarterly insurance services surveys (2019-2025), quarterly international services surveys (2023-2025), and benchmark, annual, and quarterly direct investment surveys (2022-2025). The U.S. Census Bureau contributed revised source data for Census-basis goods (2023-2025). Additionally, the U.S. Department of the Treasury provided updated annual portfolio investment surveys (2024-2025) and quarterly and monthly portfolio and other investment surveys (2023-2025). These comprehensive data integrations are vital for maintaining the integrity of the U.S. international economic accounts.
Broader Implications and Future Outlook
The widening U.S. current-account deficit, driven by a deteriorating primary income balance and an increasing deficit in goods, signals a persistent reliance on foreign capital. While the U.S. economy has historically been able to finance such deficits, sustained imbalances can lead to increased foreign ownership of U.S. assets and potentially create vulnerabilities in periods of global financial stress.
The shift in the primary income balance warrants continued monitoring. If this trend persists, it could indicate structural changes in the profitability of U.S. foreign direct investments or a growing cost of servicing foreign investment in the U.S. For businesses operating internationally, understanding these shifts is crucial for strategic planning and risk management.
The BEA’s commitment to annual updates and data revisions underscores the dynamic nature of international economic reporting. These revisions are essential for providing policymakers, businesses, and the public with the most accurate and up-to-date information to understand the complex tapestry of U.S. international economic engagement. The next release, scheduled for September 24, 2026, will provide the second-quarter 2026 statistics and further illuminate the trajectory of the U.S. current account and investment position.
The BEA’s ongoing efforts to enhance data availability through methods like coarsening, which involves rounding, aggregation, and the use of ranges, aim to balance the need for confidentiality with the goal of publishing more comprehensive data. This approach helps maintain the trust of survey respondents while providing a richer dataset for economic analysis.
As the U.S. economy navigates the complexities of global trade and finance, the detailed statistics provided by the Bureau of Economic Analysis offer an indispensable lens through which to view its international economic interactions and their evolving dynamics. The first quarter of 2026 has presented a nuanced picture, with a widening current-account deficit largely attributable to shifts in income flows, set against a backdrop of robust, albeit partially offset, export growth and significant valuation adjustments in the international investment position.








