

 Lana Rhoades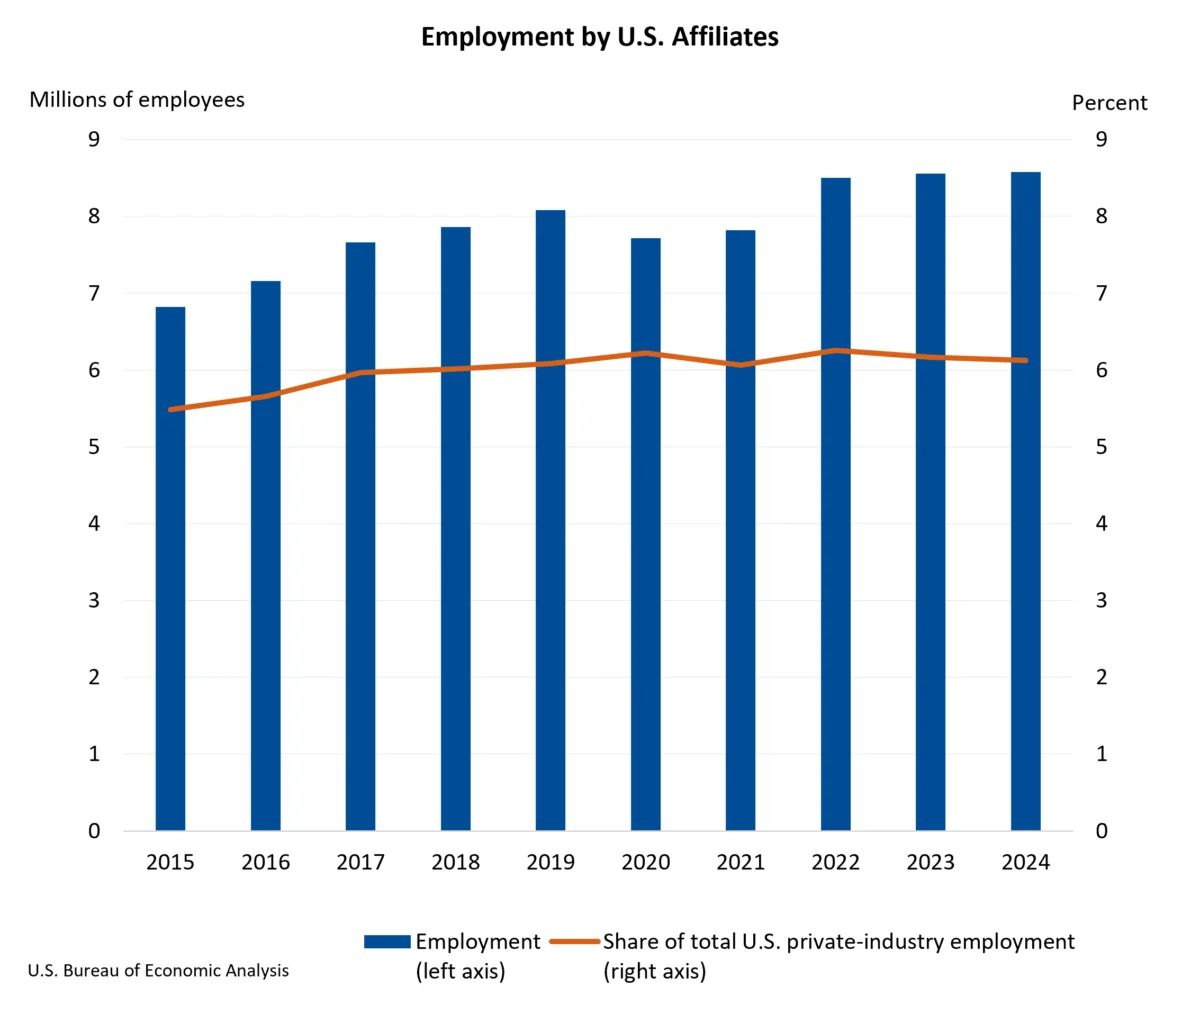
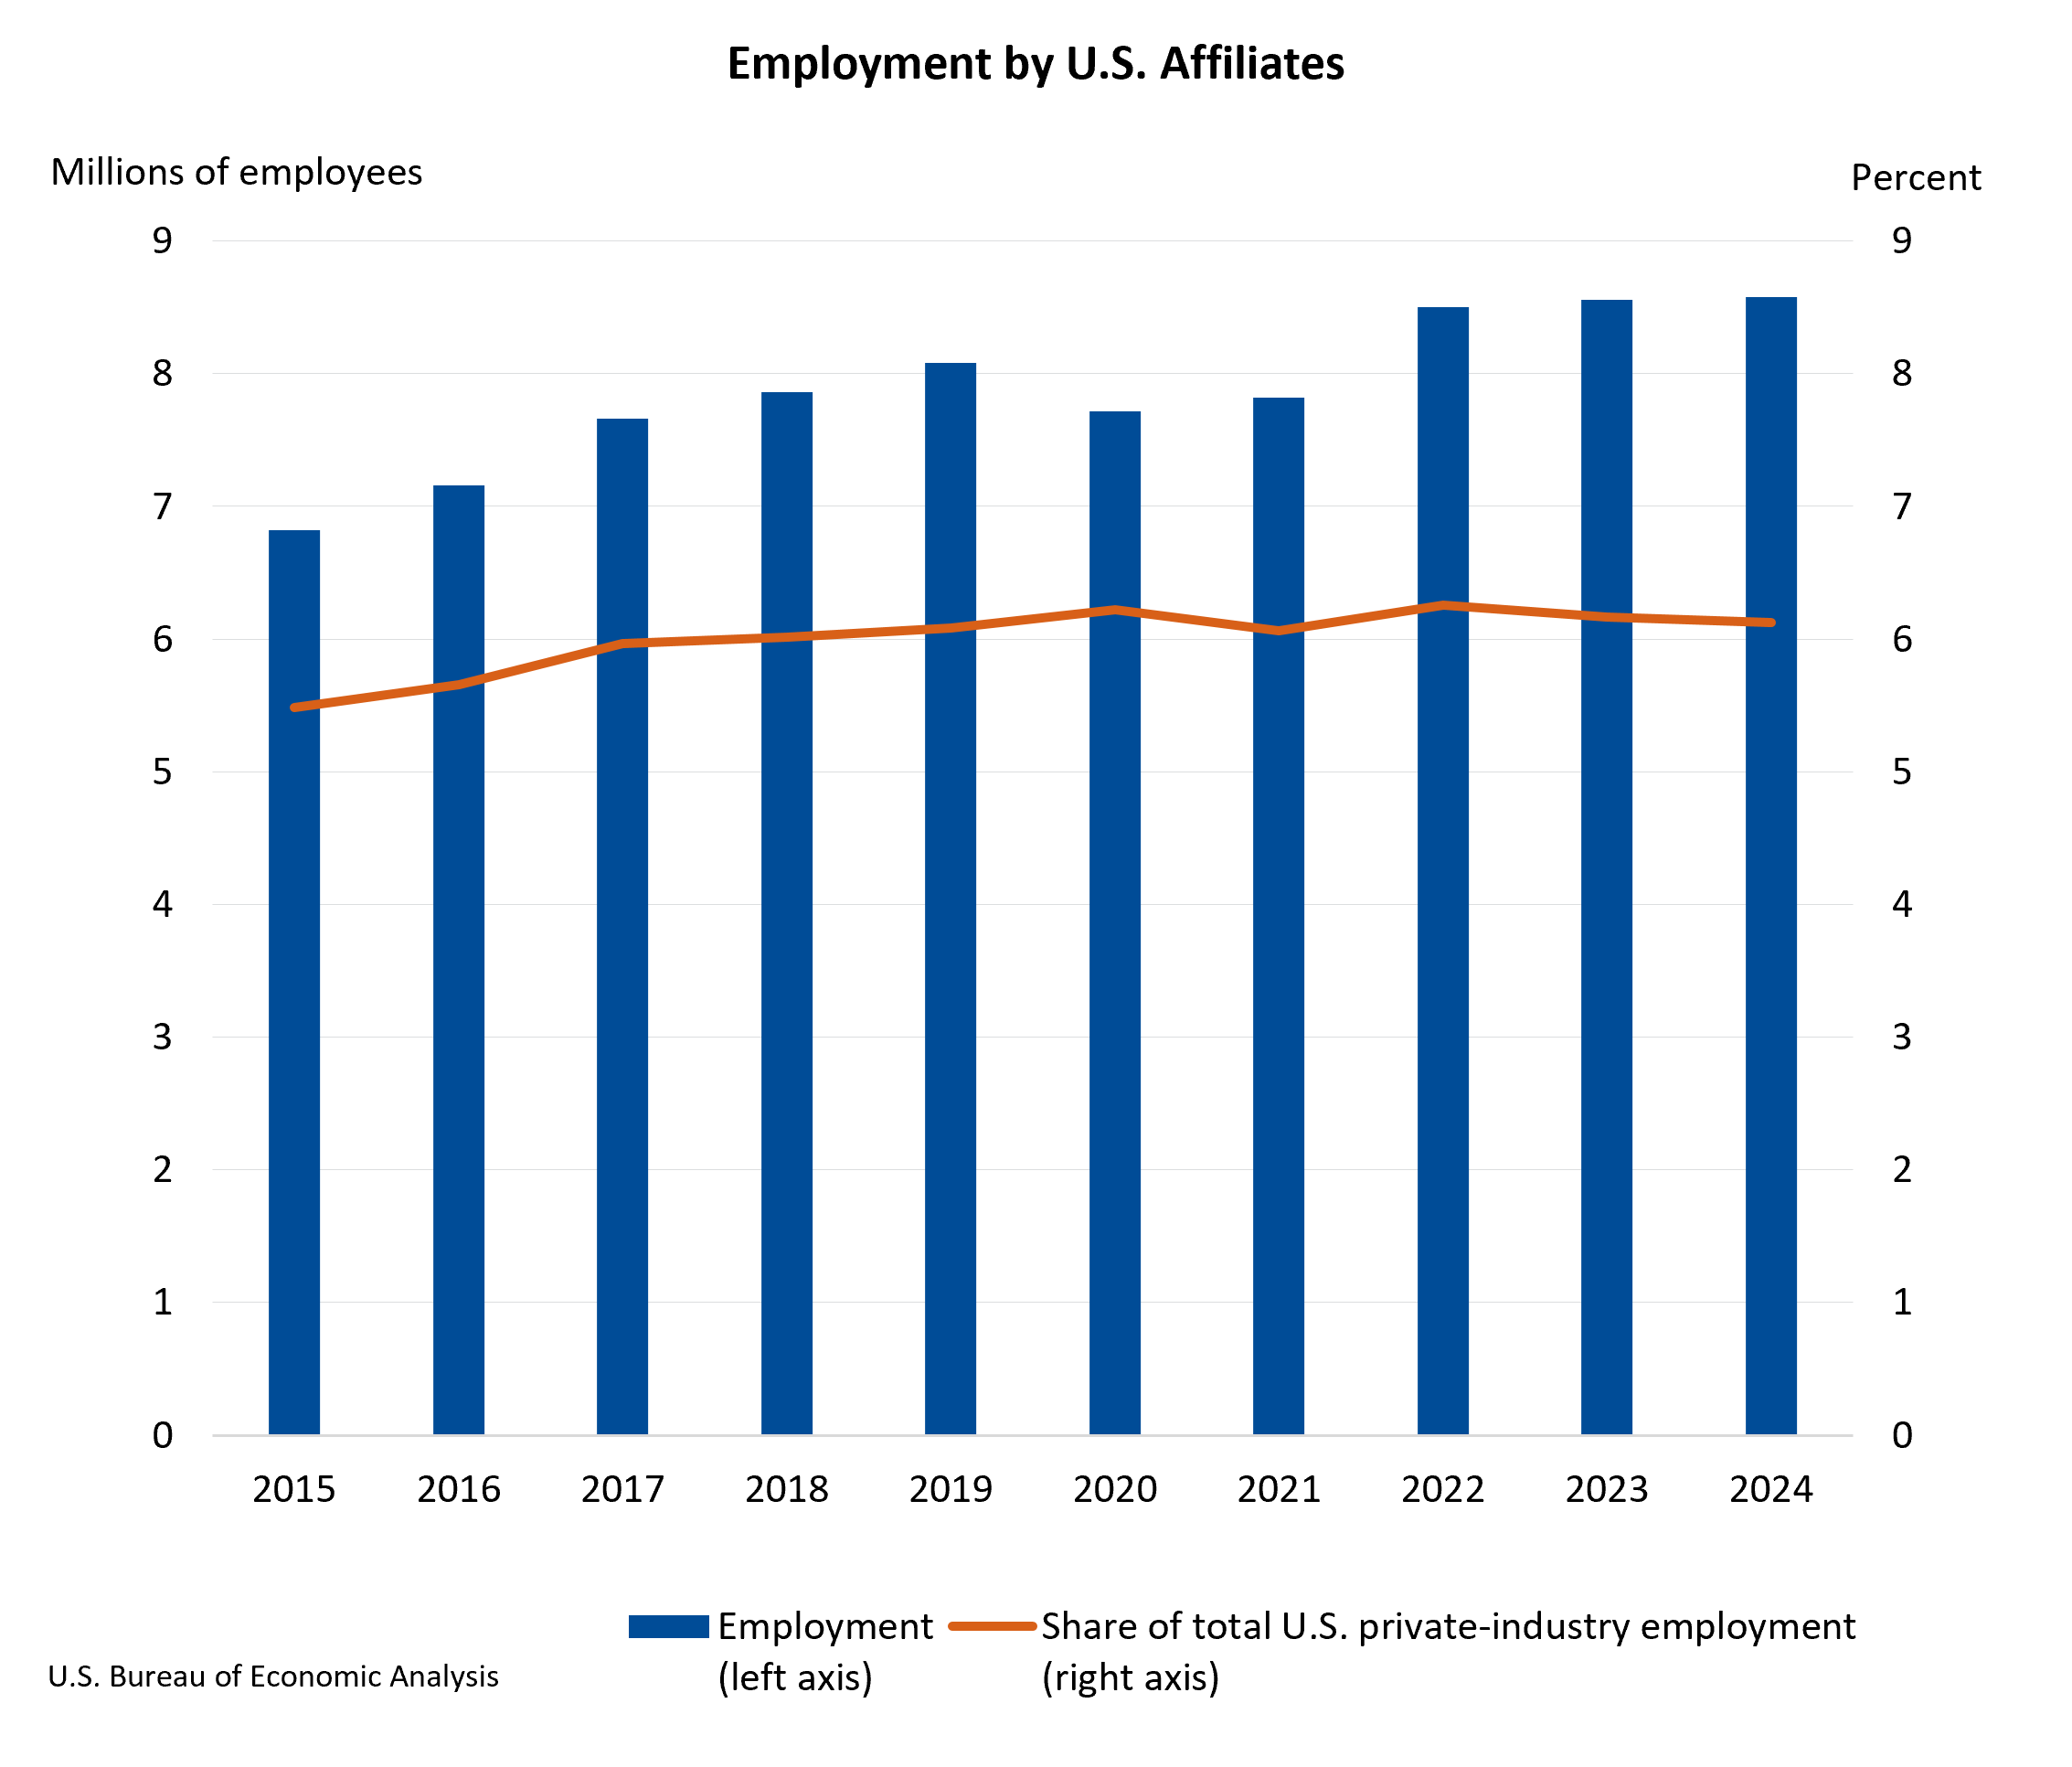
Majority-owned U.S. affiliates of foreign multinational enterprises (MNEs) provided employment for 8.57 million individuals across the United States in 2024. This figure represents a modest increase of 0.2 percent from the 8.56 million workers employed in 2023, according to the latest statistics released by the U.S. Bureau of Economic Analysis (BEA). These U.S. operations of foreign-owned companies continue to be a significant component of the American labor market, underscoring the deep integration of global enterprises within the domestic economy.
While the overall number of jobs saw a slight uptick, the proportion of total private-industry employment attributed to these affiliates slightly declined. In 2024, U.S. affiliates accounted for 6.1 percent of all private-sector jobs, a marginal decrease from 6.2 percent in the preceding year. This indicates that while foreign-owned entities expanded their workforce, the broader U.S. private sector experienced proportionally faster growth in employment during the same period. The manufacturing and retail trade sectors remained the largest employers among these U.S. affiliates, reflecting their substantial presence and investment in these key areas of the American economy. Notably, affiliates with ultimate beneficial owners (UBOs) in the United Kingdom, Japan, and Germany were the most significant contributors to this employment base, highlighting the established and influential roles these nations play in foreign direct investment within the U.S.
The economic contribution of these foreign-owned entities extends beyond employment. The current-dollar value added by U.S. affiliates, a key metric measuring their direct contribution to the nation’s Gross Domestic Product (GDP), saw a more robust increase. In 2024, this figure climbed by 4.3 percent to reach $1.52 trillion. Despite this growth, their share of total U.S. business-sector value added remained largely consistent, representing 6.7 percent in 2024, a slight dip from 6.8 percent in 2023. This suggests that while foreign affiliates are growing their economic output, the overall U.S. business sector is expanding at a comparable or slightly faster pace.
Investment in physical assets by these entities also saw an increase. Expenditures for property, plant, and equipment by U.S. affiliates rose by 3.3 percent, reaching $328.0 billion in 2024. This investment is a crucial indicator of foreign companies’ commitment to expanding their operational capacity and long-term presence in the United States. Furthermore, these affiliates demonstrated a significant commitment to innovation, with research and development (R&D) expenditures increasing by 5.3 percent to $95.5 billion. This substantial investment in R&D means that U.S. affiliates accounted for a considerable 12.4 percent of all U.S. business R&D activities in 2024, signaling their role as drivers of technological advancement and innovation within the country.
Geographically, U.S. affiliate employment is concentrated in key economic hubs. California led the nation with 885,200 jobs provided by these affiliates, followed by Texas with 717,400 jobs, and New York with 556,700 jobs. In each of these leading states, the manufacturing sector was the largest employer among the U.S. affiliates, underscoring its continued importance as a source of foreign-invested employment.
A Look at the Data and Trends
The statistics released by the BEA provide a comprehensive snapshot of the activities of U.S. affiliates of foreign MNEs. Beyond employment and value added, these data also encompass sales, balance sheet and income statement items, compensation of employees, and trade activities. This granular data allows for a deeper understanding of how foreign investment shapes various sectors of the U.S. economy.
For instance, the BEA’s comprehensive data tables offer insights into the specific industries where foreign investment is most prominent. While manufacturing and retail trade are noted as top employment sectors, the detailed breakdowns can reveal which sub-sectors within these industries are most attractive to foreign investors. Similarly, the breakdown of value added by industry can highlight areas where foreign-owned companies are making the most significant contributions to U.S. economic output.
The BEA also provides data on the compensation of employees within these affiliates, offering a glimpse into the wages and benefits offered to American workers employed by foreign-owned companies. This information is vital for understanding the broader impact of foreign investment on labor markets and income distribution.
Historical Context and Evolution of Foreign Investment
The presence of foreign-owned companies in the U.S. economy is not a new phenomenon. For decades, foreign direct investment (FDI) has been a consistent feature, contributing to job creation, technological transfer, and economic growth. The BEA’s data series on U.S. affiliates of foreign MNEs allows for the tracking of trends over time, providing a historical perspective on the evolving landscape of global business operations within the United States.
Historically, countries like the United Kingdom, Japan, and Germany have been among the largest sources of FDI into the U.S. This trend appears to be continuing, as indicated by their leading roles in employing workers through their U.S. affiliates. Other significant sources of investment, such as Canada, France, and the Netherlands, also play crucial roles, and their contributions can be further explored through the detailed BEA data.
The BEA’s methodology for collecting and presenting these statistics has also evolved. The recent updates to the disclosure avoidance method, employing techniques like rounding and aggregation, aim to enhance data confidentiality for survey respondents while simultaneously allowing for the publication of more detailed information. This ongoing refinement of data collection and dissemination ensures the continued relevance and utility of the BEA’s statistics for policymakers, researchers, and the public.
Revisions and Data Updates
The BEA’s commitment to accuracy is reflected in its regular revisions of previously released data. The statistics for 2023 have undergone significant revision to incorporate newly available and updated source data. Preliminary estimates for 2023, initially released in December 2025, have been refined. For example, the number of employees in 2023 was initially estimated at 8,661.8 thousand, but the revised estimate stands at 8,556.9 thousand, indicating a slight downward adjustment after further data collection.
Value added for 2023 was also revised from a preliminary estimate of $1,469.1 billion to a revised $1,456.3 billion. Similarly, expenditures for property, plant, and equipment saw a revision from $322.7 billion to $317.6 billion. Research and development expenditures, however, saw an upward revision from a preliminary $87.8 billion to $90.6 billion, highlighting the dynamic nature of these economic indicators and the importance of revised data for accurate analysis. These revisions underscore the BEA’s rigorous process of data validation and its dedication to providing the most precise economic intelligence.
Broader Economic Implications and Analysis
The data on U.S. affiliates of foreign MNEs offers crucial insights into the interconnectedness of the global economy and its impact on the United States. The continued growth in employment and value added signifies that foreign investment remains a vital engine for U.S. economic activity. The substantial investment in R&D, in particular, points to the role of foreign firms in fostering innovation and maintaining U.S. competitiveness in a globalized technological landscape.
However, the slight decline in the share of total private-industry employment and business-sector value added attributed to these affiliates warrants attention. This could be a reflection of robust growth in domestically owned businesses or a potential indication of shifting investment patterns. A more in-depth analysis of specific industry trends and the competitive landscape would be necessary to draw definitive conclusions.
The concentration of employment in states like California, Texas, and New York highlights the importance of these regions as magnets for foreign investment. Understanding the factors that attract and sustain this investment in specific geographic areas can inform regional economic development strategies and policy initiatives aimed at maximizing the benefits of FDI.
The BEA’s ongoing efforts to provide detailed and up-to-date statistics are invaluable. The comprehensive data tables and interactive applications allow for detailed exploration of various facets of foreign MNE activity in the U.S. This transparency is essential for informed decision-making by businesses, policymakers, and researchers alike. As the global economic environment continues to evolve, the BEA’s role in quantifying and analyzing the impact of foreign investment will remain critically important. The next release, focusing on 2025 activities, is anticipated in Spring 2027 and will provide further insights into the ongoing trajectory of foreign MNE operations within the United States.








