Lana Rhoades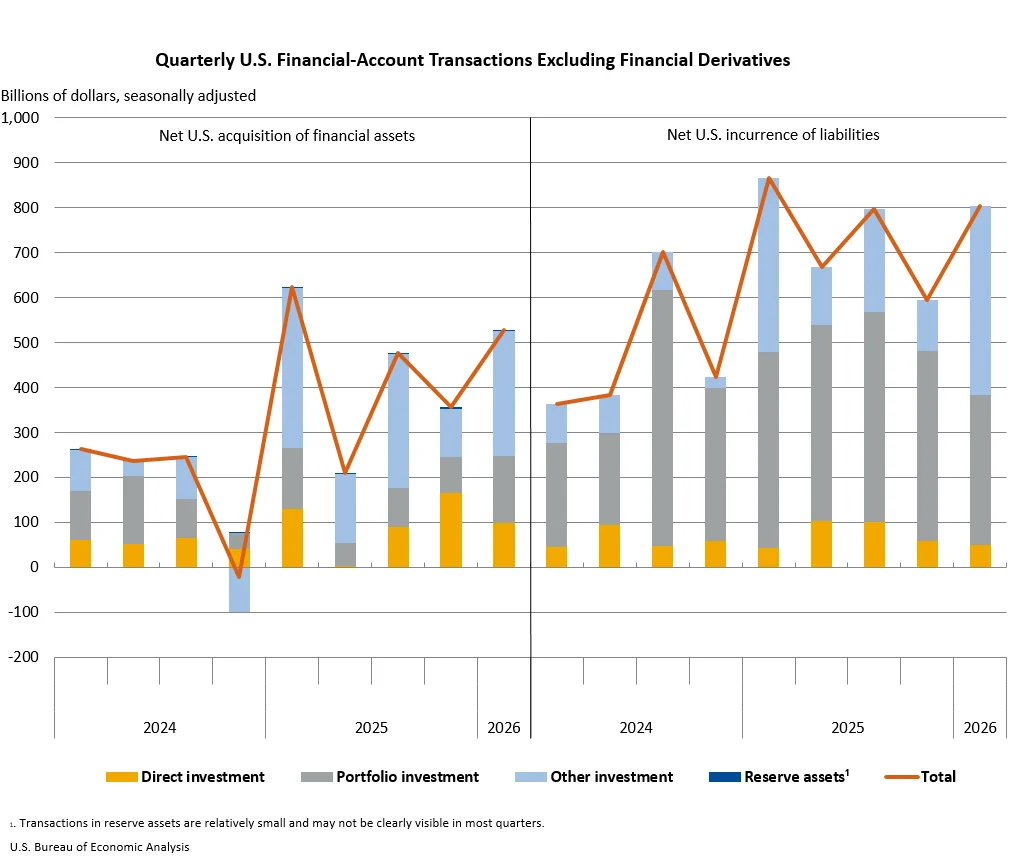
The U.S. current-account deficit expanded by $5.8 billion, or 2.6 percent, to $226.8 billion in the first quarter of 2026, according to revised statistics released by the U.S. Bureau of Economic Analysis (BEA). This marks an acceleration from the revised fourth-quarter deficit of $221.1 billion, indicating a widening gap in the nation’s international economic transactions. The deficit’s share of current-dollar gross domestic product (GDP) also saw a marginal increase, climbing to 2.9 percent from 2.8 percent in the preceding quarter. This widening is primarily attributed to a significant shift in the balance on primary income, which moved from a surplus in the fourth quarter of 2025 to a deficit in the first quarter of 2026. This swing was partially mitigated by a reduction in the deficit on goods trade.
Key Drivers of the Widening Deficit
The intricate web of international economic transactions that comprise the current account reveals a complex interplay of factors driving this recent expansion. The most impactful element was the reversal in the primary income balance. Primary income, which includes earnings from foreign investments (dividends, interest, and reinvested earnings) and compensation of employees, swung from a surplus of $3.4 billion in the fourth quarter of 2025 to a deficit of approximately $15.2 billion in the first quarter of 2026, a total swing of nearly $18.6 billion. This significant shift underscores a growing outflow of income earned by foreign entities from their investments and operations within the United States, or a decrease in income earned by U.S. residents from their foreign holdings.
While the primary income balance experienced a notable downturn, the goods balance provided a partial counterbalance. The deficit on goods narrowed by $18.2 billion, falling from $259.4 billion in the revised fourth quarter of 2025 to $241.2 billion in the first quarter of 2026. This improvement in the goods trade balance suggests an increase in the value of U.S. exports of physical goods or a decrease in the value of U.S. imports of goods, or a combination of both.
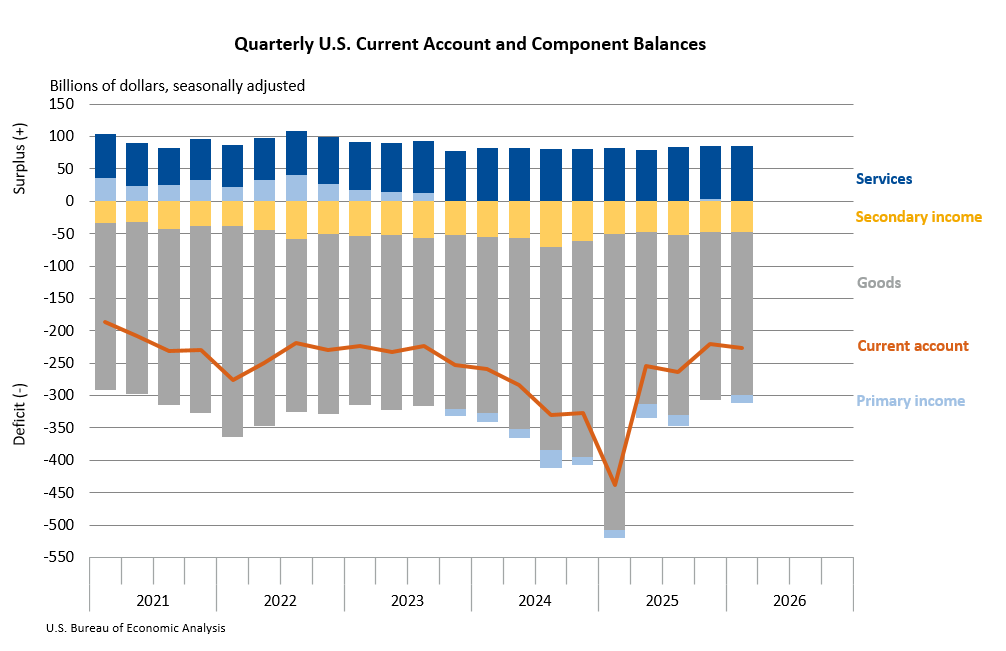
The services balance, a generally stable component of the current account, saw a modest increase in its surplus, rising from $82.1 billion in the fourth quarter of 2025 to $82.5 billion in the first quarter of 2026. This slight uptick reflects continued strong performance in U.S. service exports, such as travel, transportation, and financial services, which outpaced the growth in imported services.
Secondary income, encompassing transfers such as government grants, remittances, and pensions, also contributed to the widening deficit, though to a lesser extent. The deficit in secondary income widened from $47.2 billion in the fourth quarter of 2025 to $48.6 billion in the first quarter of 2026.
Trade and Income Flows: A Deeper Dive
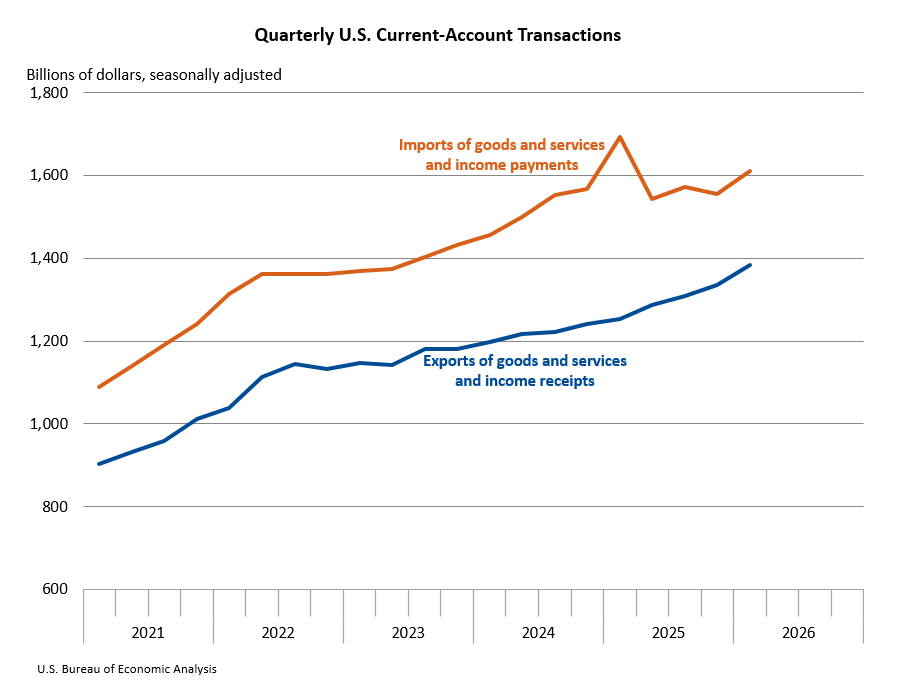
The BEA’s detailed breakdown of international transactions reveals that total exports of goods and services, along with income received from foreign residents, increased by $50.0 billion to $1.38 trillion in the first quarter of 2026. This robust growth in outflows was primarily propelled by a surge in goods exports, which likely benefited from increased global demand or favorable exchange rates for U.S. products. However, this positive momentum was partially tempered by a decrease in primary income receipts from abroad, signaling a potential slowdown in earnings from U.S. investments overseas or a reduction in income earned by U.S. workers abroad.
Conversely, imports of goods and services, and income paid to foreign residents, saw a more substantial increase of $55.8 billion, reaching $1.61 trillion. This amplified growth in imports was driven by heightened demand for imported goods and a notable rise in primary income payments to foreign residents. The increase in income payments directly correlates with the deterioration of the primary income balance, highlighting the significant impact of these outflows on the overall current-account deficit.
Financial Account Dynamics and Net Investment Position
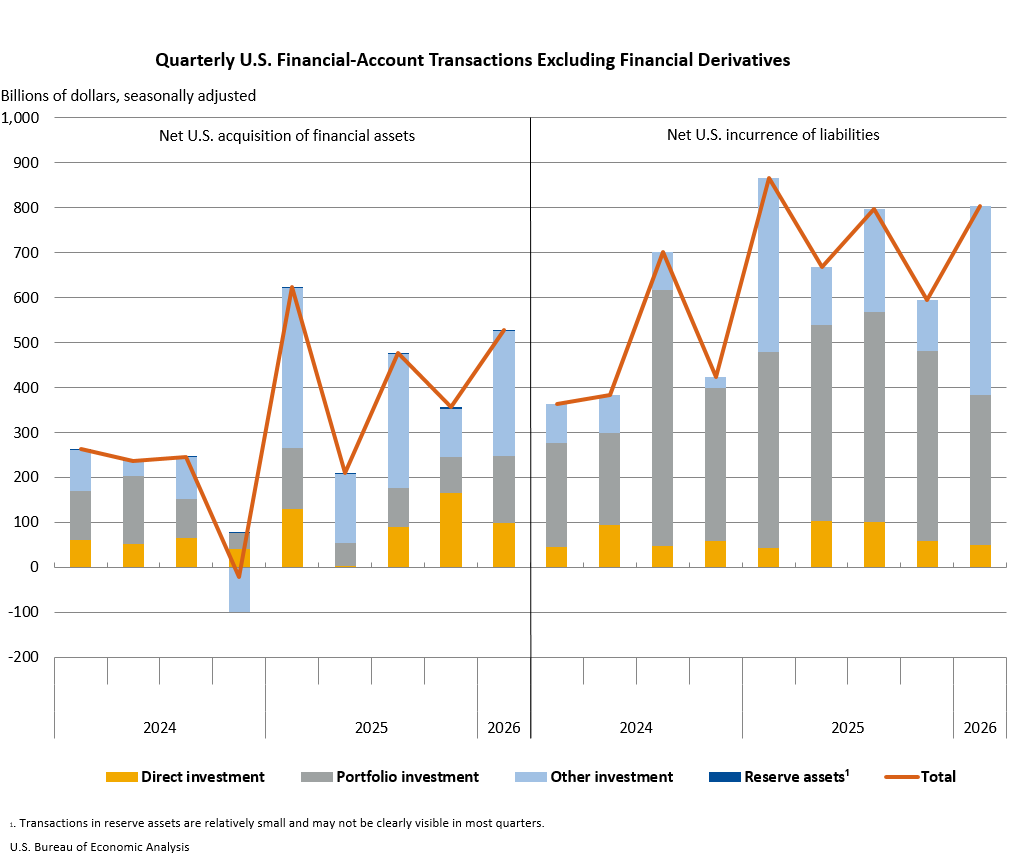
Complementing the current account, the U.S. financial account provides insights into the flow of financial assets and liabilities. In the first quarter of 2026, net financial-account transactions registered a deficit of $209.0 billion. This figure reflects net U.S. borrowing from foreign residents, indicating that foreign entities were net lenders to the U.S. economy. Specifically, U.S. residents increased their foreign financial assets by $527.3 billion, while simultaneously increasing their liabilities to foreign residents by $803.7 billion. The discrepancy between asset acquisitions and liability incurrences signifies a net outflow of financial capital from the U.S.
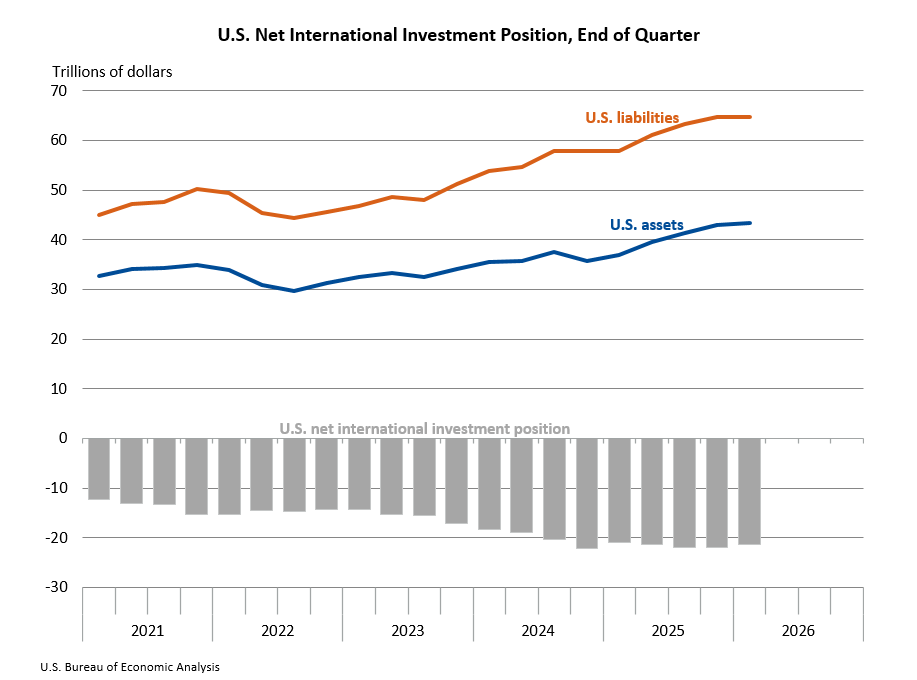
The cumulative effect of these ongoing transactions shapes the U.S. net international investment position (NIIP), which represents the difference between U.S. residents’ foreign financial assets and liabilities. At the end of the first quarter of 2026, the U.S. NIIP stood at a deficit of $21.27 trillion. This represents a slight improvement from the revised fourth-quarter 2025 position of -$21.87 trillion. U.S. assets abroad totaled $43.37 trillion, while U.S. liabilities to foreign residents reached $64.64 trillion.
Changes in U.S. assets during the first quarter were substantial, increasing by $462.9 billion. This growth was broad-based across most major investment categories, with the exception of direct investment. Financial transactions contributed positively to asset growth, adding $527.3 billion. However, this was partially offset by a significant negative impact from exchange-rate changes, which reduced asset values by $357.1 billion.
In contrast, U.S. liabilities saw a decrease of $140.4 billion in the first quarter. This decline was primarily driven by a reduction in portfolio investment, although this was partially counteracted by increases in other major investment categories. The overall decrease in liabilities was heavily influenced by price changes, which resulted in a substantial negative adjustment of $1.18 trillion. This large negative price impact suggests that the value of foreign-held U.S. assets decreased due to market fluctuations, even as new financial inflows occurred.
Annual Updates and Data Revisions
The statistics released today are part of the annual updates to the U.S. International Transactions Accounts (ITAs) and the International Investment Position (IIP) Accounts. These comprehensive updates involve incorporating a wealth of newly available and revised source data from various government agencies, leading to significant revisions of historical data.
Key providers of this data include the BEA itself, which contributes benchmark and quarterly insurance services surveys, quarterly international services surveys, and benchmark, annual, and quarterly direct investment surveys. The U.S. Census Bureau provides revised source data for Census-basis goods, and the U.S. Department of the Treasury offers annual, quarterly, and monthly portfolio and other investment surveys. These revisions, which begin with statistics for 1999, ensure that the U.S. international economic accounts reflect the most accurate and up-to-date picture of the nation’s economic interactions with the rest of the world.
The annual updates also involve recalculations of seasonal and trading-day adjustments, further refining the accuracy of the reported figures. The BEA has provided a preview of these updates in the Survey of Current Business, with further details anticipated in the July 2026 issue. The U.S. International Economic Accounts: Concepts and Methods publication will also be updated in September 2026 to reflect these changes.
Broader Implications and Future Outlook
The widening current-account deficit, while a concern for some economists, is a complex phenomenon influenced by various global economic forces. The shift in the primary income balance warrants close observation, as sustained outflows in this category could indicate a structural change in the profitability of foreign investments in the U.S. or a decline in U.S. investment income.
The robust growth in both goods exports and imports suggests continued engagement in global trade, albeit with a persistent deficit in goods. The strength of U.S. services exports remains a positive indicator, highlighting the nation’s competitive edge in areas like technology, finance, and intellectual property.
The net financial-account deficit indicates that the U.S. continues to attract foreign capital, which is crucial for financing domestic investment and economic growth. However, the increasing liabilities to foreign residents also signify a growing reliance on foreign funding.
BEA’s commitment to updating its disclosure avoidance methods to include coarsening, such as rounding, aggregation, and the use of ranges, is aimed at enhancing data publication while maintaining respondent confidentiality. This approach allows for the release of more granular data, benefiting researchers and policymakers.
The next release of U.S. International Transactions and Investment Position statistics, covering the second quarter of 2026, is scheduled for September 24, 2026. These upcoming figures will provide further insights into the evolving U.S. economic relationship with the rest of the world and will supersede the data presented in this release. The historical data featured in this report will remain accessible in BEA’s Data Archive. The ongoing adjustments and revisions underscore the dynamic nature of international economic accounting and the continuous effort to provide the most accurate representation of global economic flows.