Lana Rhoades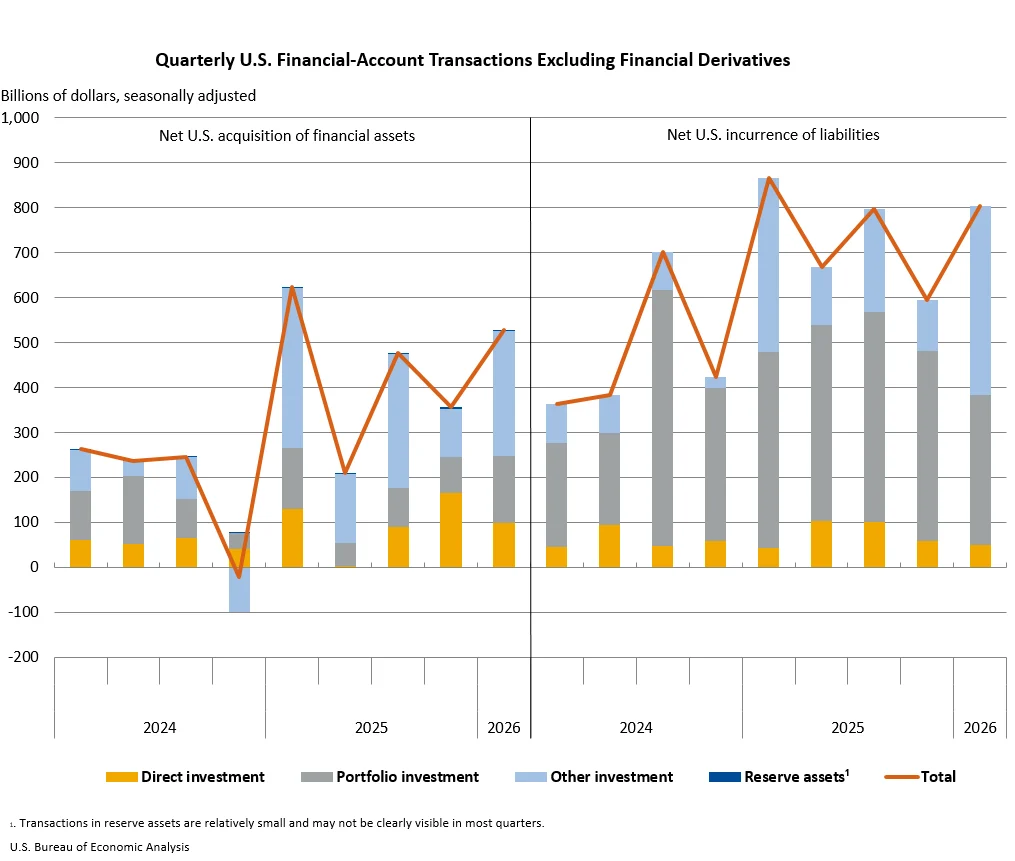
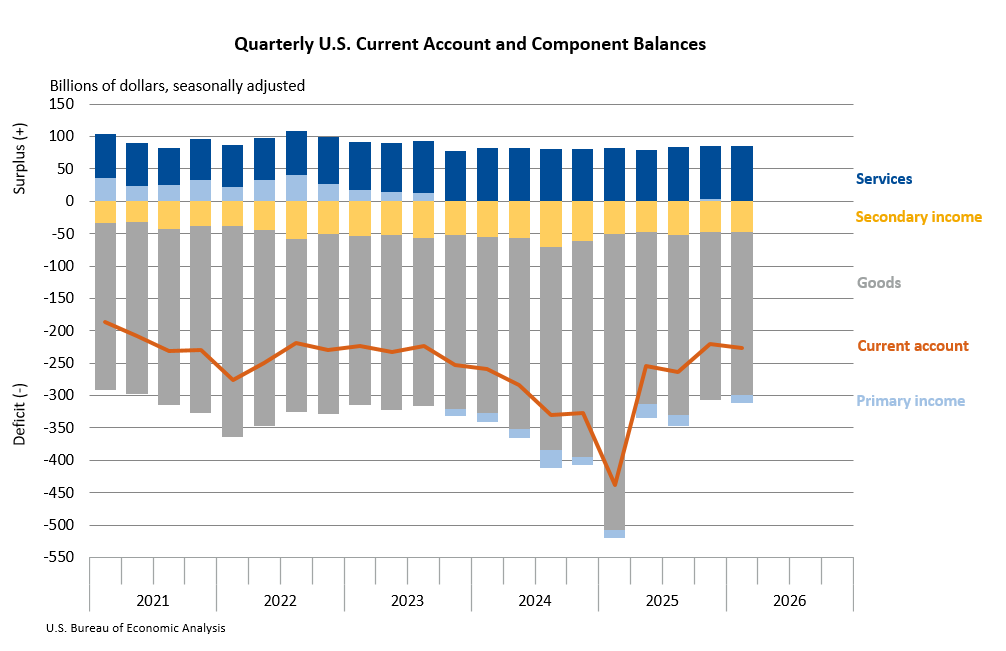
The U.S. current-account deficit, a key measure of a nation’s international economic transactions, expanded by $5.8 billion, or 2.6 percent, to $226.8 billion in the first quarter of 2026. This widening, as reported by the U.S. Bureau of Economic Analysis (BEA) on June 30, 2026, reflects a significant shift in the balance on primary income from a surplus in the preceding quarter to a deficit, a trend partially counteracted by a decrease in the deficit on goods. The revised deficit for the fourth quarter of 2025 stood at $221.1 billion. This latest figure brings the first-quarter deficit to 2.9 percent of current-dollar gross domestic product (GDP), an increase from the 2.8 percent recorded in the final quarter of 2025, signaling a growing reliance on foreign capital and a more pronounced international economic footprint.
The BEA also issued a correction regarding net financial transactions, clarifying that a typographical error in the initial release had omitted a negative sign from the figure of -$209.0 billion for the first quarter of 2026. This error, which affected only this specific number in the press release, has since been rectified and does not impact the accuracy of other data points, which were correctly presented in the BEA’s Interactive Data Application and Application Programming Interface. The corrected net financial-account transactions for the first quarter indicate a net outflow of capital from the U.S. as it borrowed from foreign residents.
Key Drivers of the Widening Deficit
The primary impetus behind the first-quarter deficit expansion was the deterioration in the primary income balance. Historically, the U.S. has benefited from substantial income receipts from its foreign investments, often resulting in a primary income surplus. However, in the first quarter of 2026, this dynamic shifted, leading to a deficit in this component. This change was partly cushioned by a more favorable balance on goods trade, where the deficit narrowed.
Overall, exports of goods and services to, and income received from, foreign residents saw an increase of $50.0 billion, reaching $1.38 trillion in the first quarter. This rise was predominantly driven by stronger goods exports. However, this positive movement was partially tempered by a decrease in primary (earned) income receipts from abroad. Simultaneously, imports of goods and services from, and income paid to, foreign residents experienced a more substantial increase of $55.8 billion, bringing the total to $1.61 trillion. This surge in imports was attributable to both increased goods imports and higher primary income payments made to foreign entities.
A Deeper Dive into Trade and Income Flows
The international trade landscape in the first quarter of 2026 painted a complex picture. While U.S. businesses exported more goods, indicating potential global demand for American products, the outflow of income payments to foreign investors and creditors outpaced the income generated from U.S. investments abroad. This divergence underscores the intricate nature of international economic relationships, where trade balances and income flows often interact in multifaceted ways.
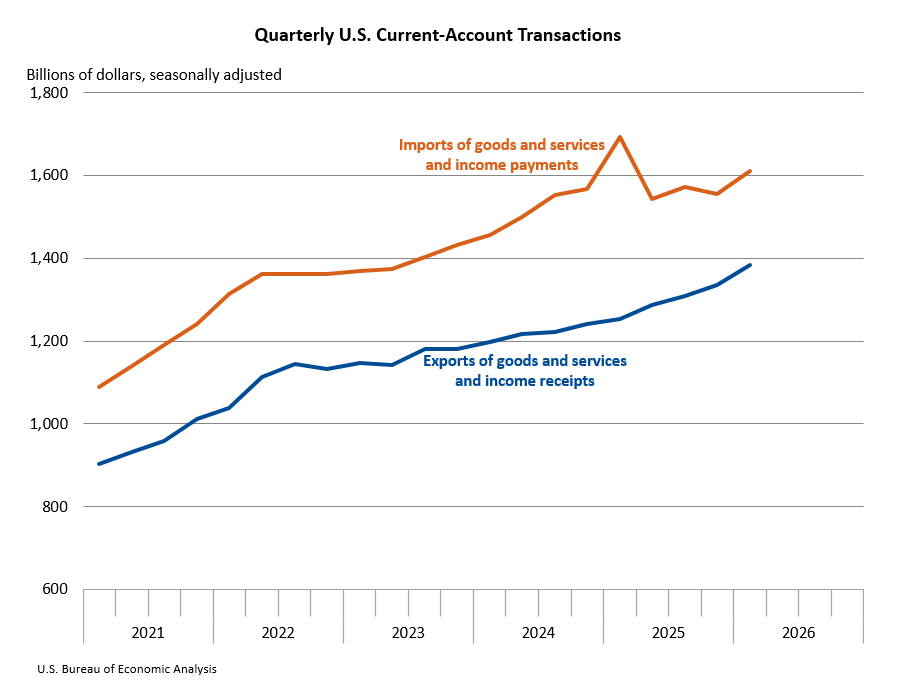
The BEA’s detailed breakdown reveals that the goods balance, a significant component of the current account, experienced a reduction in its deficit. This suggests an improvement in the U.S. trade balance for physical goods. However, the positive impact of this improvement was more than offset by the shift in the primary income balance. The services balance, which has typically been a source of surplus for the U.S., continued to contribute positively, though its impact on the overall current account was not sufficient to counteract the negative pressures from income flows and the goods balance.
Capital Transfers and Financial Account Transactions
Beyond trade and income, capital transfer receipts saw a notable increase of $3.3 billion, reaching $3.4 billion in the first quarter. Conversely, capital transfer payments decreased by $0.9 billion to $2.0 billion. These transfers, while smaller in magnitude compared to trade and income flows, represent international movements of assets without a direct quid pro quo and can influence the overall balance of payments.
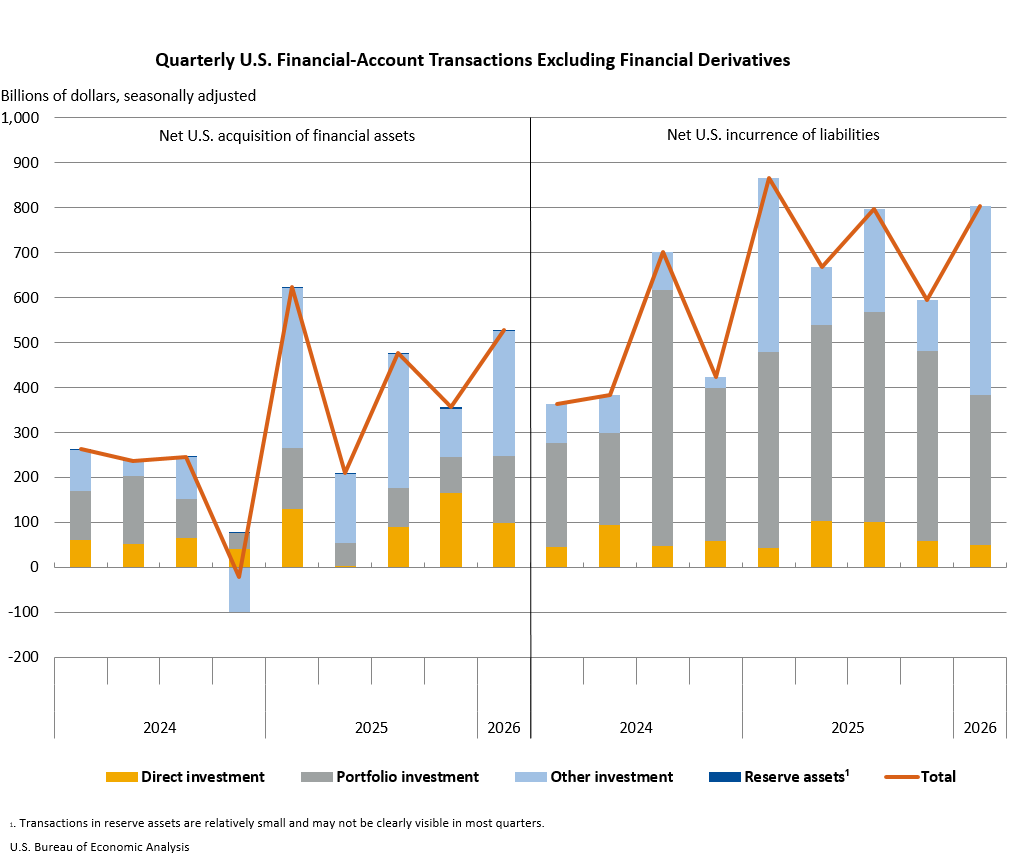
The net financial-account transactions for the first quarter were recorded at -$209.0 billion. This figure signifies that the U.S. incurred more liabilities to foreign residents than it acquired in foreign financial assets. Specifically, U.S. residents’ foreign financial assets increased by $527.3 billion, while liabilities to foreign residents grew by a larger $803.7 billion. This net borrowing from foreign entities is a crucial element in understanding the financing of the current-account deficit.
The Evolving Net International Investment Position
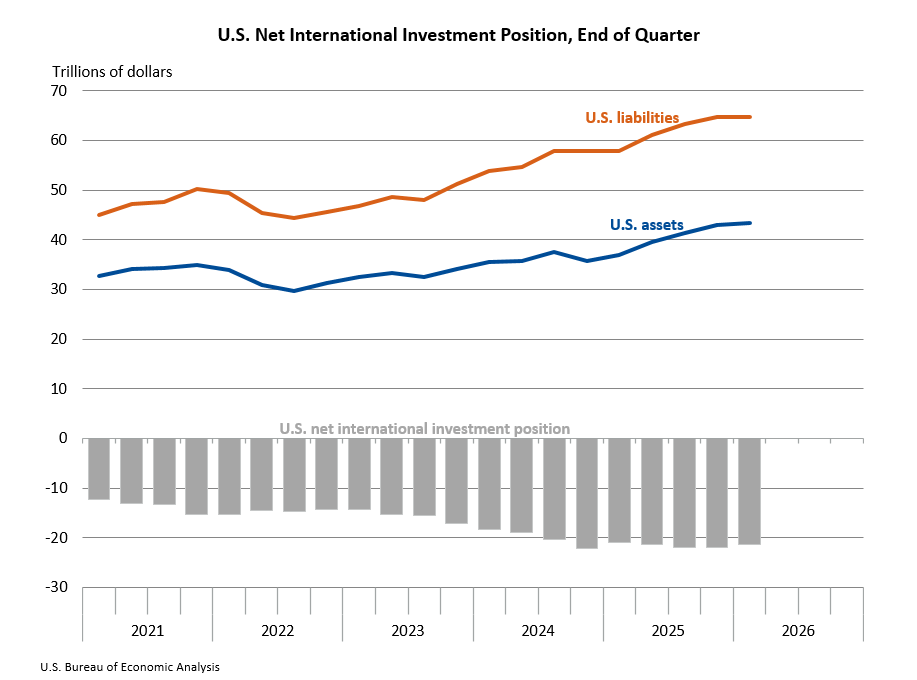
The cumulative impact of these transactions is reflected in the U.S. net international investment position (NIIP), which represents the difference between U.S. residents’ foreign financial assets and liabilities. At the end of the first quarter of 2026, the U.S. NIIP stood at a deficit of -$21.27 trillion. This position has seen significant fluctuations, with preliminary estimates for the end of the fourth quarter of 2025 revised to -$21.87 trillion. At the close of the first quarter of 2026, U.S. assets abroad totaled $43.37 trillion, while U.S. liabilities to foreign residents amounted to $64.64 trillion.
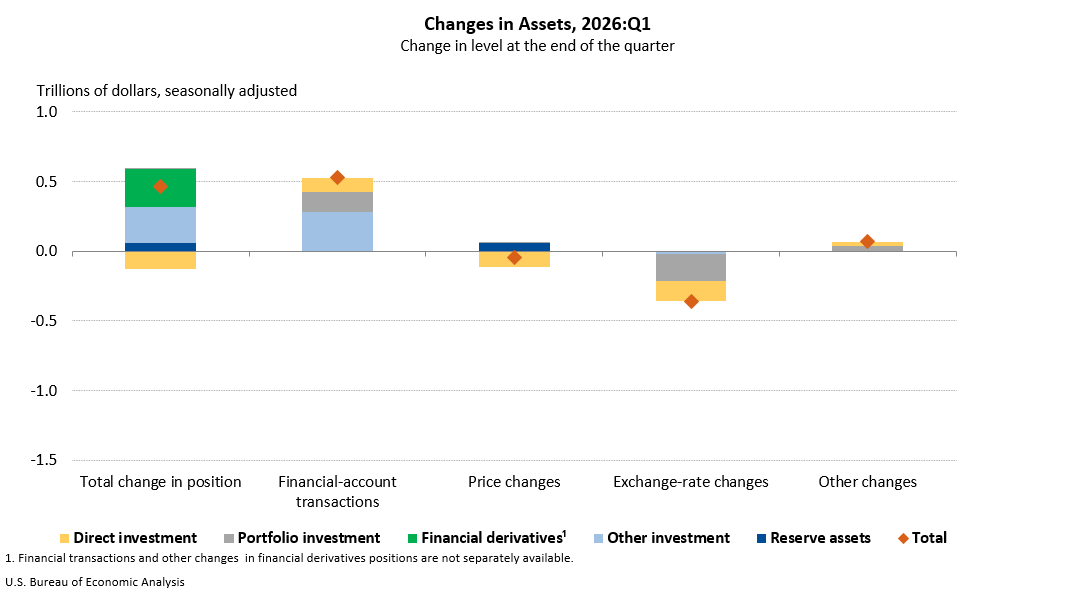
The changes in the NIIP during the first quarter were influenced by both financial transactions and valuation adjustments, such as exchange-rate fluctuations and changes in asset prices. U.S. assets increased by $462.9 billion, driven by growth across most investment categories, with the exception of direct investment. Financial transactions contributed positively to this increase, but this was substantially offset by negative exchange-rate changes totaling -$357.1 billion.
Conversely, U.S. liabilities decreased by $140.4 billion. This reduction was primarily due to a decline in portfolio investment liabilities. While financial transactions added $803.7 billion to liabilities, this was dwarfed by negative price changes, estimated at -$1.18 trillion, which reduced the overall value of U.S. liabilities to foreigners. These valuation effects highlight the sensitivity of the NIIP to global market conditions and currency movements.
Contextualizing the Annual Updates
The statistics released on June 30, 2026, incorporate the annual updates of the U.S. International Transactions Accounts (ITAs) and the International Investment Position (IIP) Accounts. These updates are a critical component of BEA’s statistical production, ensuring that the data reflect the latest available source information and methodological improvements. The BEA systematically revises these accounts to incorporate comprehensive data from various government agencies and private entities, as well as to implement updated statistical methodologies.
The annual updates typically involve the incorporation of benchmark surveys, annual surveys, and quarterly surveys from key providers such as the U.S. Census Bureau, the U.S. Department of the Treasury, and the BEA itself. For instance, the data released reflects the integration of revised source data for Census-basis goods from the U.S. Census Bureau for the years 2023-2025. Additionally, benchmark and quarterly insurance services surveys, quarterly international services surveys, and benchmark, annual, and quarterly direct investment surveys from BEA have been incorporated, covering periods ranging from 2019 to 2025. The U.S. Department of the Treasury’s annual, quarterly, and monthly portfolio and other investment surveys, spanning 2023-2025, have also been integrated.
These comprehensive updates allow the BEA to refine estimates for past periods, providing a more accurate and consistent picture of the U.S. international economic engagement. The revisions for the fourth quarter of 2025, as presented in the accompanying tables, illustrate the impact of these updates. For example, the current-account balance for the fourth quarter was revised from a preliminary estimate of -$190.7 billion to a revised -$221.1 billion. Similarly, the net financial-account transactions for the fourth quarter saw a substantial revision from -$135.9 billion to -$248.7 billion. The U.S. net international investment position at the end of 2025 was also significantly revised, from a preliminary -$27.54 trillion to -$21.87 trillion. These revisions underscore the dynamic nature of economic data and the importance of BEA’s ongoing efforts to maintain data integrity.
Broader Implications and Future Outlook
The widening current-account deficit and the net outflow of capital have several implications for the U.S. economy. A persistent current-account deficit implies that a nation is consuming more than it produces, financing the difference through borrowing from abroad or selling assets. While this can facilitate investment and economic growth in the short term, a continuous reliance on foreign capital can lead to increased debt burdens and potential vulnerabilities to shifts in global investor sentiment.
The BEA’s disclosure avoidance method update to "coarsening," which involves rounding, aggregation, and the use of ranges, is designed to enable the publication of more granular data while maintaining confidentiality for respondents. This strategic adjustment aims to enhance data accessibility and utility for researchers and policymakers alike.
Looking ahead, the U.S. economy’s engagement with the global economy will continue to be shaped by a complex interplay of trade policies, global economic growth, interest rate differentials, and geopolitical developments. The BEA will release the second-quarter 2026 statistics on International Transactions and Investment Position on September 24, 2026. These upcoming figures will provide further insight into the trajectory of the U.S. current-account and financial-account balances, offering a more current perspective on the nation’s international economic standing. The continuous refinement of these accounts, as demonstrated by the recent annual updates, ensures that policymakers and the public have access to the most accurate and comprehensive data to understand and navigate the evolving landscape of global economic interdependence. The BEA’s commitment to transparency and data accuracy remains paramount in charting the course of the U.S. economy in the international arena.