Lana Rhoades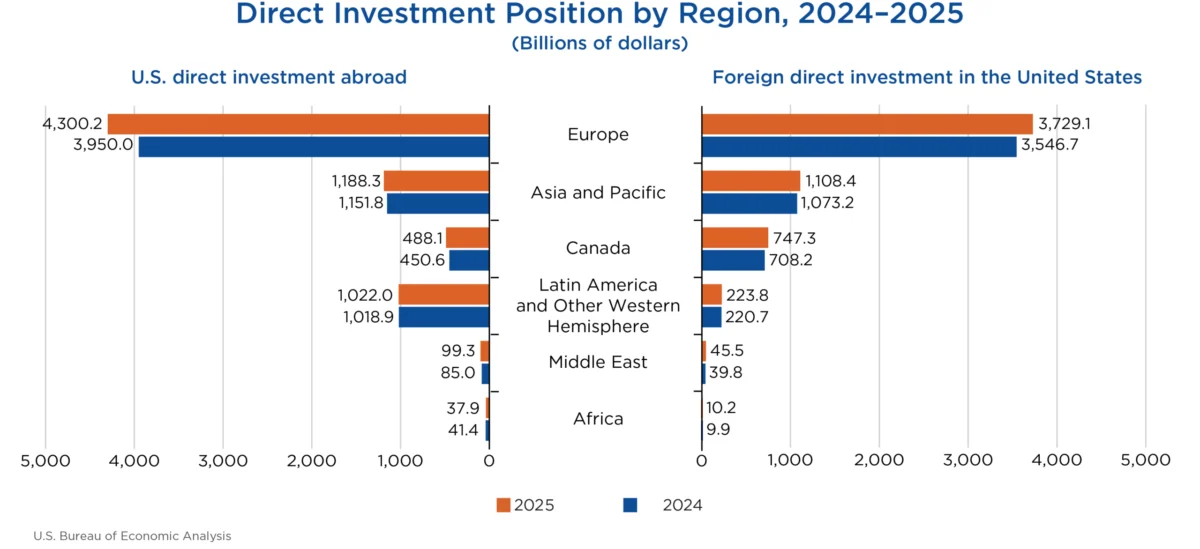
The cumulative level of U.S. direct investment abroad reached $7.14 trillion by the end of 2025, marking a substantial increase of $438.1 billion from the previous year. This expansion was largely driven by a robust surge in investments within Europe, which saw a $350.2 billion jump, with particular strength noted in the United Kingdom and Luxembourg. Manufacturing, especially the chemical sector, was the primary engine of this outbound investment growth. Concurrently, foreign direct investment in the United States also demonstrated considerable momentum, climbing $266.0 billion to a total of $5.86 trillion. Europe was again a leading contributor to this inbound flow, accounting for an $182.4 billion increase. German and Canadian multinational enterprises were the most significant drivers of this growth, with substantial investment increases of $49.0 billion and $39.2 billion, respectively. The manufacturing sector in the U.S. also experienced the most significant gains in foreign investment, particularly in electrical equipment and components. These figures, released by the U.S. Bureau of Economic Analysis (BEA), provide a comprehensive snapshot of the dynamic global investment landscape and the interconnectedness of national economies.
Deep Dive into U.S. Direct Investment Abroad
U.S. multinational enterprises (MNEs) maintain a widespread global investment footprint, extending their reach to nearly every nation. However, a significant concentration of this investment remains anchored in a select group of countries. In 2025, five nations collectively accounted for over half of the total U.S. direct investment abroad. The United Kingdom emerged as the leading destination, with a substantial position of $1,114.7 billion. Following closely were the Netherlands ($1,044.0 billion), Luxembourg ($645.3 billion), Ireland ($511.9 billion), and Canada ($488.1 billion). This geographical distribution highlights strategic economic relationships and established market presences for American businesses.
Examining the investment by industry of the directly owned foreign affiliate reveals a distinct pattern. Holding companies represented the largest share of the overall U.S. direct investment abroad, capturing 45.8 percent of the total position in 2025. This suggests a strategic use of holding companies for managing international assets and operations. Manufacturing affiliates followed, accounting for 15.9 percent of the investment, underscoring the continued importance of production and industrial activities in the global economy. Finance and insurance affiliates ranked third, comprising 13.5 percent of U.S. overseas investments.
When viewed from the perspective of the U.S. parent company’s industry, manufacturing MNEs were the most significant investors abroad, contributing 50.2 percent of the total position. MNEs operating in the finance and insurance sectors were the second-largest group of investors, representing 15.8 percent of the outbound investment. This dual perspective—both by the industry of the foreign affiliate and the industry of the U.S. parent—offers a more nuanced understanding of the drivers and structures of U.S. international investment.
The income generated from these foreign investments also saw a notable increase. In 2025, U.S. MNEs earned $660.1 billion on their cumulative direct investment abroad, an 11.1 percent rise compared to the previous year. The most significant income growth was observed in holding companies, which saw an increase of $40.0 billion. Conversely, income derived from finance and insurance affiliates experienced a decline of $6.3 billion when compared to 2024, indicating potential shifts in profitability or investment strategies within this sector.
Trends in Foreign Direct Investment in the United States
The United States continues to be a prime destination for foreign investment, with the cumulative position reaching $5.86 trillion by the end of 2025. Europe played a pivotal role in this inflow, contributing an increase of $182.4 billion to the overall position. The dynamism of foreign investment in the U.S. is further illustrated by the significant contributions from specific national origins. German multinationals led the charge with an impressive $49.0 billion increase in their investment position, followed by Canadian multinationals, which expanded their presence by $39.2 billion.
Analyzing foreign direct investment by the country of the foreign parent reveals that four nations accounted for more than half of the total investment in the U.S. in 2025. Japan stood out as the top investing country, with a substantial position of $776.3 billion. The Netherlands and Canada followed closely, with positions of $751.8 billion and $747.3 billion, respectively. The United Kingdom also maintained a significant presence, with a position of $738.3 billion.
A deeper examination of investment based on the country of the ultimate beneficial owner (UBO) offers a more refined perspective on the true origins of capital. On the UBO basis, Japan remained the leading investor with $827.1 billion. Canada secured the second position with $819.8 billion, and Germany was third with $706.2 billion. The discrepancies observed between the "country of foreign parent" and "country of UBO" figures, particularly for countries like the Netherlands and Luxembourg, suggest that a considerable portion of investment channeled through these jurisdictions ultimately originates from investors in other nations. This highlights the complexity of global capital flows and the importance of tracing investments to their ultimate source.
By industry, foreign direct investment in the United States was notably concentrated in the U.S. manufacturing sector, which accounted for a substantial 42.8 percent of the total foreign direct investment position. Within manufacturing, chemical manufacturing represented a significant portion, comprising one-third of the total manufacturing investment, amounting to $835.9 billion. Other key sectors attracting foreign capital included finance and insurance, with $629.7 billion invested, and wholesale trade, which received $534.0 billion. This concentration underscores the critical role of manufacturing in the U.S. economy and its appeal to international investors.
The income generated by foreign multinational enterprises from their investments in the United States saw a slight contraction in 2025. Foreign MNEs earned $310.1 billion on their cumulative direct investment in the U.S., representing a 1.9 percent decrease from 2024. This marginal decline, contrasted with the robust growth in investment positions, suggests that while foreign entities are actively expanding their presence in the U.S., the immediate returns on these investments may be experiencing some moderation.
Historical Context and Revisions to Data
The statistics released by the BEA are not static and are subject to revisions as new and more comprehensive data become available. The latest release included updates to previously published figures for U.S. direct investment abroad and foreign direct investment in the United States for the years 2022 through 2024. These revisions are crucial for maintaining the accuracy and reliability of economic reporting. For instance, U.S. direct investment abroad data for 2022 was not revised in this release, while data for 2023 and 2024 were updated. Similarly, foreign direct investment in the United States for 2022-2024 saw revisions. These adjustments reflect the BEA’s commitment to incorporating the latest source data, thereby providing a more precise reflection of economic activity.
The table below illustrates the magnitude of these revisions:
| Year | U.S. Direct Investment Abroad (Billions of dollars) | Foreign Direct Investment in the U.S. (Billions of dollars) | ||
|---|---|---|---|---|
| Previously Published | Revised | Previously Published | Revised | |
| 2022 | …. | …. | 5,124 | 5,110 |
| 2023 | 6,620 | 6,598 | 5,376 | 5,338 |
| 2024 | 6,827 | 6,698 | 5,708 | 5,598 |
Note: U.S. direct investment abroad data not revised for 2022.
Implications and Broader Economic Significance
The robust growth in both U.S. direct investment abroad and foreign direct investment in the United States underscores the continued vitality of global capital flows and the strategic importance of these investments for national economies. The significant increase in U.S. investment in Europe, particularly in the UK and Luxembourg, suggests a strategic repositioning or expansion of operations in key European markets, potentially driven by factors such as market access, favorable regulatory environments, or established supply chains. The strong performance of manufacturing sectors in both outbound and inbound investment indicates a persistent global demand for goods and services, as well as a confidence in the productive capacities of these economies.
The concentration of investment in holding companies for outbound U.S. investment points to sophisticated corporate structures designed for global asset management and tax efficiency. Conversely, the substantial foreign investment in U.S. manufacturing, especially in chemicals and electrical equipment, highlights the ongoing attractiveness of the American industrial base to international players.
The slight decrease in income earned by foreign MNEs in the U.S. warrants further monitoring. While investment positions have grown, a dip in earnings could signal increasing competition, rising operational costs, or a temporary slowdown in specific sectors. This trend, however, should be viewed in the context of the overall strong investment inflows.
The BEA’s ongoing efforts to enhance data transparency through revised disclosure avoidance methods, such as coarsening, are vital for providing a more detailed and accessible view of international investment patterns. This allows for a better understanding of economic dynamics without compromising the confidentiality of survey respondents. The detailed data tables and resources provided by the BEA are invaluable tools for economists, policymakers, businesses, and researchers seeking to analyze these complex global economic trends.
As the global economy continues to evolve, the patterns of direct investment serve as critical indicators of economic health, strategic priorities, and the interconnectedness of nations. The figures for 2025 paint a picture of continued dynamism and resilience in international investment, with significant opportunities and challenges shaping the global economic landscape. The next release of direct investment data in July 2027 will offer further insights into the ongoing trajectory of these crucial economic flows.