Lana Rhoades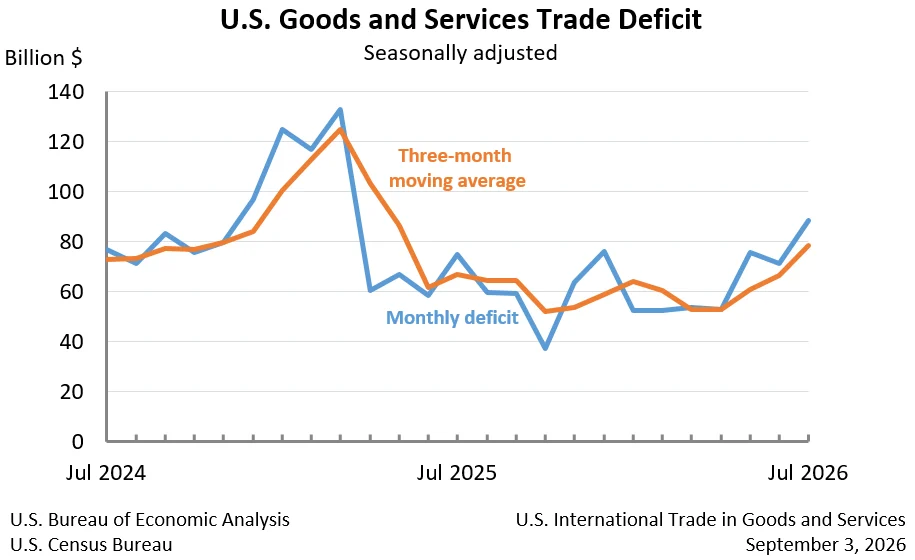
The United States experienced a significant widening of its goods and services deficit in July, reaching $88.6 billion, a notable increase of $17.4 billion from the revised $71.2 billion deficit recorded in June. This deterioration in the trade balance, as announced today by the U.S. Census Bureau and the U.S. Bureau of Economic Analysis, signals a shift in the nation’s international trade dynamics, with imports surging while exports experienced a decline. The July figures represent a 24.4% increase in the overall deficit compared to the previous month.
July Trade Figures Reveal Concerning Trends
Delving into the specifics of the July trade report, exports of goods and services collectively fell by $6.6 billion to $310.7 billion. This decline was primarily driven by a $6.2 billion decrease in goods exports, which settled at $201.0 billion. Exports of services also saw a marginal dip of $0.4 billion, totaling $109.7 billion. Concurrently, imports surged by $10.8 billion, reaching $399.3 billion. The increase in imports was predominantly in goods, which rose by $11.4 billion to $320.6 billion, while imports of services decreased by $0.6 billion to $78.7 billion.
The widening of the overall deficit was further exacerbated by an increase in the goods deficit, which expanded by $17.6 billion to $119.6 billion. This was partially offset by a modest increase in the services surplus, which grew by $0.2 billion to $31.0 billion. The interplay between these movements underscores the significant pressure exerted by the trade in goods on the nation’s overall balance.
Broader Context: Year-to-Date Performance and Moving Averages
While the July figures present a less optimistic picture, the year-to-date trend offers a slightly different perspective. For the period encompassing January through July, the cumulative goods and services deficit has actually decreased by $188.4 billion, or 29.6%, compared to the same period in the preceding year (2025). This year-to-date improvement is attributed to substantial growth in exports, which have risen by $237.2 billion, or 12.0%, while imports have seen a more moderate increase of $48.8 billion, or 1.9%. This suggests that while the monthly figures can be volatile, the underlying trend for the year has been one of deficit reduction, driven by robust export performance prior to July.
Examining the data through a three-month moving average, which helps to smooth out short-term fluctuations, reveals a less favorable trend in recent months. The average goods and services deficit increased by $11.9 billion to $78.5 billion for the three months ending in July. This average deficit is also higher than the $11.7 billion increase observed a year ago for the same three-month period ending in July 2025, indicating a recent acceleration in the trade gap.
Deep Dive into Goods and Services Trade Components
Goods Trade: The figures for goods trade paint a clear picture of the pressures contributing to the July deficit. The deficit in goods alone expanded significantly. On a Census basis, imports of goods increased by $12.0 billion, while exports decreased by $5.9 billion. When adjusted for balance of payments, imports of goods rose by $11.4 billion, and exports fell by $6.2 billion. This divergence highlights a weakening in demand for U.S. exports and a strengthening of demand for imported goods.
Services Trade: In contrast to goods, the services sector continues to contribute positively to the U.S. trade balance, albeit with a slight shift in July. The services surplus, while increasing overall, saw a slight decrease in its growth trajectory. Exports of services, at $109.7 billion, were down $0.4 billion. Imports of services, at $78.7 billion, decreased by $0.6 billion. This led to a modest increase in the services surplus, underscoring the resilience of U.S. service exports in a challenging global economic environment.
Real Goods Deficit: Adjusting for Inflation
An important consideration in analyzing trade data is the impact of inflation. The report also provides figures for the "real goods deficit," which is adjusted for price changes. In July, the real goods deficit, on a Census basis and in 2017 dollars, increased by $12.0 billion, or 12.7%, to $106.4 billion. This increase in the real deficit was proportionally smaller than the increase in the nominal deficit (17.7%), suggesting that a portion of the widening nominal deficit was indeed driven by higher prices for imported goods, rather than solely by increased volume. However, the significant rise in the real deficit still indicates a substantial increase in the physical quantity of imported goods relative to exported goods.
Revisions to Previous Data
The Census Bureau and the Bureau of Economic Analysis also provided revised figures for exports and imports of goods and services for January through June 2026. These revisions are a standard part of the trade reporting process, incorporating more comprehensive and updated monthly and quarterly data as it becomes available. While the specific details of the revisions to June exports and imports were not elaborated upon in the provided summary, such adjustments are crucial for ensuring the accuracy and reliability of the trade statistics. These revisions can sometimes lead to minor adjustments in previously reported monthly figures, but they are essential for maintaining the integrity of the long-term trade data series.
Trade Balance by Country and Region
The report provides detailed breakdowns of trade balances with key trading partners, offering insights into specific bilateral relationships.
Goods Trade by Selected Countries and Areas (Monthly – Census Basis):
In July, the U.S. recorded trade surpluses with several key partners, including the Netherlands ($7.8 billion), South and Central America ($6.6 billion), Hong Kong ($3.1 billion), the United Kingdom ($2.5 billion), Brazil ($2.4 billion), Singapore ($1.9 billion), Saudi Arabia ($1.3 billion), Australia ($1.2 billion), and Belgium ($0.9 billion).
Conversely, significant deficits were observed with a number of countries. Mexico led with a deficit of $27.5 billion, followed by Vietnam ($23.3 billion), Taiwan ($18.1 billion), China ($15.2 billion), South Korea ($10.4 billion), and the European Union ($8.9 billion). Other notable deficits included those with Germany ($5.6 billion), India ($5.0 billion), Malaysia ($4.8 billion), Japan ($4.2 billion), Ireland ($3.9 billion), Canada ($3.2 billion), Italy ($2.5 billion), France ($1.3 billion), Switzerland ($0.6 billion), and Israel ($0.5 billion). This breakdown highlights the concentration of goods trade deficits with major manufacturing hubs and North American neighbors.
Goods and Services Trade by Selected Countries and Areas (Quarterly – Balance of Payments Basis):
Data on trade in goods and services by country and area is released quarterly with a one-month lag. The second-quarter figures (April-June) reveal a different picture when services are included and a longer-term perspective is taken.
Surpluses in the second quarter were recorded with the Netherlands ($29.6 billion), South and Central America ($21.7 billion), Singapore ($15.9 billion), Hong Kong ($15.1 billion), Brazil ($12.7 billion), Ireland ($12.1 billion), Switzerland ($10.6 billion), Australia ($9.3 billion), the United Kingdom ($9.1 billion), Saudi Arabia ($4.7 billion), Belgium ($3.2 billion), and the European Union ($2.0 billion).
Deficits were recorded with Vietnam ($61.2 billion), Taiwan ($53.1 billion), Mexico ($52.7 billion), China ($32.3 billion), Germany ($19.2 billion), South Korea ($14.6 billion), Canada ($13.7 billion), India ($12.2 billion), Malaysia ($11.4 billion), Italy ($9.7 billion), France ($6.3 billion), Japan ($4.9 billion), and Israel ($1.5 billion). The quarterly data, encompassing both goods and services, provides a more comprehensive view of the U.S. trade relationships, with certain countries like Vietnam and Taiwan showing particularly large deficits when services are considered.
Looking Ahead and Data Availability
The next release of U.S. International Trade in Goods and Services data, covering August 2026, is scheduled for Tuesday, October 6, 2026. This upcoming report will provide further insights into the trajectory of the U.S. trade balance. All statistics referenced in the release are seasonally adjusted unless otherwise specified. Additional data, including not seasonally adjusted statistics and detailed goods data on a Census basis, are available through the U.S. Census Bureau and the U.S. Bureau of Economic Analysis websites.
A notable change accompanying future releases will be the renaming of "Nauru" to "Naoero" in trade statistics, aligning with the country’s official name change and international recognition.
Implications of the Widening Deficit
The substantial increase in the U.S. trade deficit in July raises several economic considerations. A persistent and widening trade deficit can have implications for domestic industries, employment, and the nation’s overall economic stability. Increased imports can sometimes lead to greater competition for domestic producers, potentially impacting manufacturing output and job growth in certain sectors. Conversely, a strong dollar, which can contribute to higher import volumes and lower export competitiveness, might be a factor.
Economists will be closely watching whether the July figures represent a temporary blip or a more sustained trend. Factors such as global economic growth, currency exchange rates, geopolitical events, and domestic demand will all play a crucial role in shaping future trade balances. The administration and policymakers may also consider the implications for trade policy, with a potential focus on measures to boost exports and manage import levels. The resilience of the services sector, which continues to generate a surplus, remains a bright spot in the U.S. trade picture, but the growing deficit in goods trade necessitates careful monitoring and analysis. The interplay between domestic economic policies and international trade dynamics will be a key area of focus in the coming months.