Lana Rhoades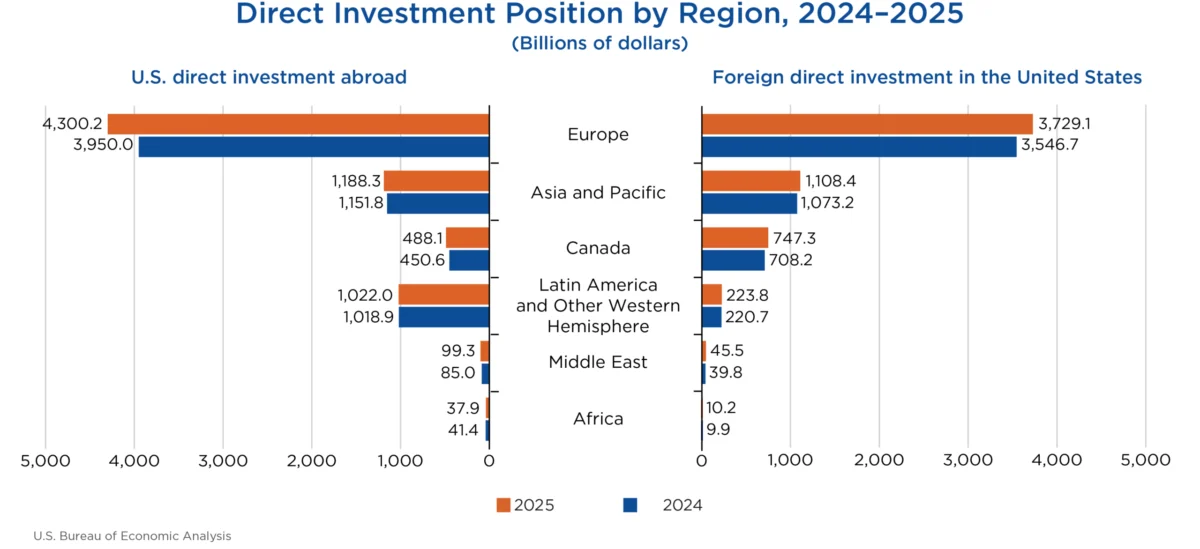
The cumulative level of U.S. direct investment abroad surged by $438.1 billion, reaching a substantial $7.14 trillion by the close of 2025. This robust expansion, detailed in statistics recently released by the U.S. Bureau of Economic Analysis (BEA), was predominantly fueled by an influx of $350.2 billion in new investments into Europe. Within the European landscape, the United Kingdom and Luxembourg emerged as the primary destinations for these capital flows. On an industry-wide basis, the manufacturing sector experienced the most significant uptick in investment, with chemical manufacturing spearheading this growth.
Concurrently, foreign direct investment (FDI) into the United States also demonstrated considerable strength, increasing by $266.0 billion to a total position of $5.86 trillion at the end of the same year. Similar to outbound U.S. investment, Europe was a leading contributor to this inbound capital, accounting for an $182.4 billion increase in the FDI position. Notably, German multinational enterprises (MNEs) were at the forefront of this trend, injecting an additional $49.0 billion into the U.S. economy. Canadian MNEs followed closely, with a significant $39.2 billion expansion of their U.S. investment footprint. The manufacturing sector in the United States also saw the largest increase in FDI, specifically within the electrical equipment and components manufacturing sub-sector.
A Deeper Dive into Investment Flows
The BEA’s comprehensive data reveals a dynamic global investment landscape, with U.S. companies actively expanding their international presence and foreign entities continuing to see the United States as a prime destination for their capital. The figures for 2025 underscore a period of heightened international economic engagement, reflecting both the strategic decisions of multinational corporations and broader economic trends.
U.S. Direct Investment Abroad: Key Destinations and Sectors
U.S. multinational enterprises (MNEs) have established a vast global network of investments, touching nearly every corner of the world. However, a significant portion of this outbound capital is concentrated in a select few countries. In 2025, investments in the top five countries accounted for more than half of the total U.S. direct investment abroad. The United Kingdom stood out as the largest recipient, with a cumulative investment position of $1,114.7 billion. Following closely were the Netherlands ($1,044.0 billion), Luxembourg ($645.3 billion), Ireland ($511.9 billion), and Canada ($488.1 billion). These destinations often represent key trading partners and established markets for U.S. businesses.
Delving into the industrial composition of these foreign affiliates, holding companies emerged as the dominant recipients of U.S. direct investment, capturing a substantial 45.8 percent of the total position abroad in 2025. This indicates a strategic use of holding companies for managing international operations, financial transactions, and tax efficiencies. Manufacturing affiliates secured the second-largest share, representing 15.9 percent of the overall investment, followed by finance and insurance affiliates at 13.5 percent.
From the perspective of the U.S. parent companies, the manufacturing sector was the most significant driver of outbound investment, accounting for 50.2 percent of the total position. This was followed by MNEs operating within the finance and insurance sectors, which contributed 15.8 percent of U.S. direct investment abroad. This suggests a strong appetite for expanding production capabilities, market reach, and service offerings in key global industries.
In terms of profitability, U.S. MNEs generated substantial income from their overseas investments. In 2025, income earned on cumulative investment abroad reached $660.1 billion, marking an 11.1 percent increase from the previous year. The holding company sector experienced the most significant income growth, rising by $40.0 billion. Conversely, income within the finance and insurance sectors saw a slight decline of $6.3 billion compared to 2024. This divergence in income performance across sectors highlights varying economic conditions and strategic outcomes in different global markets.
Foreign Direct Investment in the United States: Top Investors and Industries
The United States continues to be a highly attractive destination for foreign capital. In 2025, the cumulative position of foreign direct investment in the U.S. economy reached $5.86 trillion. Analyzing this inflow by the country of the foreign parent reveals that four nations collectively account for over half of the total FDI. Japan led the pack as the top investing country, with a substantial position of $776.3 billion. The Netherlands followed with $751.8 billion, with Canada closely behind at $747.3 billion, and the United Kingdom at $738.3 billion. These countries represent long-standing economic partners with deep investment ties to the U.S.
A more nuanced view emerges when examining investment based on the ultimate beneficial owner (UBO). This perspective traces investment back to the entity at the highest level of the global ownership chain. On a UBO basis, Japan remained the leading investor in 2025, with a position of $827.1 billion. Canada secured the second spot with $819.8 billion, followed by Germany at $706.2 billion. The data also revealed a significant difference in investment figures when viewed from the UBO perspective compared to the country of foreign parent for countries like the Netherlands and Luxembourg. This indicates that a considerable portion of investment channeled through these jurisdictions ultimately originates from entities based in other nations, highlighting the role of these countries as financial intermediaries or holding company locations.
From an industry standpoint, the U.S. manufacturing sector was the primary recipient of foreign direct investment, attracting 42.8 percent of the total position. This amounted to $2.51 trillion in foreign investment within U.S. manufacturing. Within this sector, chemical manufacturing was a particularly strong area of investment, accounting for one-third of the total, or $835.9 billion. Significant investments were also observed in the finance and insurance sectors ($629.7 billion) and wholesale trade ($534.0 billion), underscoring the diverse appeal of the U.S. market to foreign investors.
Foreign MNEs generated $310.1 billion in income from their cumulative investments in the United States during 2025. This figure represents a slight decrease of 1.9 percent compared to the income earned in 2024, suggesting a period of stabilization or modest recalibration in foreign investor returns within the U.S. market.
Historical Context and Revisions
The BEA’s release also included important revisions to previously published statistics for U.S. direct investment abroad and foreign direct investment in the United States. These revisions, which incorporate newly available and updated source data, offer a more accurate reflection of economic activity. For instance, U.S. direct investment abroad data for 2023-2024 and foreign direct investment in the United States for 2022-2024 have been updated. While specific figures for 2022 U.S. direct investment abroad were not revised, the data for 2023 and 2024 saw adjustments. For example, the 2023 position for U.S. direct investment abroad was revised from $6,620 billion to $6,598 billion, and for foreign direct investment in the United States, it was revised from $5,376 billion to $5,338 billion. These ongoing refinements are crucial for maintaining the integrity and precision of economic reporting.
Broader Implications and Future Outlook
The substantial growth in both outward U.S. investment and inward foreign investment highlights the interconnectedness of the global economy and the strategic importance of international capital flows. The strength of investment in manufacturing, particularly in sectors like chemicals and electrical equipment, suggests a continued emphasis on production and supply chain development. The significant role of holding companies in outbound U.S. investment points to sophisticated corporate structuring and financial management strategies being employed by American MNEs.
For the United States, the consistent inflow of FDI signifies its enduring attractiveness as an investment destination, driven by its large consumer market, skilled workforce, and stable economic environment. The UBO data, in particular, offers valuable insights into the true origins of foreign capital, providing a clearer picture of geopolitical and economic influences on U.S. investment.
The BEA’s commitment to enhancing data publication through methods like coarsening, which includes rounding, aggregation, and the use of ranges, is a strategic move to balance the need for comprehensive data with the imperative of respondent confidentiality. This approach allows for the release of more granular information, benefiting researchers, policymakers, and businesses alike, while upholding privacy standards.
Looking ahead, the BEA’s schedule indicates that the next release of Direct Investment by Country and Industry data, covering the year 2026, is anticipated in July 2027. This ongoing reporting will be crucial for monitoring the evolution of global investment patterns and understanding their implications for economic growth, employment, and trade dynamics in the years to come. The sustained trends observed in 2025 suggest a continued robust engagement in international investment, with manufacturing and finance remaining key sectors for both inbound and outbound capital flows. The strategic importance of countries like the UK, Netherlands, Japan, and Canada as major investment hubs is likely to persist, shaping global economic relationships and investment strategies.