Lana Rhoades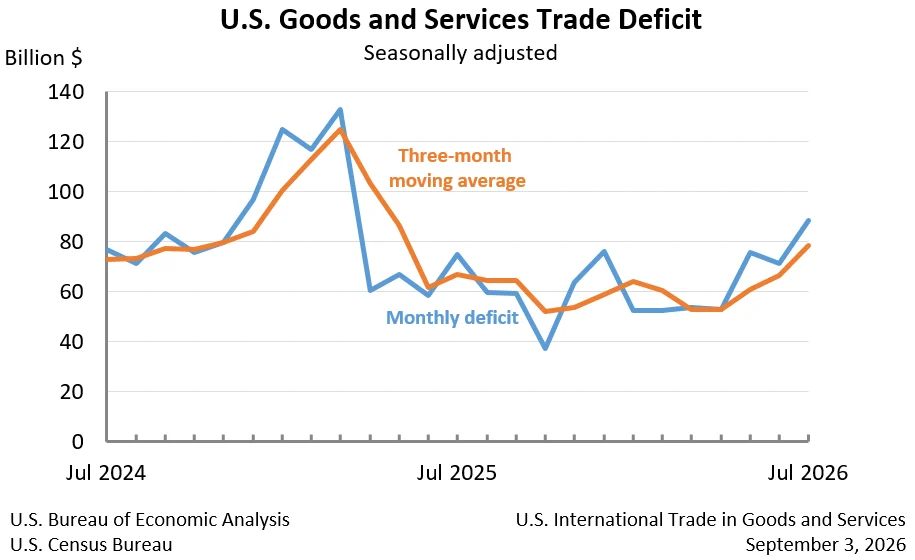
The United States experienced a substantial widening of its goods and services trade deficit in July, reaching $88.6 billion, a marked increase of $17.4 billion from the revised $71.2 billion deficit recorded in June. This escalation, representing a 24.4% jump in the deficit, signals a growing imbalance in the nation’s international trade, primarily fueled by a surge in imports that outpaced a modest decline in exports. The data, released jointly by the U.S. Census Bureau and the U.S. Bureau of Economic Analysis, provides a critical snapshot of the U.S. economic engagement with the rest of the world and highlights potential headwinds for domestic industries.
Key Figures and Trends
In July, U.S. exports of goods and services totaled $310.7 billion, marking a decrease of $6.6 billion from the previous month. This dip was primarily driven by a $6.2 billion reduction in goods exports, which fell to $201.0 billion. Services exports also saw a slight decline, decreasing by $0.4 billion to $109.7 billion.
Conversely, imports demonstrated robust growth. Total imports of goods and services climbed by $10.8 billion to $399.3 billion in July. The lion’s share of this increase was in goods imports, which rose by $11.4 billion to $320.6 billion. Imports of services, however, experienced a contraction, falling by $0.6 billion to $78.7 billion.
The overall increase in the goods and services deficit was a composite of two key movements. The deficit in goods widened by a significant $17.6 billion, reaching $119.6 billion. This was partially offset by a marginal increase in the services surplus, which grew by $0.2 billion to $31.0 billion. This divergence underscores the ongoing challenges within the goods sector, which continues to be a major contributor to the U.S. trade imbalance.
Deeper Dive into Goods and Services
Goods Trade: The goods deficit, a persistent area of concern for U.S. policymakers, worsened considerably in July. Exports of goods, excluding adjustments for balance of payments, decreased by $5.9 billion to $201.0 billion. This decline, coupled with net balance of payments adjustments that decreased by $0.3 billion, contributed to the overall drop in goods exports. On the import side, goods imports on a Census basis saw a substantial increase of $12.0 billion, pushing the total to $320.6 billion. When factoring in balance of payments adjustments, which decreased by $0.6 billion, the total import value still registered a significant rise.
Services Trade: While the goods sector faced headwinds, the services sector continued to exhibit resilience, albeit with a slight cooling. Services exports, encompassing a wide range of intangible trade like travel, financial services, and intellectual property, declined modestly by $0.4 billion to $109.7 billion. This slight dip does not, however, negate the generally strong performance of U.S. services exports in recent periods. The services surplus, a bright spot in the U.S. trade balance, saw a small increase of $0.2 billion, reaching $31.0 billion. This indicates that the U.S. continues to hold a competitive edge in many service industries, which helps to partially cushion the impact of the larger deficit in goods.
Real vs. Nominal Trade Balances
An examination of "real" goods trade, adjusted for price changes and measured in 2017 dollars on a Census basis, reveals a similar trend of widening imbalance. The real goods deficit expanded by $12.0 billion, or 12.7%, to $106.4 billion in July. This increase in the real deficit was slightly less pronounced than the 17.7% increase observed in the nominal goods deficit, suggesting that while price fluctuations played a role, the underlying volume of trade contributed significantly to the deterioration.
Year-to-Date Trends and Moving Averages
Looking at the broader picture, the year-to-date deficit for goods and services has shown a significant improvement compared to the same period in 2025. As of July, the cumulative deficit had decreased by $188.4 billion, or 29.6 percent. This improvement has been driven by a substantial increase in exports, which rose by $237.2 billion (12.0 percent), while imports saw a more modest increase of $48.8 billion (1.9 percent). This suggests that earlier in the year, export growth had significantly outpaced import growth, contributing to a healthier trade balance.
However, the July figures indicate a potential reversal of this positive trend. The three-month moving average for the goods and services deficit increased by $11.9 billion to $78.5 billion for the three months ending in July. This rise in the moving average, which smooths out month-to-month volatility, signals a potential shift towards a widening deficit. Year-over-year, this three-month average deficit also increased by $11.7 billion from the period ending in July 2025, further reinforcing the notion of a recent deterioration in the trade balance.
Revisions and Data Integrity
The U.S. Census Bureau and the Bureau of Economic Analysis also announced revisions to the January through June 2026 data for exports and imports of goods and services. These revisions are a standard part of the statistical process, incorporating more comprehensive and updated quarterly and monthly data to ensure the highest level of accuracy in the reported figures. Such revisions are crucial for analysts and policymakers to make informed decisions based on the most reliable economic indicators.
Trade Balances by Country and Region
The report also provides detailed breakdowns of trade balances with key trading partners.
Goods on a Census Basis (Monthly):
In July, the U.S. recorded trade surpluses with several countries and regions, including:
- Netherlands ($7.8 billion)
- South and Central America ($6.6 billion)
- Hong Kong ($3.1 billion)
- United Kingdom ($2.5 billion)
- Brazil ($2.4 billion)
- Singapore ($1.9 billion)
- Saudi Arabia ($1.3 billion)
- Australia ($1.2 billion)
- Belgium ($0.9 billion)
Conversely, significant deficits were observed with:
- Mexico ($27.5 billion)
- Vietnam ($23.3 billion)
- Taiwan ($18.1 billion)
- China ($15.2 billion)
- South Korea ($10.4 billion)
- European Union ($8.9 billion)
- Germany ($5.6 billion)
- India ($5.0 billion)
- Malaysia ($4.8 billion)
- Japan ($4.2 billion)
- Ireland ($3.9 billion)
- Canada ($3.2 billion)
- Italy ($2.5 billion)
- France ($1.3 billion)
- Switzerland ($0.6 billion)
- Israel ($0.5 billion)
Goods and Services on a Balance of Payments Basis (Quarterly):
Data for trade in goods and services by country and area is available quarterly with a one-month lag. Second-quarter figures revealed surpluses with:
- Netherlands ($29.6 billion)
- South and Central America ($21.7 billion)
- Singapore ($15.9 billion)
- Hong Kong ($15.1 billion)
- Brazil ($12.7 billion)
- Ireland ($12.1 billion)
- Switzerland ($10.6 billion)
- Australia ($9.3 billion)
- United Kingdom ($9.1 billion)
- Saudi Arabia ($4.7 billion)
- Belgium ($3.2 billion)
- European Union ($2.0 billion)
Notable deficits in the second quarter were with:
- Vietnam ($61.2 billion)
- Taiwan ($53.1 billion)
- Mexico ($52.7 billion)
- China ($32.3 billion)
- Germany ($19.2 billion)
- South Korea ($14.6 billion)
- Canada ($13.7 billion)
- India ($12.2 billion)
- Malaysia ($11.4 billion)
- Italy ($9.7 billion)
- France ($6.3 billion)
- Japan ($4.9 billion)
- Israel ($1.5 billion)
These country-specific figures highlight the concentrated nature of U.S. trade imbalances, with particular regions and nations contributing disproportionately to the overall deficit. The persistent deficits with major Asian economies and Mexico, contrasted with surpluses in services and with certain European and South American nations, paint a complex picture of global trade dynamics.
Implications and Context
The widening of the U.S. trade deficit in July, following a period of improvement earlier in the year, raises questions about the sustainability of recent economic trends. An increasing trade deficit can have several implications:
- Economic Growth: A larger deficit can indicate that domestic demand is strong, leading to increased imports. However, it also means that a greater portion of that demand is being met by foreign production, potentially dampening growth in domestic manufacturing sectors.
- Currency Exchange Rates: A persistent trade deficit can put downward pressure on the U.S. dollar as more dollars are supplied to the global market to pay for imports. However, currency markets are influenced by a multitude of factors, including interest rates and capital flows.
- Employment: Increased imports, particularly in manufacturing, can lead to job losses in domestic industries that compete with foreign producers. Conversely, a strong export sector can create jobs and boost economic activity.
- National Debt: While not directly linked, persistent trade deficits can contribute to an accumulation of foreign claims on U.S. assets, potentially impacting long-term economic stability.
The earlier year-to-date improvement suggests that U.S. export competitiveness might have been strong, or that global demand for U.S. goods and services was robust. The July figures, however, indicate that a resurgence in import growth, coupled with a slight decline in exports, has reversed some of that progress. Factors such as global economic conditions, currency valuations, and trade policies of major trading partners all play a significant role in shaping these trade flows.
The increase in the goods deficit, in particular, warrants close attention. This sector is often more sensitive to global economic shifts and can be directly impacted by tariffs and trade disputes. The substantial rise in goods imports suggests strong consumer and business demand, but also raises concerns about the ability of domestic industries to keep pace or compete effectively.
Looking Ahead
The next release of U.S. International Trade in Goods and Services, scheduled for October 6, 2026, will provide crucial data for August 2026. This upcoming report will be closely watched for signs of whether the July trend of a widening deficit is a temporary anomaly or the beginning of a new pattern. Policymakers and business leaders will be analyzing these figures to gauge the overall health of the U.S. economy and its position in the global marketplace.
Country Name Change Notification
In a minor administrative note, the U.S. Census Bureau announced that with the release of the August 2026 trade data, references to "Nauru" will be updated to "Naoero." This change reflects the country’s recent official name change and aligns with recognitions by the U.S. Department of State and the International Organization for Standardization. This ensures that trade statistics accurately represent current geopolitical naming conventions.
The detailed data and methodologies behind these reports are available on the websites of the U.S. Census Bureau and the U.S. Bureau of Economic Analysis, providing a transparent and accessible resource for economic analysis.