

 Lana Rhoades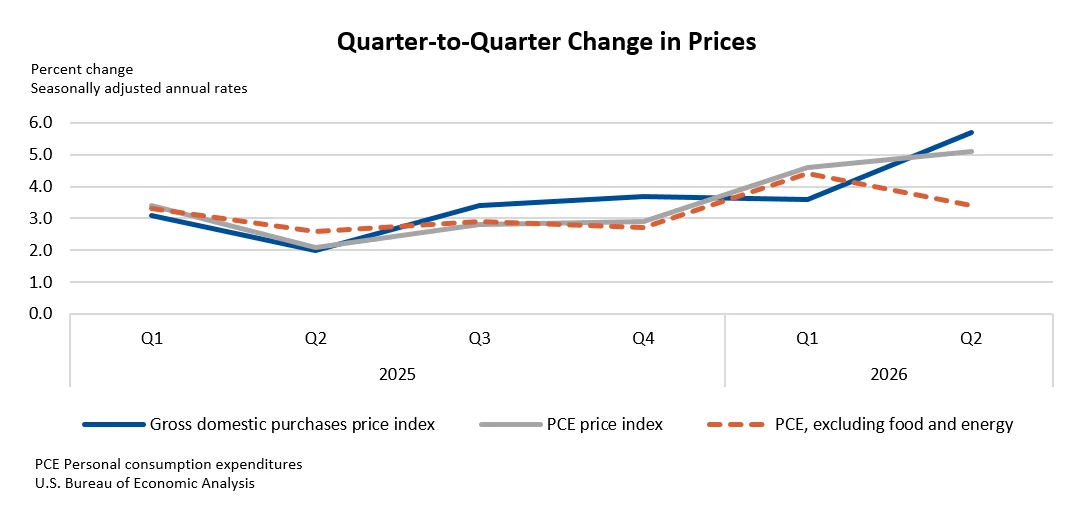
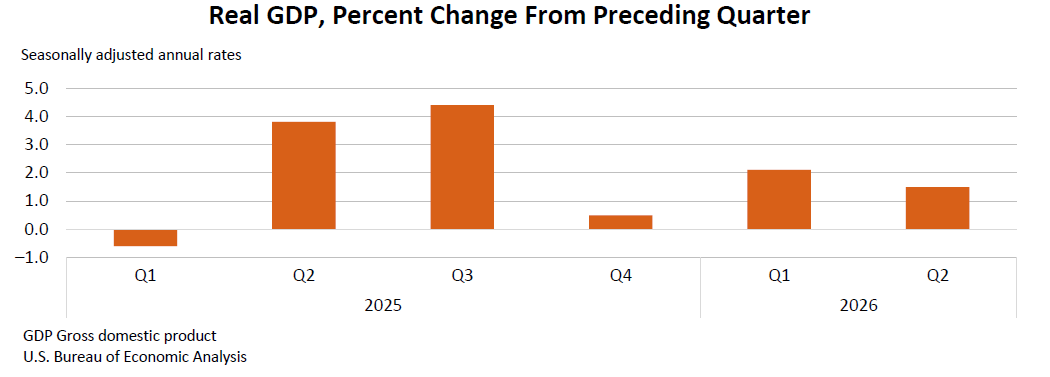
The U.S. economy exhibited a notable slowdown in the second quarter of 2026, with real gross domestic product (GDP) expanding at an annualized rate of 1.5 percent, according to the advance estimate released by the U.S. Bureau of Economic Analysis (BEA). This deceleration marks a distinct shift from the more robust 2.1 percent growth observed in the first quarter of the year. The latest figures suggest a recalibration of economic momentum, driven by a complex interplay of consumer spending, investment, exports, and government expenditures.
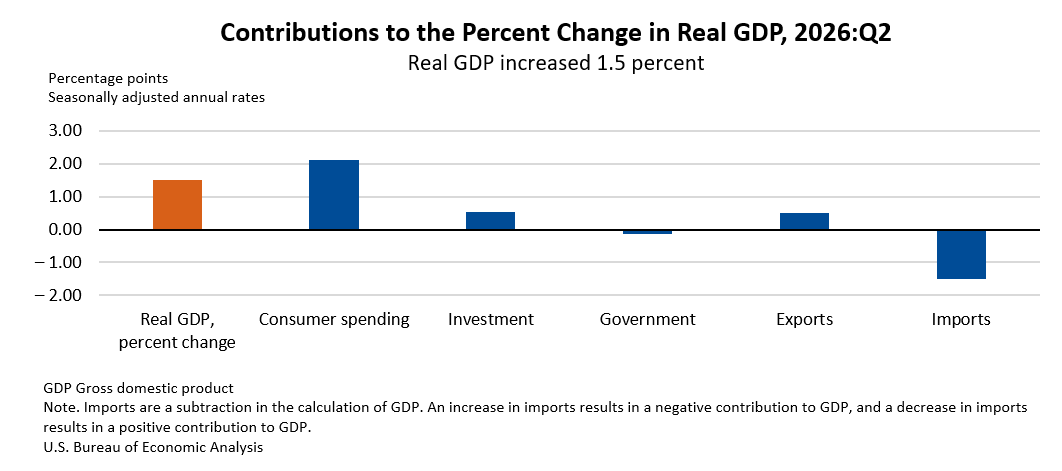
The dip in GDP growth from the first quarter to the second quarter is primarily attributed to a significant downturn in government spending, which acted as a drag on overall economic output. This was compounded by decelerations in the pace of investment and export growth. While consumer spending continued to expand, its acceleration was not sufficient to fully offset these headwinds. Imports, which are subtracted in the calculation of GDP, also increased more significantly in the second quarter compared to the first, further contributing to the reduced growth rate.
Key Drivers of Economic Activity in Q2 2026
An examination of the components contributing to the second-quarter GDP reveals a mixed picture. Increases in consumer spending, investment, and exports were the primary engines of growth. Consumer spending, a cornerstone of the U.S. economy, demonstrated resilience, while investment, encompassing business spending on equipment, structures, and intellectual property products, also contributed positively. Export growth, reflecting the demand for U.S. goods and services in international markets, added to the economic expansion.
However, the impact of these positive contributions was partially mitigated by a decrease in government spending at all levels – federal, state, and local. This decline in public sector expenditure suggests potential shifts in fiscal policy or a moderation in government-led initiatives that had previously boosted economic activity. Imports, which represent spending on goods and services produced abroad, saw a notable increase. A rise in imports signifies that a larger portion of domestic demand was met by foreign production, which, by definition, reduces the net contribution of domestic economic activity to GDP.
A Look at Private Domestic Demand and Inflationary Pressures
Beyond the headline GDP figure, the BEA’s data provides insights into the strength of private domestic demand. Real final sales to private domestic purchasers, a measure that excludes inventories and government consumption, surged by 3.9 percent in the second quarter. This represents a significant acceleration from the 1.7 percent increase recorded in the first quarter. This robust growth in private domestic demand suggests that the underlying economic activity driven by consumers and businesses remains strong, even as the overall GDP figure moderated. This divergence highlights the impact of factors like government spending and inventory adjustments on the headline GDP number.
Concurrently, inflationary pressures showed a marked increase in the second quarter. The price index for gross domestic purchases, which measures the prices of goods and services purchased by domestic entities, escalated by 5.7 percent. This is a substantial acceleration from the 3.6 percent increase observed in the first quarter. This rise in inflation, often referred to as the GDP deflator, indicates that the cost of producing goods and services within the U.S. economy has increased.
Digging deeper into inflation metrics, the personal consumption expenditures (PCE) price index, a key inflation gauge favored by the Federal Reserve, rose by 5.1 percent in the second quarter, up from 4.6 percent in the first quarter. This broad-based increase in consumer prices suggests that inflationary pressures are becoming more embedded in the economy. However, a more closely watched sub-component, the PCE price index excluding food and energy, which aims to capture core inflation trends, increased by 3.4 percent. While still elevated, this represents a deceleration from the 4.4 percent increase seen in the first quarter. This divergence between the headline PCE and the core PCE could indicate that some of the recent inflationary surge is attributable to volatile food and energy prices, while underlying inflationary pressures might be moderating, albeit at a higher level than desired.
Historical Context and Broader Economic Trends
The economic landscape leading into the second quarter of 2026 had been characterized by a recovery from prior economic disruptions and a period of sustained, albeit sometimes uneven, growth. The first quarter’s 2.1 percent GDP growth had signaled continued expansion, building on the momentum from the preceding year. However, global economic uncertainties, including geopolitical developments and ongoing adjustments in supply chains, have consistently presented challenges to sustained, high-paced growth.
The deceleration observed in the second quarter can be viewed within this broader context of navigating a complex global economic environment. Policymakers and market participants will be closely observing the interplay between robust private demand and persistent inflationary pressures. The Federal Reserve, in particular, will be scrutinizing the PCE price index data to inform its decisions regarding monetary policy. A sustained period of elevated inflation, even with moderating core inflation, could prompt further consideration of interest rate adjustments to curb price growth and maintain economic stability.
Expert Analysis and Potential Implications
Economists are analyzing the latest GDP report for clues about the future trajectory of the U.S. economy. The robust growth in real final sales to private domestic purchasers is a positive signal, suggesting that the consumer and business sectors are fundamentally healthy and continue to drive economic activity. This underlying strength provides a cushion against potential downturns.
However, the significant increase in the gross domestic purchases price index and the PCE price index raises concerns about the persistence of inflation. While the deceleration in the core PCE index offers some relief, the overall inflationary environment remains a key challenge. The BEA’s advance estimate provides an initial snapshot, and subsequent revisions are expected as more comprehensive data becomes available.
The decrease in government spending could have multifaceted implications. If this reflects a deliberate fiscal consolidation, it might aim to reduce the national debt or reallocate resources. However, it also means that a previously significant driver of economic growth has become a drag. The extent to which private sector activity can compensate for this shift will be crucial for future economic performance.
The BEA’s forthcoming annual updates to national and regional economic accounts, scheduled for September 30, 2026, will provide a more refined and comprehensive picture of the U.S. economy, incorporating additional data and statistical improvements. These updates are anticipated to enhance the accuracy of GDP, gross domestic income, and other key economic indicators.
Looking Ahead: The Next GDP Estimate
The next release from the BEA, scheduled for August 26, 2026, will provide the second estimate for second-quarter GDP and will also include data on corporate profits. This release will incorporate additional data that will allow for a more refined assessment of economic performance and the accuracy of the initial advance estimate. The BEA also regularly publishes data archives, allowing researchers and the public to access historical data for in-depth analysis and comparison.
The economic narrative for the second quarter of 2026 is one of moderating headline growth, underpinned by strong private demand, but tempered by declining government spending and persistent inflationary pressures. The coming months will be critical in determining whether the economy can sustain its private sector momentum while navigating the challenges of inflation and fiscal adjustments. The BEA’s ongoing data releases will be essential for understanding these evolving economic dynamics.








