Lana Rhoades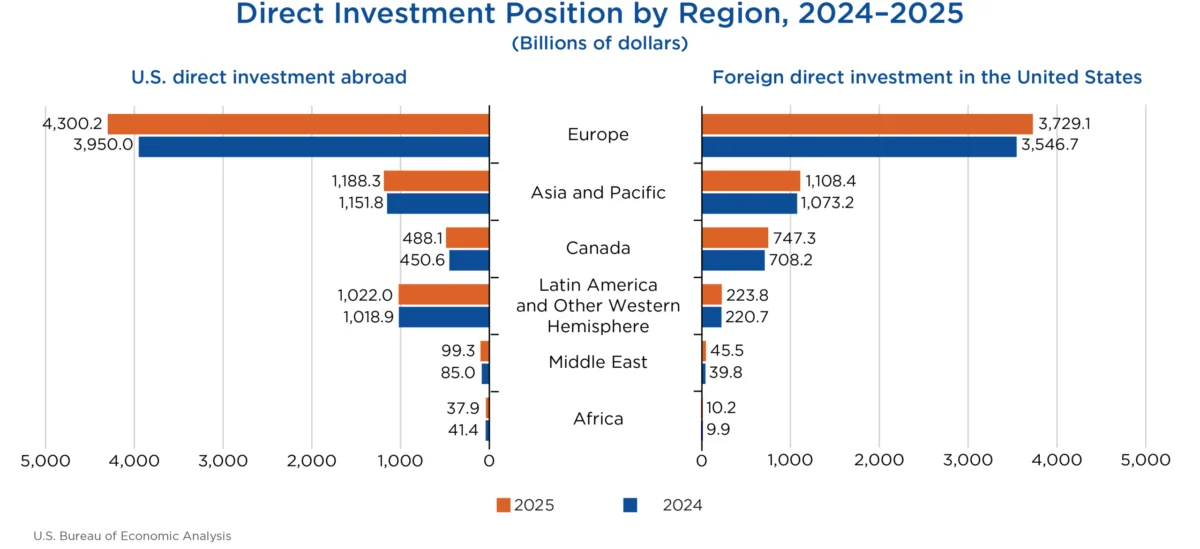
The cumulative level of U.S. direct investment abroad reached $7.14 trillion at the close of 2025, marking a significant increase of $438.1 billion from the previous year. This expansion, detailed in statistics released today by the U.S. Bureau of Economic Analysis (BEA), was predominantly driven by a substantial surge in investment within Europe, which saw an increase of $350.2 billion. The United Kingdom and Luxembourg emerged as key destinations for this outbound capital, reflecting a continued strategic focus on these European economic hubs. On the flip side, foreign direct investment (FDI) in the United States also experienced notable growth, climbing by $266.0 billion to a total position of $5.86 trillion by the end of 2025. Europe was also the primary contributor to this inbound investment, accounting for an $182.4 billion increase in the U.S. FDI position.
These figures underscore a dynamic and interconnected global economic landscape, where capital flows between the U.S. and the rest of the world continue to shape industries and economies. The BEA’s comprehensive data provides critical insights into the patterns and drivers of international investment, offering a barometer of global economic confidence and strategic corporate decision-making.
U.S. Direct Investment Abroad: European Expansion and Manufacturing Dominance
The $7.14 trillion U.S. direct investment abroad position at the end of 2025 represents a substantial accumulation of assets and equity held by U.S. multinational enterprises (MNEs) in their foreign affiliates. The year-over-year increase of $438.1 billion signals a healthy appetite for overseas expansion and investment. A significant portion of this growth, $350.2 billion, was channeled into Europe, highlighting the continent’s enduring importance as an investment destination for American businesses. The United Kingdom and Luxembourg, in particular, were beneficiaries of this capital inflow, indicating ongoing strategic commitments and perhaps advantageous market conditions or regulatory environments within these nations.
By industry, manufacturing sector affiliates received the largest increase in U.S. direct investment abroad, with chemical manufacturing leading the surge. This focus on manufacturing, especially in sophisticated sectors like chemicals, suggests a continued reliance on global supply chains and production capabilities by U.S. companies. It also points to potential strategic investments in research and development, advanced manufacturing techniques, or market access for specialized chemical products.
The BEA data further reveals that U.S. MNEs maintain a broad global footprint, investing in nearly every country. However, a significant concentration of investment is evident, with five countries accounting for more than half of the total U.S. direct investment abroad in 2025. The United Kingdom led this group with a substantial position of $1,114.7 billion, underscoring its role as a prime hub for U.S. overseas operations. Following closely were the Netherlands ($1,044.0 billion), Luxembourg ($645.3 billion), Ireland ($511.9 billion), and Canada ($488.1 billion). These figures illustrate the strategic importance of established economic partners and financial centers for U.S. international business.
When examining the investment by the industry of the directly owned foreign affiliate, holding companies emerged as the largest recipients of U.S. direct investment abroad, comprising 45.8 percent of the overall position. This dominance of holding companies suggests a strategic use of these entities for managing global assets, facilitating financial transactions, and optimizing tax structures across international operations. Manufacturing affiliates ranked second, accounting for 15.9 percent of the total, reinforcing the earlier observation about the manufacturing sector’s growth. Finance and insurance affiliates followed, representing 13.5 percent of U.S. investment abroad, indicating the continued global reach of the U.S. financial services industry.
Analyzing the investment by the industry of the U.S. parent company, MNEs in the manufacturing sector were the most significant investors abroad, contributing 50.2 percent of the total position. This aligns with the findings regarding the industry of foreign affiliates, emphasizing the outward investment drive of U.S. manufacturing giants. MNEs in finance and insurance were the second-largest investing group, accounting for 15.8 percent of the position, demonstrating the global engagement of the U.S. financial sector.
In terms of income generated from these overseas investments, U.S. MNEs earned a substantial $660.1 billion in 2025 on their cumulative direct investment abroad. This represents an 11.1 percent increase from the previous year, signaling strong returns on foreign assets. Income growth was particularly robust within holding companies, which saw an increase of $40.0 billion. Conversely, income generated by finance and insurance affiliates experienced a decline of $6.3 billion compared to 2024, a trend that warrants further monitoring to understand its underlying causes.
Foreign Direct Investment in the United States: European Strength and Manufacturing Focus
The increase in foreign direct investment in the United States to $5.86 trillion by the end of 2025 reflects a continued inflow of capital from international businesses seeking opportunities within the U.S. economy. The $266.0 billion year-over-year growth highlights the attractiveness of the U.S. market for foreign investors. Similar to outbound U.S. investment, Europe was the leading source of this inbound capital, contributing an additional $182.4 billion to the U.S. FDI position. This sustained interest from European investors underscores the deep economic ties and mutual reliance between the U.S. and European economies.
Further breakdown of the sources of this FDI reveals specific country contributions. German multinationals were particularly active, increasing their investment position in the U.S. by $49.0 billion, making them the largest single contributor to the year’s growth. Canadian multinationals followed closely, with a $39.2 billion increase in their U.S. investment position, highlighting the strong and enduring economic relationship between the two North American neighbors.
By industry, the U.S. manufacturing sector attracted the largest increase in foreign direct investment. This growth was led by investments in electrical equipment and components manufacturing, indicating a strong demand for these products and a strategic interest in participating in the U.S. supply chain for advanced technology and infrastructure. The overall concentration of FDI in U.S. manufacturing, which accounted for 42.8 percent of the total position, underscores its continued significance as a pillar of the American economy and a magnet for foreign capital. Within this broad manufacturing category, chemical manufacturing stood out, representing a third of the total foreign investment in the sector, or $835.9 billion. Significant investment was also observed in the finance and insurance sector ($629.7 billion) and wholesale trade ($534.0 billion), demonstrating the diverse appeal of the U.S. market to foreign investors.
When examining foreign direct investment by country of the foreign parent, four nations accounted for more than half of the total FDI in the United States in 2025. Japan remained the top investing country, with a position of $776.3 billion, reflecting its long-standing commitment to the U.S. market. The Netherlands followed with a position of $751.8 billion, and Canada with $747.3 billion, further solidifying the strong economic ties with these nations. The United Kingdom also featured prominently, with a position of $738.3 billion.
A more nuanced view emerges when considering the country of the ultimate beneficial owner (UBO). On this basis, Japan again led as the top investing country, with a position of $827.1 billion. Canada secured the second position with $819.8 billion, and Germany was third with $706.2 billion. Notably, the UBO data revealed that investment from the Netherlands and Luxembourg was significantly lower than when considered by the country of the foreign parent. This discrepancy suggests that a substantial portion of investment originating from these European financial centers is ultimately owned by investors based in other countries, highlighting the complex global ownership structures that characterize modern international investment.
Foreign MNEs generated $310.1 billion in income from their cumulative investments in the United States in 2025. This figure represents a slight decrease of 1.9 percent compared to 2024, a trend that may reflect shifts in market conditions, profitability, or reinvestment strategies by foreign companies operating in the U.S.
Historical Context and Data Revisions
The BEA’s release of 2025 direct investment statistics also includes revisions to previously published data for 2022 through 2024. These revisions are a standard practice, incorporating newly available and updated source data to ensure the highest accuracy of economic indicators. For instance, the U.S. direct investment abroad position for 2024 was revised to $6.698 trillion from a previously published $6.827 trillion. Similarly, foreign direct investment in the United States for 2024 was revised to $5.598 trillion from $5.708 trillion. These adjustments underscore the dynamic nature of economic data and the BEA’s commitment to providing the most precise economic picture.
The updated figures for earlier years provide a more accurate historical trajectory of international investment flows. The revisions for 2023, for example, show U.S. direct investment abroad at $6.598 trillion (revised from $6.620 trillion) and foreign direct investment in the U.S. at $5.338 trillion (revised from $5.376 trillion). These refinements are crucial for analysts, policymakers, and businesses relying on historical trends to inform future strategies and economic forecasts.
Implications and Future Outlook
The robust growth in both U.S. direct investment abroad and foreign direct investment in the United States in 2025 signals a healthy global investment environment and a strong degree of confidence in the economic outlook of both the U.S. and its major trading partners. The continued dominance of European investment, both inbound and outbound, reinforces the deep and intricate economic relationship between the U.S. and Europe. The strong performance of the manufacturing sector, particularly in chemicals and electrical equipment, suggests ongoing investment in industrial capacity, technological advancement, and global supply chain resilience.
The BEA’s detailed data tables offer a granular view of these trends, allowing for in-depth analysis of specific country and industry dynamics. These resources are invaluable for understanding the complex web of global economic interdependence and for anticipating future investment patterns. The next release, scheduled for July 2027, will provide data for 2026, offering further insights into the evolving landscape of international direct investment. As global economic conditions continue to shift, these statistics will remain a critical tool for navigating the complexities of international commerce and investment.