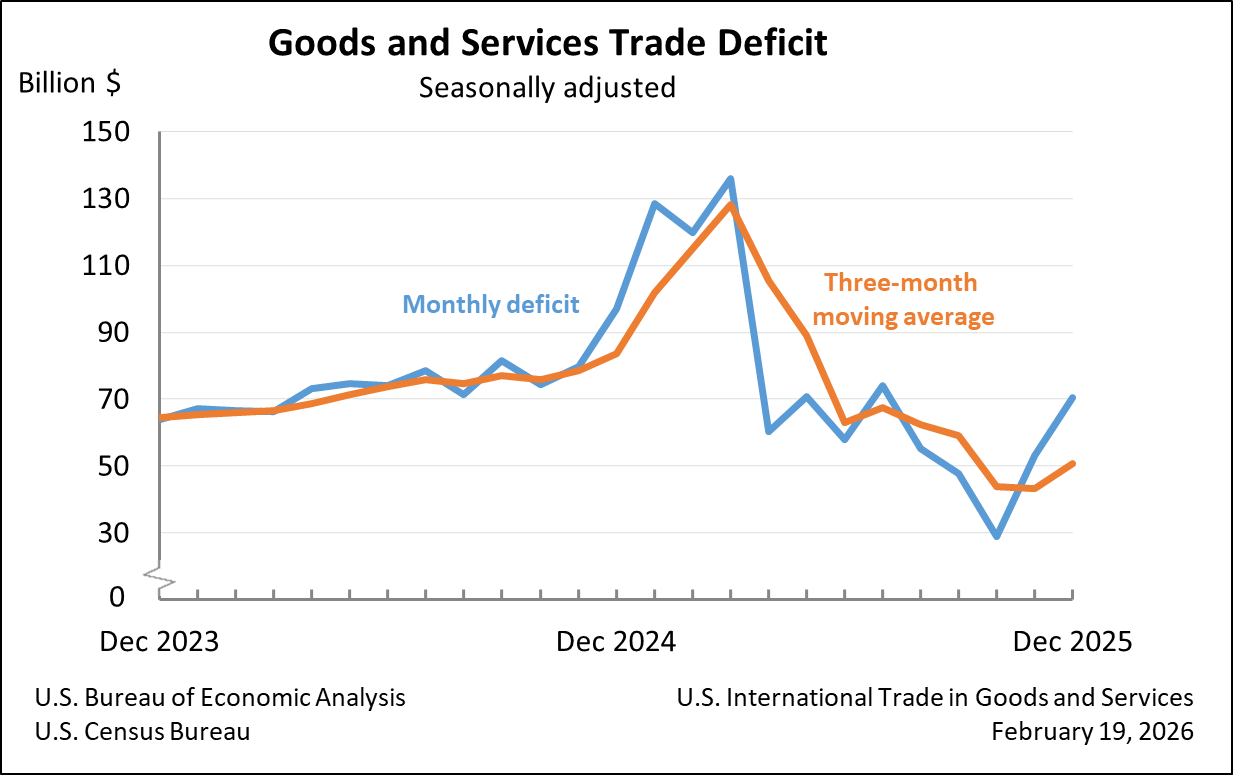
The U.S. international trade deficit in goods and services experienced a substantial increase in December, surging by $17.3 billion to $70.3 billion from a revised $53.0 billion in November. This widening gap underscores ongoing shifts in global trade patterns and economic activity, even as the annual deficit for 2025 saw a marginal decrease. The U.S. Census Bureau and the U.S. Bureau of Economic Analysis released these figures on February 19, 2026, alongside an errata notice indicating corrections to previously published statistics for "Total Balance of Payments Basis" and "Net Adjustments" for November, December, and the annual totals of 2025.
The December report reveals a complex interplay of export and import dynamics. Overall exports of goods and services declined by 1.7% to $287.3 billion, a decrease of $5.0 billion from November. Concurrently, imports rose by 3.6% to $357.6 billion, an increase of $12.3 billion compared to the previous month. This divergence directly contributed to the ballooning deficit.
December Trade Figures: A Deeper Dive
The significant jump in the goods and services deficit in December was primarily driven by an escalation in the goods deficit, which widened by $15.7 billion to $99.3 billion. This was partially offset by a decrease in the services surplus, which fell by $1.6 billion to $29.0 billion.
On a goods-only basis, exports saw a decline of $5.5 billion to $180.8 billion in December. This reduction was attributed to a $5.6 billion decrease in goods on a Census basis, with net balance of payments adjustments showing a modest increase of $0.1 billion. Conversely, imports of goods surged by $10.2 billion to $280.2 billion. This increase was entirely reflected in goods on a Census basis, which also rose by $10.2 billion, while net balance of payments adjustments for imports saw a minimal increase of less than $0.1 billion.
The services sector presented a different picture. Exports of services managed a slight increase of $0.5 billion to $106.5 billion in December. However, imports of services saw a more pronounced rise of $2.0 billion, reaching $77.4 billion. This differential growth in services trade contributed to the narrowing of the services surplus.
Real Goods Trade Reflects Inflationary Pressures
When adjusted for inflation, the real goods deficit, measured in 2017 dollars on a Census basis, increased by a significant 14.8%, or $12.5 billion, to $97.1 billion in December. This real goods deficit increase outpaced the nominal deficit’s growth of 19.0%, suggesting that while import volumes may have risen, the price impact on the deficit was also a considerable factor. This inflation-adjusted figure provides a clearer picture of the underlying volume changes in trade, indicating a substantial shift in the balance of physical goods exchanged.
Annual Trade Summary for 2025: A Year of Growth, Minor Deficit Reduction
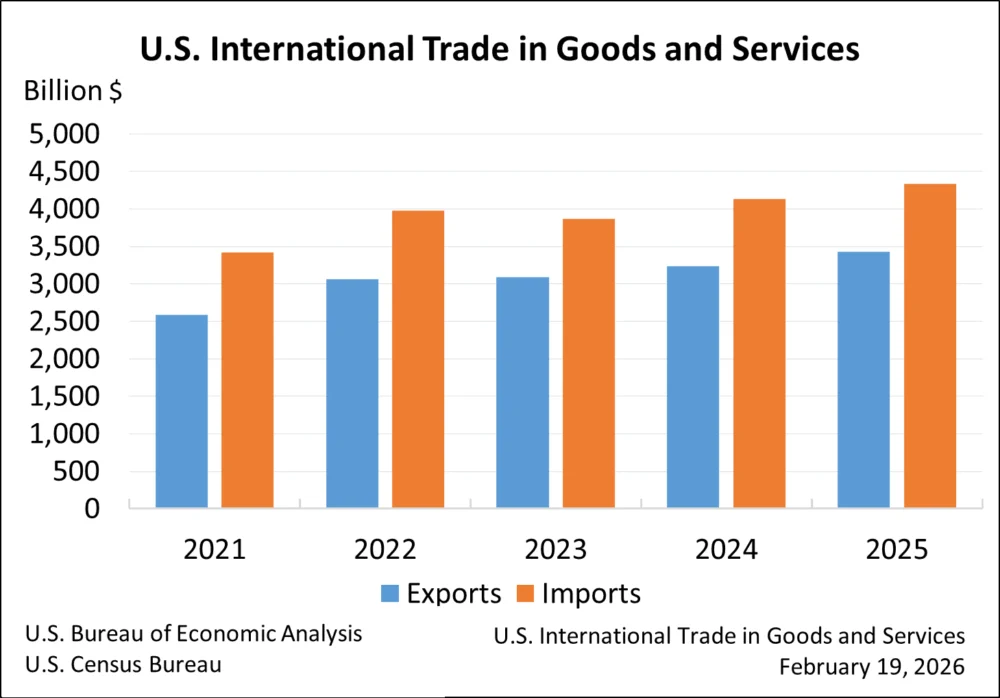
Looking at the full year 2025, the U.S. goods and services deficit stood at $901.5 billion. This represents a modest decrease of $2.1 billion from the $903.5 billion deficit recorded in 2024. The annual performance was characterized by robust growth in both exports and imports. Total exports for 2025 reached $3,432.3 billion, an increase of $199.8 billion (6.2%) compared to the previous year. Imports also climbed significantly, reaching $4,333.8 billion, a rise of $197.8 billion (4.8%).
The slight annual reduction in the overall deficit was the result of contrasting trends in goods and services trade. The deficit in goods widened by $25.5 billion, or 2.1%, to $1,240.9 billion. Simultaneously, the surplus in services expanded by $27.6 billion, or 8.9%, to $339.5 billion, effectively mitigating the increase in the goods deficit.
For the annual goods trade, exports climbed by $117.7 billion to $2,197.5 billion. Exports of goods on a Census basis saw a more substantial increase of $123.5 billion, with net balance of payments adjustments decreasing by $5.8 billion. Imports of goods experienced a considerable rise of $143.2 billion, reaching $3,438.4 billion. Imports of goods on a Census basis increased by $149.3 billion, while net balance of payments adjustments decreased by $6.1 billion.
In the services sector for 2025, exports grew by $82.1 billion to $1,234.9 billion. Imports of services also saw a significant increase, rising by $54.5 billion to $895.4 billion. This healthy growth in both services exports and imports contributed to the expansion of the services surplus.
The real goods deficit for 2025, adjusted for inflation, increased by $64.4 billion, or 5.7%, to $1,197.1 billion. This real deficit growth was notably higher than the 2.1% increase observed in the nominal goods deficit, indicating that a substantial portion of the nominal increase was driven by price changes rather than purely volume expansion.
Revisions and Data Integrity
The errata issued on February 19, 2026, at 3:30 p.m. EST, highlights the ongoing commitment to data accuracy by the U.S. Census Bureau and the U.S. Bureau of Economic Analysis. The corrections pertained to statistics for "Total Balance of Payments Basis" and "Net Adjustments" for November, December, and the annual totals of 2025. These revisions underscore the dynamic nature of economic data collection and the importance of regular updates to reflect the most precise figures.
Furthermore, the report notes that seasonally adjusted goods data for January through November 2025 were revised to ensure that the sum of the seasonally adjusted monthly totals precisely matches the annual totals. These comprehensive revisions are crucial for maintaining the integrity and consistency of the trade statistics, providing policymakers and market participants with reliable information for analysis and decision-making.
Trade Balances with Key Partners: Shifting Landscapes
The detailed breakdown of goods trade on a Census basis by country and area reveals distinct patterns. In December, the U.S. recorded trade surpluses with several key partners, including the Netherlands ($5.6 billion), South and Central America ($4.3 billion), the United Kingdom ($3.7 billion), Hong Kong ($2.5 billion), and Brazil ($2.1 billion). Significant surpluses were also observed with Belgium ($1.4 billion), Singapore ($1.1 billion), Saudi Arabia ($0.2 billion), Australia ($0.2 billion), and Switzerland ($0.1 billion).
Conversely, the U.S. faced substantial deficits with other major trading nations. Taiwan led with a deficit of $19.8 billion, followed by Vietnam ($17.6 billion), Mexico ($14.5 billion), and China ($12.4 billion). The European Union as a bloc registered a deficit of $11.1 billion. Other countries with notable deficits in December included Germany ($6.9 billion), South Korea ($5.8 billion), Japan ($5.3 billion), and India ($5.2 billion). Canada’s deficit stood at $4.9 billion, with further deficits recorded with Malaysia ($3.0 billion), Italy ($2.5 billion), France ($2.4 billion), Ireland ($2.0 billion), and Israel ($0.8 billion).
For the full year 2025, these country-specific balances painted a similar, albeit more pronounced, picture. The U.S. maintained significant surpluses with the Netherlands ($60.7 billion), South and Central America ($52.4 billion), the United Kingdom ($32.2 billion), Hong Kong ($28.5 billion), and Brazil ($14.4 billion).
The annual deficits were substantial, with the European Union ($218.8 billion) and China ($202.1 billion) leading the list. Mexico’s deficit reached $196.9 billion, and Vietnam’s was $178.2 billion. Taiwan’s deficit was $146.8 billion, followed by Ireland ($114.2 billion), Germany ($73.0 billion), Thailand ($71.9 billion), Japan ($63.9 billion), and India ($58.2 billion). South Korea’s deficit was $56.4 billion, and Canada’s was $46.4 billion. Other countries with significant annual deficits included Switzerland ($34.3 billion), Malaysia ($30.8 billion), Italy ($30.8 billion), Indonesia ($23.7 billion), France ($18.1 billion), Austria ($12.2 billion), and South Africa ($10.1 billion).
Impact of Federal Funding Lapse on Release Schedule
A notable aspect of the current release is the indication that the "Next release: To be determined," with the report being delayed due to a recent lapse in federal funding. This government shutdown has created uncertainty regarding the timely dissemination of crucial economic indicators. The U.S. Census Bureau and the U.S. Bureau of Economic Analysis are actively working to update their release schedules and are consulting with data suppliers to determine the availability of data necessary for producing these economic indicators. Updated release dates will be published on their respective websites, underscoring the challenges faced by government agencies in maintaining operational continuity during periods of fiscal uncertainty.
Evolving Trade Landscape and Policy Implications
The widening trade deficit in December, juxtaposed with a marginal annual improvement, signals a complex economic environment. While overall trade volume grew significantly in 2025, the increase in imports outpaced exports, leading to a larger goods deficit. The resilience of the services sector, which saw its surplus expand, provided a crucial counterweight.
The data also highlights the continued concentration of trade imbalances with specific partners. The persistent large deficits with China and the European Union, for instance, remain key areas of focus for policymakers. These figures will undoubtedly inform ongoing discussions about trade policy, tariff strategies, and efforts to rebalance the nation’s trade relationships.
The increase in both nominal and real goods deficits suggests that while import demand remained robust, inflationary pressures may have also played a role in exacerbating the deficit’s magnitude. This could present a challenge for the Federal Reserve in its efforts to manage inflation and maintain economic stability.
The announcement also included a change to the Euro Area grouping, which will now include Bulgaria following its adoption of the euro on January 1, 2026. This adjustment, while seemingly minor, reflects the dynamic nature of international economic integration and will impact future trade data presentations.
The U.S. Census Bureau and the U.S. Bureau of Economic Analysis are committed to providing transparent and accurate trade data. The errata and the clear communication regarding the impact of the federal funding lapse demonstrate this commitment. As the nation navigates evolving global economic conditions, these trade statistics will remain a critical barometer for understanding the health and direction of the U.S. economy. Stakeholders will be closely watching for the updated release schedule and future trade data to assess the continuing trends in U.S. international trade.