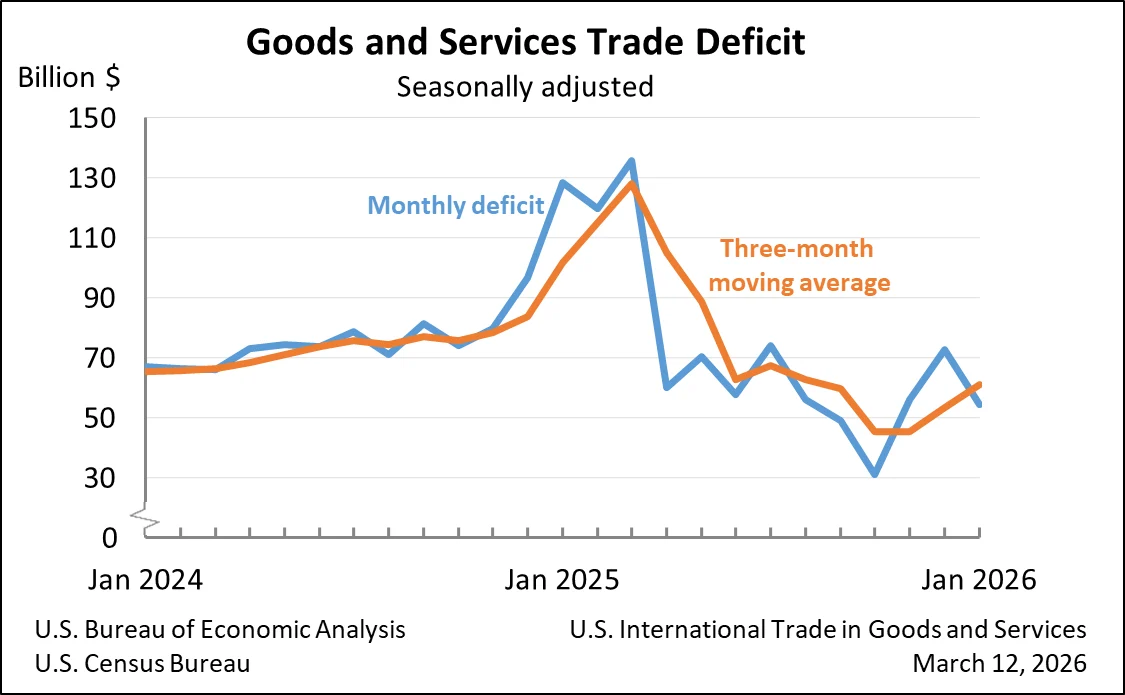
The United States experienced a notable contraction in its trade deficit for goods and services in January, as reported by the U.S. Census Bureau and the U.S. Bureau of Economic Analysis. The deficit narrowed to $54.5 billion, a substantial decrease of $18.4 billion from the revised $72.9 billion recorded in December. This marks a significant improvement in the nation’s trade balance, driven by both an increase in exports and a decrease in imports.
Key Figures Highlight Trade Balance Improvement
The January figures reveal a dynamic shift in U.S. international trade. The overall goods and services deficit for the month stood at $54.5 billion, representing a 25.3% reduction compared to the previous month. This improvement was largely fueled by a robust 5.5% increase in exports, which reached $302.1 billion. Conversely, imports saw a slight decline of 0.7%, totaling $356.6 billion.
Breaking down the deficit, the goods deficit experienced a significant reduction of $17.5 billion, settling at $81.8 billion. Concurrently, the services surplus expanded by $1.0 billion to $27.3 billion, further contributing to the overall positive trend in the trade balance.
Year-Over-Year Comparison Shows Deeper Trends
The positive trajectory observed in January is not merely a month-to-month fluctuation; it reflects a broader, more substantial improvement when viewed year-over-year. Compared to January of the previous year, the goods and services deficit has shrunk by an impressive $73.9 billion, a decline of 57.6%. This dramatic reduction underscores a sustained effort to rebalance trade flows.
Exports have demonstrated considerable strength on a year-over-year basis, increasing by $28.4 billion, or 10.4%. This indicates a growing demand for American products and services in the global marketplace. Simultaneously, imports have seen a notable decrease of $45.5 billion, or 11.3%, suggesting a moderation in domestic consumption of foreign goods or a shift towards domestically produced alternatives.
Analysis of Month-Over-Month Changes
The primary drivers behind the January deficit reduction were the divergent movements in goods and services trade. Exports of goods, a critical component of U.S. international trade, surged by $14.6 billion to reach $195.5 billion in January. This increase on a Census basis was $14.8 billion, with net balance of payments adjustments showing a minor decrease of $0.1 billion.
In contrast, imports of goods saw a contraction, decreasing by $2.8 billion to $277.3 billion. On a Census basis, goods imports declined by $3.0 billion, while net balance of payments adjustments experienced a slight increase of $0.1 billion. The combined effect of rising goods exports and falling goods imports significantly narrowed the goods deficit.
On the services front, exports continued their upward trend, increasing by $1.2 billion to $106.7 billion. Imports of services also saw a modest rise of $0.2 billion, reaching $79.3 billion. While the services sector contributed positively to the overall balance, its impact on the deficit reduction was less pronounced than that of the goods sector.
Real vs. Nominal Trade Deficit
Further insights into the trade balance can be gained by examining real goods trade, adjusted for inflation. The real goods deficit, calculated in 2017 dollars on a Census basis, decreased by $14.0 billion, or 14.3%, to $83.9 billion in January. This real decline was slightly less pronounced than the 18.0% decrease observed in the nominal goods deficit, indicating that while the volume of goods traded contributed to the improvement, price effects also played a role.
Revisions and Data Integrity
The U.S. Census Bureau and the Bureau of Economic Analysis also announced revisions to previously released data for July through December 2025. These revisions incorporated more comprehensive and updated quarterly and monthly data, ensuring the accuracy and reliability of the trade statistics. Furthermore, seasonally adjusted data for all months of 2025 were revised to align the monthly totals with the annual figures, a standard procedure to maintain data consistency. These revisions are crucial for providing a clear and accurate picture of trade trends over time.
Shifting Trade Relationships: Country-Specific Data
The detailed breakdown of trade by country offers a granular view of the U.S.’s international commercial relationships. In January, the U.S. recorded trade surpluses in goods with several key partners. Notable among these were the United Kingdom ($7.0 billion), the Netherlands ($6.4 billion), and South and Central America ($4.5 billion). Other countries with which the U.S. maintained a goods surplus included Switzerland ($3.0 billion), Hong Kong ($3.0 billion), Saudi Arabia ($2.2 billion), Brazil ($1.8 billion), Singapore ($1.7 billion), Australia ($1.7 billion), and Belgium ($0.9 billion).
Conversely, the U.S. faced significant trade deficits in goods with several major economies. Vietnam ($19.0 billion), Taiwan ($17.3 billion), Mexico ($12.8 billion), and China ($12.5 billion) were among the countries with the largest goods deficits. Other countries with whom the U.S. experienced goods deficits included the European Union ($6.1 billion), South Korea ($6.0 billion), Japan ($5.5 billion), Germany ($4.9 billion), Italy ($3.3 billion), Malaysia ($3.2 billion), India ($2.8 billion), Canada ($2.7 billion), Ireland ($2.4 billion), France ($1.5 billion), and Israel ($0.7 billion).
Quarterly data on goods and services trade by country and area, which are released with a one-month lag, revealed fourth-quarter figures for 2025. In the fourth quarter, the U.S. held surpluses with Switzerland ($24.1 billion), the Netherlands ($21.0 billion), South and Central America ($19.6 billion), and the United Kingdom ($15.9 billion). Surpluses were also recorded with Brazil ($14.2 billion), Singapore ($10.1 billion), Ireland ($10.0 billion), Hong Kong ($7.2 billion), Australia ($6.6 billion), Belgium ($3.9 billion), and Saudi Arabia ($3.3 billion).
The fourth-quarter deficits were concentrated with Taiwan ($50.7 billion), Mexico ($49.5 billion), Vietnam ($47.7 billion), and China ($31.7 billion). Other countries with significant deficits included Germany ($21.6 billion), India ($13.4 billion), Japan ($10.8 billion), South Korea ($9.4 billion), Malaysia ($7.9 billion), France ($7.5 billion), Italy ($7.5 billion), the European Union ($4.5 billion), Canada ($4.3 billion), and Israel ($2.3 billion).
Three-Month Moving Averages Offer Smoother Trend Analysis
To provide a less volatile perspective on trade trends, three-month moving averages are often utilized. For the three months ending in January, the average goods and services deficit increased by $7.8 billion to $61.1 billion. This suggests that while the most recent month showed a significant improvement, the average over a slightly longer period indicates a more moderate trend.
However, when viewed year-over-year, the average goods and services deficit for the three months ending in January demonstrated a substantial decrease of $40.6 billion compared to the same period in the previous year. This reinforces the notion of a sustained improvement in the U.S. trade balance over a broader timeframe.
Broader Economic Implications and Context
The shrinking trade deficit in January is likely to be viewed positively by policymakers and economists. A lower deficit can indicate increased competitiveness of domestic industries, as evidenced by rising exports, and potentially a more balanced approach to consumption and production within the U.S. economy.
Historically, persistent trade deficits have been a subject of debate, with concerns raised about their potential impact on national debt, employment, and currency valuations. Reductions in the deficit, particularly those driven by export growth, can be seen as a sign of economic strength and a more favorable international trade position.
The January figures suggest a potential shift in global demand and supply dynamics. The increase in U.S. exports could be attributed to a variety of factors, including a more favorable exchange rate for American products, robust global economic growth in key markets, or successful trade promotion initiatives. The decrease in imports may reflect a combination of factors such as stronger domestic production, changes in consumer preferences, or potential impacts of tariffs and trade policies.
Upcoming Data Releases and Revisions
The U.S. Census Bureau and BEA will release the next report on U.S. International Trade in Goods and Services for February 2026 on April 2, 2026. This upcoming release will provide further insight into whether the positive trends observed in January are sustained.
Additionally, significant revisions to trade statistics are scheduled for June 9, 2026. These revisions will encompass trade in goods on both Census and balance of payments (BOP) bases beginning in 2021, and trade in services beginning in 1999. These comprehensive updates are crucial for refining historical data and ensuring the accuracy of long-term economic analysis.
Notice on Euro Area Inclusion
A notable change affecting trade statistics beginning with January 2026 is the inclusion of Bulgaria in the "Euro Area" grouping. This adjustment follows Bulgaria’s adoption of the euro as its currency and will impact specific exhibits within the U.S. International Trade in Goods and Services report. This standardization aims to align trade data with evolving currency unions and economic blocs.
The ongoing monitoring and analysis of U.S. international trade data remain critical for understanding the nation’s economic health and its role in the global economy. The January report provides a promising indication of a narrowing trade deficit, driven by a resurgent export sector and moderated import activity.