Lana Rhoades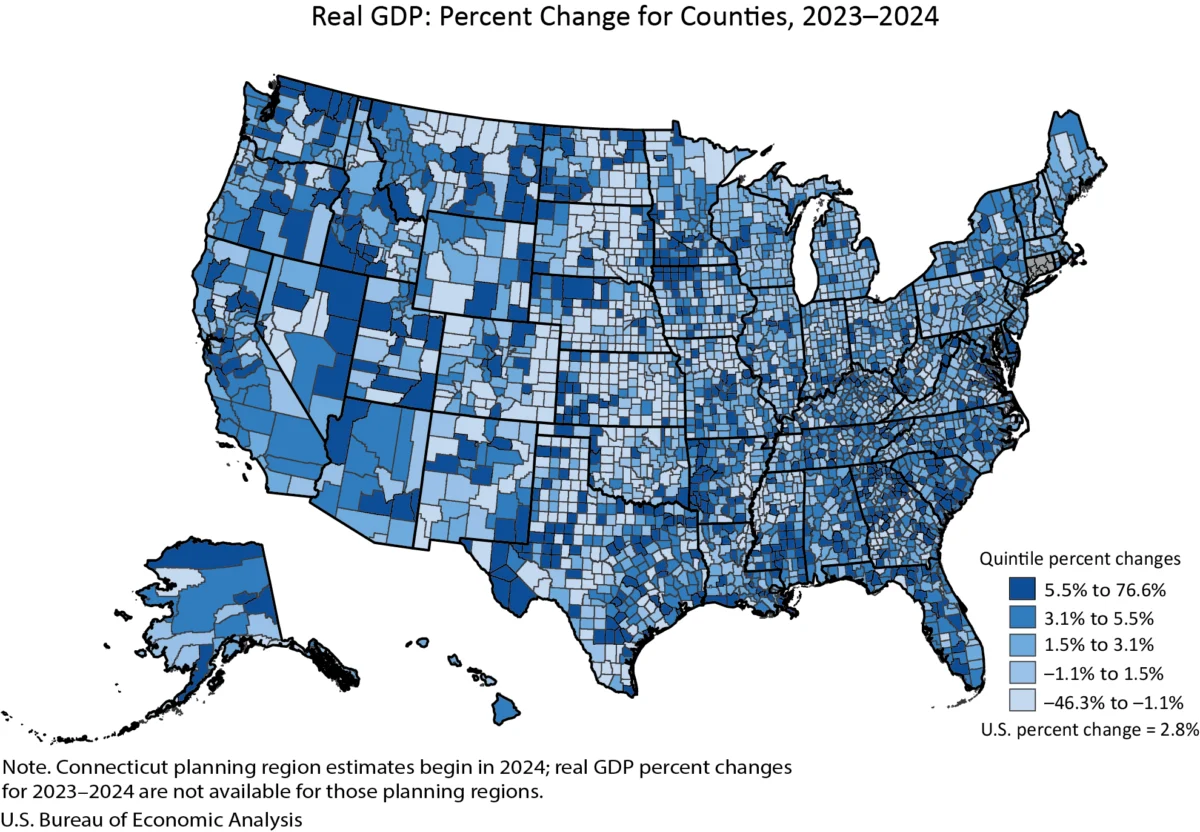
County Economies Show Divergent Growth in 2024, Driven by Shifting Economic Landscapes
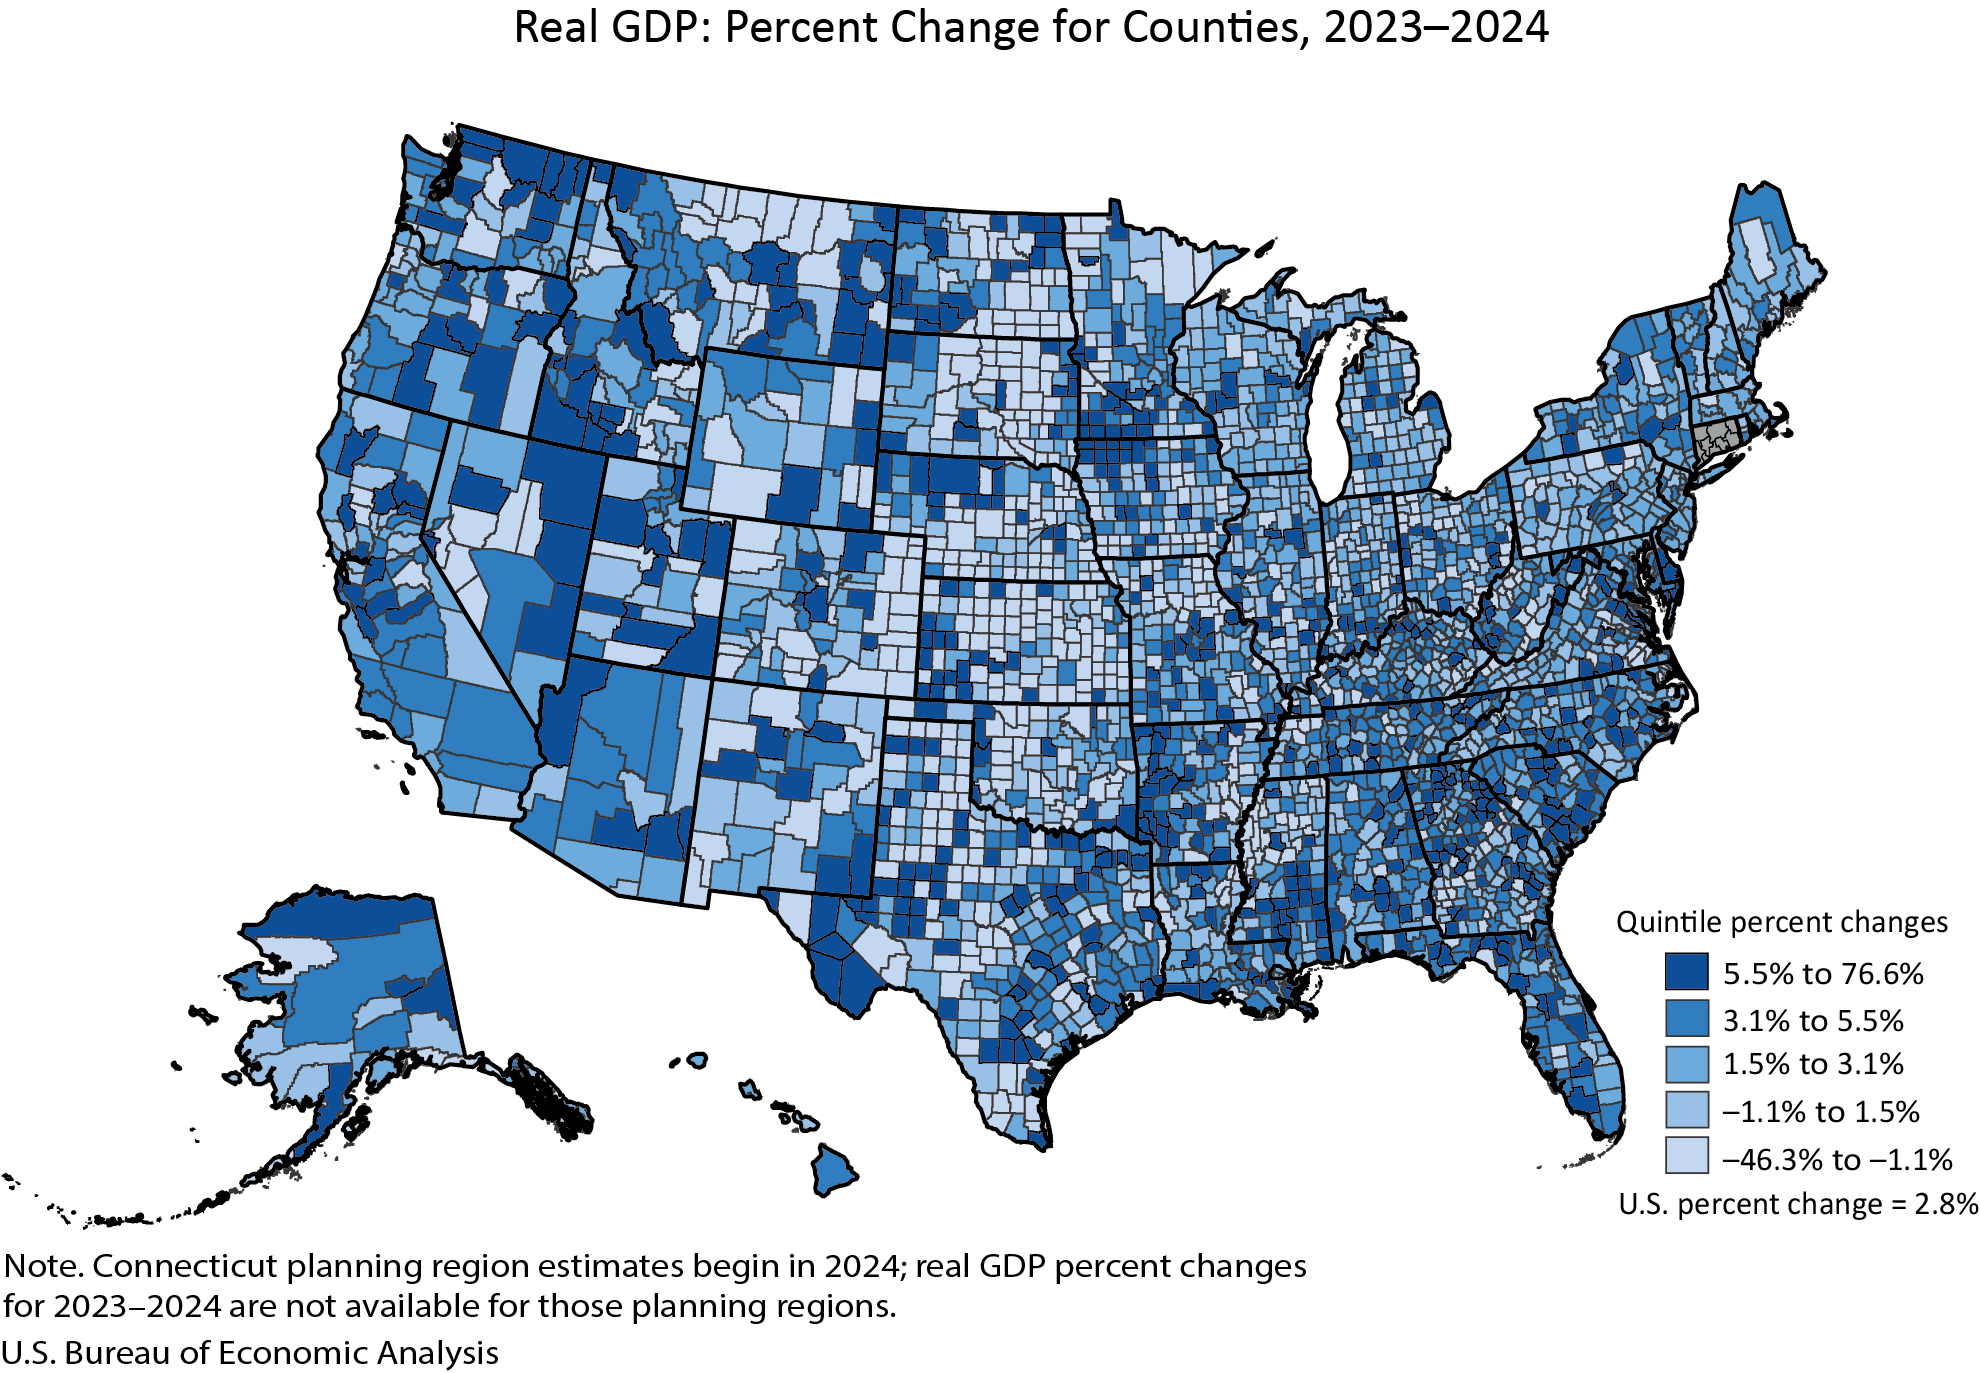
The economic pulse of the United States in 2024 revealed a nation of varied fortunes at the county level, with real gross domestic product (GDP) experiencing growth in a substantial majority of the nation’s counties, while a significant minority saw their economic output contract. According to the latest estimates released by the U.S. Bureau of Economic Analysis (BEA), a total of 2,273 counties, or approximately 73% of all counties, registered an increase in real GDP. Conversely, 809 counties, representing about 26%, experienced a decrease, and a mere 24 counties remained economically stagnant. This dynamic picture underscores the localized nature of economic performance and highlights the diverse factors influencing growth and decline across different regions.
The range of economic performance at the county level was exceptionally broad. Carter County, Montana, emerged as a notable success story, boasting a remarkable 76.6 percent surge in its real GDP. This extraordinary growth suggests a significant economic boom within the county, likely fueled by specific industry expansions or resource-based economic activity. On the other end of the spectrum, Baca County, Colorado, faced significant economic headwinds, with its real GDP declining by a steep 46.3 percent. This substantial contraction points to considerable challenges within the county’s economic base, potentially linked to industry downturns, population loss, or a combination of adverse factors.
Understanding the Metrics: GDP and Personal Income
Real GDP serves as a crucial barometer of economic health, measuring the inflation-adjusted value of all goods and services produced within a specific geographic area. For counties, this metric provides a granular view of local economic output and activity. The BEA’s annual estimates offer a vital snapshot of these localized economic trends, allowing for comparisons across different regions and over time.
Beyond GDP, personal income, measured in current dollars, offers another critical insight into the economic well-being of residents. This metric encompasses all income received by individuals from all sources, including wages, salaries, proprietors’ income, and transfer payments. The BEA’s analysis of personal income trends by county reveals how the financial fortunes of individuals are faring across the nation.
In 2024, personal income followed a similar, though slightly more positive, trend to GDP. A considerable 2,768 counties, or approximately 88%, saw an increase in personal income. In contrast, 331 counties, about 11%, experienced a decline, and only 7 counties reported no change. The percent change in personal income ranged from a robust 22.6 percent increase in Harding County, South Dakota, to a notable 23.3 percent decline in Issaquena County, Mississippi. This suggests that while many individuals saw their incomes rise, some counties grappled with significant decreases in residents’ earnings.
Geographic and Demographic Variations in Economic Performance
The BEA’s data also highlights the significant disparities in the sheer scale of economic activity across U.S. counties. In 2024, New York County, New York (Manhattan), stood as an economic titan, with its real GDP reaching an astronomical $813.7 billion. This figure underscores its position as a global financial and commercial hub. In stark contrast, Issaquena County, Mississippi, represented the other end of the economic spectrum, with a total real GDP of just $15.7 million. This vast difference in economic scale illustrates the profound inequalities in economic resources and output that exist between different parts of the United States.
The newly released data also provides a breakdown of economic trends by county population size, offering a more nuanced understanding of how different types of communities are faring.
County Real GDP Highlights, by Population Size, 2024
| Category | Large Counties (> 500,000) | Medium Counties (100,000-500,000) | Small Counties (< 100,000) |
|---|---|---|---|
| Trends (Growth/Decline/No Change) | 145 / 0 / 1 | 451 / 20 / 3 | 1,677 / 789 / 20 |
| Trend Range (% Change) | 10.7% (Pinal, AZ) to 0.0% (Johnson, KS) | 12.4% (Jefferson, TX) to -2.6% (Black Hawk, IA) | 76.6% (Carter, MT) to -46.3% (Baca, CO) |
| Size Range (2017 Chained Dollars) | $813.7B (New York, NY) to $12.7B (Pinal, AZ) | $46.6B (Mercer, NJ) to $2.6B (Liberty, TX) | $15.1B (Martin, TX) to $15.7M (Issaquena, MS) |
Analysis of County GDP Trends by Population Size:
- Large Counties: These counties, defined as having a population over 500,000, exhibited remarkable economic resilience in 2024. Out of 146 such counties analyzed, an overwhelming 145 experienced GDP growth, with only one county showing no change and none experiencing a decline. This suggests that the economic engines of major metropolitan areas continue to be robust, benefiting from diverse industries, large labor pools, and significant consumer markets. Pinal County, Arizona, led this group with a 10.7% increase, indicating strong expansionary forces at play.
- Medium Counties: Counties with populations between 100,000 and 500,000 also demonstrated broad-based growth, although with a slightly higher incidence of decline. Of the 474 medium-sized counties, 451 saw their GDP rise, while 20 experienced a contraction. Jefferson County, Texas, recorded the highest growth at 12.4%, highlighting localized economic strengths.
- Small Counties: The economic landscape for smaller counties, those with populations under 100,000, was the most varied. Among the 2,486 small counties, 1,677 experienced GDP growth. However, this category also accounted for the vast majority of counties that saw their economies shrink, with 789 counties registering a decline. This dichotomy is vividly illustrated by the extreme ranges observed: Carter County, Montana, with its exceptional 76.6% growth, and Baca County, Colorado, with its substantial 46.3% decline, both fall within this category. This suggests that smaller counties are more susceptible to significant economic swings, often driven by the fortunes of a few key industries or businesses.
County Personal Income Highlights, by Population Size, 2024
| Category | Large Counties (> 500,000) | Medium Counties (100,000-500,000) | Small Counties (< 100,000) |
|---|---|---|---|
| Trends (Growth/Decline/No Change) | 146 / 0 / 0 | 474 / 0 / 0 | 2,148 / 331 / 7 |
| Trend Range (% Change) | 9.7% (San Joaquin, CA) to 2.7% (Philadelphia, PA) | 10.9% (Merced, CA) to 1.6% (Genesee, MI) | 22.6% (Harding, SD) to -23.3% (Issaquena, MS) |
| Size Range (Current Dollars) | $818.5B (Los Angeles, CA) to $26.1B (Pinal, AZ) | $62.5B (Collier, FL) to $4.9B (Floyd, GA) | $12.4B (Teton, WY) to $10.6M (Loving, TX) |
Analysis of County Personal Income Trends by Population Size:
- Large Counties: Similar to GDP, large counties demonstrated exceptional strength in personal income growth, with all 146 analyzed counties showing increases. San Joaquin County, California, saw the highest growth at 9.7%.
- Medium Counties: Medium-sized counties also exhibited widespread income growth, with all 474 counties reporting increases. Merced County, California, led this group with a 10.9% rise.
- Small Counties: While the majority of small counties experienced personal income growth (2,148 counties), this category also accounted for all reported declines in personal income (331 counties) and the majority of counties with no change (7 counties). Harding County, South Dakota, recorded the highest income growth at 22.6%, while Issaquena County, Mississippi, faced a significant income decline of 23.3%. This reinforces the observation that smaller economies can experience more pronounced swings in individual financial well-being.
Context and Chronology of BEA Data Releases
The release of these county-level GDP and personal income estimates for 2024 is part of a broader annual update by the Bureau of Economic Analysis. This update is critical for providing policymakers, businesses, and the public with the most current and accurate picture of the nation’s economic landscape.
The BEA’s methodology involves rigorous data collection and revision processes. The 2024 estimates incorporate the results of the BEA’s annual updates to GDP and personal income by county, which were released concurrently. Importantly, the estimates for the period of 2020 to 2023 have also been revised. These revisions are a standard practice for the BEA, aimed at incorporating new and more complete source data as it becomes available. This ensures that the historical data aligns with the most up-to-date national and state-level economic accounts. The revisions for county data are particularly significant as they are aligned with the annual update to the National Income and Product Accounts (NIPA) released on September 25, 2025, and the annual update to personal income and GDP by state statistics released on September 26, 2025. This synchronized approach ensures consistency and comparability across different levels of economic reporting.
A notable change in the presentation of this year’s data is the consolidation of county GDP and personal income statistics into a single news release for the first time. Previously, these were issued as separate releases on different days. This new combined format aims to provide a more comprehensive and holistic view of county economies, enhancing efficiency and reducing redundancy for data users.
Shifts in Geographic Definitions and Data Discontinuation
The BEA is also adapting its reporting to reflect evolving geographic and statistical practices. Beginning with the 2024 estimates of GDP and personal income, Connecticut’s economic data will be presented using its planning region geographic definitions, rather than its traditional county definitions. This shift acknowledges the administrative structures within the state. However, because these planning region estimates are only available for 2024, they are not included in the percent change ranges presented in this release, as they cannot be compared to prior county-based data.
Furthermore, the BEA has announced the discontinuation of publication for statistics related to various metropolitan and micropolitan statistical areas, including metropolitan divisions, combined statistical areas, and their metropolitan and nonmetropolitan portions. While GDP and personal income estimates will continue to be published at the county level, the aggregation of data for these specific statistical area definitions is ceasing. This decision, detailed in a BEA FAQ, reflects a strategic refocusing of reporting on the granular county data.
Implications and Broader Economic Context
The divergent trends observed in county-level GDP and personal income have several potential implications for regional economic development and national policy. The strong performance of large counties suggests a continued concentration of economic activity and opportunity in metropolitan centers. This can exacerbate regional disparities and pose challenges for rural and smaller urban areas seeking to attract investment and retain talent.
The significant variations within small counties highlight the need for tailored economic strategies. Factors such as diversification of local economies, investment in infrastructure, support for small businesses, and workforce development initiatives can play a crucial role in mitigating economic decline and fostering growth in these areas. The extreme growth in counties like Carter, Montana, and the steep declines in places like Baca County, Colorado, underscore the vulnerability of economies heavily reliant on specific sectors, whether they be natural resources, manufacturing, or agriculture.
The BEA’s commitment to updating its data and refining its presentation methods, such as the combined news release and the move to interactive data applications, demonstrates an effort to make economic information more accessible and user-friendly. The availability of historical data through BEA’s Interactive Data Application and Data Archive ensures that researchers and analysts can conduct in-depth studies of economic trends over time.
Future Outlook and Data Availability
The next release of county GDP and personal income statistics from the BEA is scheduled for December 2, 2026, at 8:30 a.m. EST, covering the 2025 data. With that release, the 2024 data will be superseded, and the links provided to the Interactive Data Application will be updated to reflect the latest figures. For those seeking to access the original 2024 data featured in this release after it has been superseded, the BEA’s Data Archive will serve as the repository.
The BEA’s comprehensive data releases, including the detailed county-level statistics, provide an indispensable foundation for understanding the intricate tapestry of the American economy. These reports empower informed decision-making for policymakers, investors, and community leaders alike as they navigate the ever-evolving economic landscape of the United States. The ongoing collection and dissemination of this granular economic data are fundamental to fostering sustainable and inclusive economic growth across all regions of the nation.