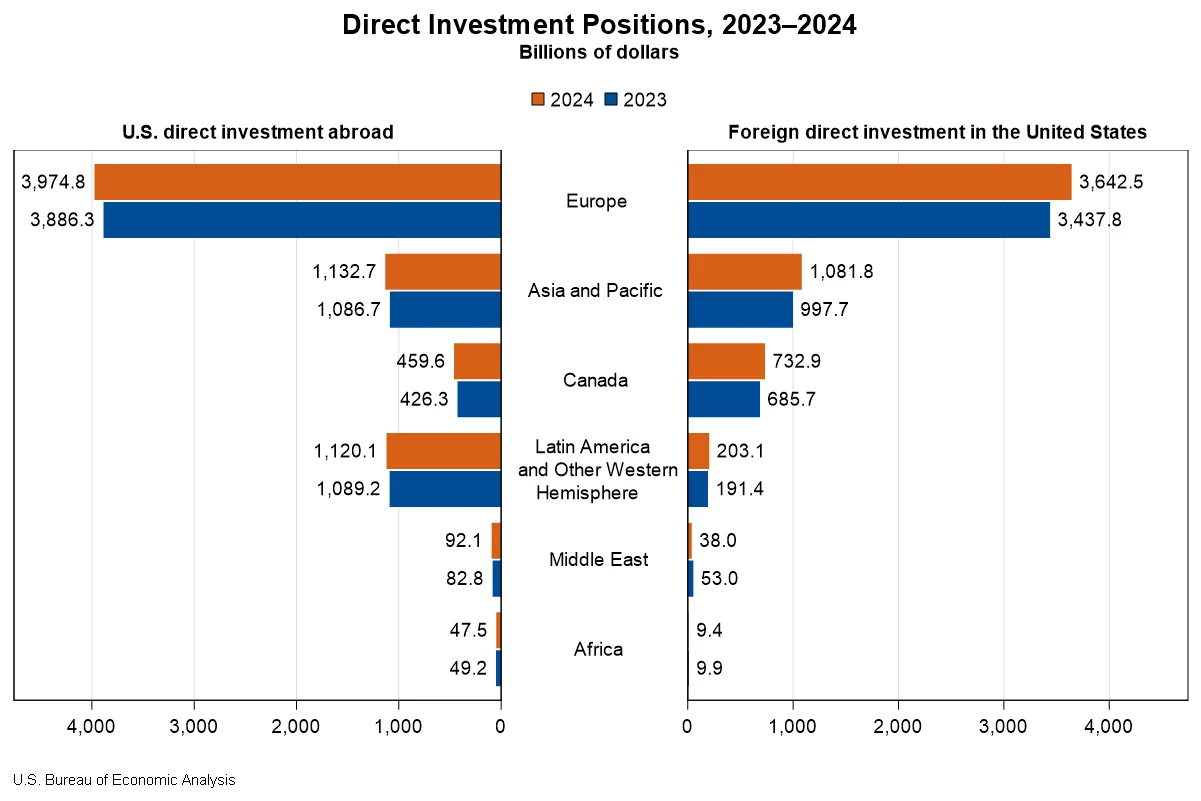
The United States experienced a significant expansion in its international investment landscape throughout 2024, with both outward and inward direct investment positions showing robust growth. According to the latest statistics released by the U.S. Bureau of Economic Analysis (BEA), the cumulative level of U.S. direct investment abroad climbed by $206.3 billion to a substantial $6.83 trillion by the close of the year. Concurrently, foreign direct investment (FDI) in the United States also saw a considerable increase, rising by $332.1 billion to reach $5.71 trillion. These figures underscore the dynamic nature of global capital flows and the United States’ central role in international economic activity.
Key Drivers of Outward U.S. Investment
The surge in U.S. direct investment abroad was largely propelled by increased activity in Europe, which saw a $88.4 billion expansion in the U.S. investment position. Within Europe, Luxembourg and Germany were identified as primary destinations for this outward capital. This growth in European investment reflects a strategic diversification by U.S. multinational enterprises (MNEs) and a continued confidence in the economic stability and market opportunities within key European economies.
Manufacturing affiliates played a pivotal role in this expansion, particularly those engaged in the production of computers and electronic products. This suggests a continued global demand for advanced technology and a strategic positioning of U.S. companies to meet that demand through their overseas operations. The manufacturing sector has historically been a cornerstone of U.S. foreign direct investment, and its continued prominence highlights the sector’s global reach and importance to the U.S. economy.
Top Destinations for U.S. Overseas Investment
While U.S. MNEs invest across a vast array of countries, a significant portion of the total U.S. direct investment abroad is concentrated in a few key nations. At the end of 2024, the United Kingdom remained the leading destination, with a U.S. direct investment position of $1,024.6 billion. The Netherlands followed closely with $1,012.0 billion, and Luxembourg secured the third spot with $569.6 billion. Singapore ($467.6 billion) and Ireland ($466.8 billion) rounded out the top five, indicating a strong preference for established economic hubs with favorable business environments and access to global markets.
Industry Breakdown of U.S. Outward Investment
By industry, holding companies accounted for the largest share of the overall U.S. direct investment abroad position, representing 47.3 percent in 2024. This indicates a strategic use of holding structures for managing international assets and operations. Manufacturing affiliates ranked second, comprising 16.0 percent of the total, reinforcing the earlier observation about the manufacturing sector’s contribution. Finance and insurance affiliates were third, with 14.2 percent of U.S. investment abroad, showcasing the global footprint of U.S. financial services.
When examining the investment from the perspective of the U.S. parent company’s industry, manufacturing MNEs were the most significant investors, accounting for 50.9 percent of the total position abroad. This was followed by MNEs in the finance and insurance sectors, which represented 15.1 percent of the investment. This dual perspective highlights both the industries that are receiving investment overseas and the industries that are driving that investment.
Income Generated from U.S. Direct Investment Abroad
In 2024, U.S. MNEs generated substantial income from their cumulative investments abroad, totaling $601.9 billion. This represents a 3.8 percent increase compared to the previous year, signaling a healthy return on foreign assets. The finance and insurance sector experienced the most significant growth in income, with a $12.0 billion increase, marking a 17.6 percent rise from 2023. This robust income generation underscores the profitability of U.S. overseas operations and their contribution to the U.S. balance of payments.
Growth in Foreign Direct Investment in the United States
The United States continues to be an attractive destination for foreign capital, as evidenced by the significant increase in FDI. The total position of foreign direct investment in the U.S. grew by $332.1 billion to $5.71 trillion by the end of 2024. Europe was again a major contributor to this inflow, with a $204.7 billion increase in investment. Notable contributions within Europe came from the United Kingdom ($52.9 billion increase) and Germany ($39.7 billion increase).
Top Sources of Foreign Investment in the U.S.
By country of the foreign parent, Japan emerged as the leading investor in the United States, with a position of $754.1 billion at the end of 2024. The United Kingdom followed with $742.7 billion, with Canada and the Netherlands also holding substantial positions at $732.9 billion and $726.4 billion, respectively. These figures illustrate the diverse global interest in the U.S. market.
An analysis based on the country of the ultimate beneficial owner (UBO) provides a more nuanced view. On this basis, Japan remained the top investing country with $819.2 billion, followed by Canada ($811.7 billion) and Germany ($677.3 billion). The divergence in figures between the "country of foreign parent" and "country of UBO" for nations like the Netherlands and Luxembourg suggests that a portion of investment originating from these countries is ultimately controlled by entities in other nations, highlighting complex global ownership structures.
Industry Distribution of FDI in the U.S.
The U.S. manufacturing sector was the primary recipient of foreign direct investment, accounting for 42.3 percent of the total FDI position. Within manufacturing, chemical manufacturing represented a significant portion, with an investment of $827.5 billion, approximately one-third of the total manufacturing FDI. The finance and insurance sector also attracted substantial foreign investment, with $599.4 billion, followed by wholesale trade with $520.5 billion. This concentration indicates that foreign investors are particularly drawn to key industrial and service sectors within the U.S. economy.
Income Earned by Foreign Investors in the U.S.
Foreign MNEs earned $310.9 billion in income on their cumulative investments in the United States during 2024, marking a significant 13.1 percent increase from 2023. This substantial income generation underscores the profitability of foreign-owned businesses operating within the U.S. and their contribution to the U.S. economy through employment, innovation, and tax revenues.
Revisions to Historical Data
The BEA also released revised statistics for 2022 and 2023, incorporating newly available and updated source data. For U.S. direct investment abroad, the 2022 position was revised to $6,245 billion from a previously published $6,313 billion, and the 2023 position was revised to $6,620 billion from $6,676 billion. Similarly, foreign direct investment in the United States for 2022 was revised to $5,124 billion from $5,167 billion, and for 2023, it was revised to $5,376 billion from $5,394 billion. These revisions are a standard part of economic data collection, reflecting the ongoing refinement of statistical information.
Implications for the U.S. Economy
The dual expansion of both U.S. direct investment abroad and foreign direct investment in the U.S. signals a robust and interconnected global economic environment. For the U.S., outward investment can foster technological advancement, create demand for U.S. exports of capital goods and services, and generate income that flows back to the domestic economy. Simultaneously, inward FDI brings capital, jobs, expertise, and innovation into the United States, bolstering economic growth and competitiveness.
The continued strength of manufacturing as a recipient of FDI, particularly in areas like chemical production, suggests ongoing global demand for U.S. industrial capacity and technological prowess. The dominance of holding companies in U.S. outward investment points to sophisticated corporate strategies for international operations and tax management.
The BEA’s detailed data tables, accessible through its Interactive Data Application and supplemental data, provide an invaluable resource for policymakers, businesses, and researchers seeking to understand the intricacies of global capital flows. These statistics are crucial for informing economic policy, guiding investment decisions, and assessing the health of the U.S. economy within the broader global context. The ongoing refinement of these figures through periodic revisions ensures that the data remains as accurate and comprehensive as possible, providing a solid foundation for economic analysis and forecasting.
The BEA’s commitment to providing detailed breakdowns by country and industry allows for a granular understanding of investment patterns. For instance, the significant investment in European countries like Luxembourg and Germany for U.S. outward investment, and the strong presence of Japanese and UK investors in the U.S., highlight key bilateral economic relationships. Similarly, the concentration of FDI in U.S. manufacturing and finance underscores the sectors that are most attractive to foreign capital.
The income generated from these investments also plays a critical role in the U.S. balance of payments. The increase in income from both outward and inward investments suggests a healthy return on capital for both U.S. entities operating abroad and foreign entities investing in the U.S., contributing positively to international trade balances.
The discontinuation of certain detailed tables, while potentially impacting specific historical data analysis, is a common practice as statistical agencies adapt to evolving data needs and reporting capabilities. The archiving of these tables ensures that historical information remains accessible for research purposes. The continued availability of comprehensive data in interactive formats and downloadable spreadsheets facilitates in-depth analysis for a wide range of stakeholders.
Looking ahead, the BEA’s next release, scheduled for July 2026, will provide data for 2025, offering further insights into the evolving landscape of U.S. direct investment and foreign direct investment in the United States. These regular updates are essential for tracking economic trends and understanding the dynamic interplay of global capital markets. The data presented for 2024 paints a picture of a robust and active international investment environment, with the United States firmly at its center.