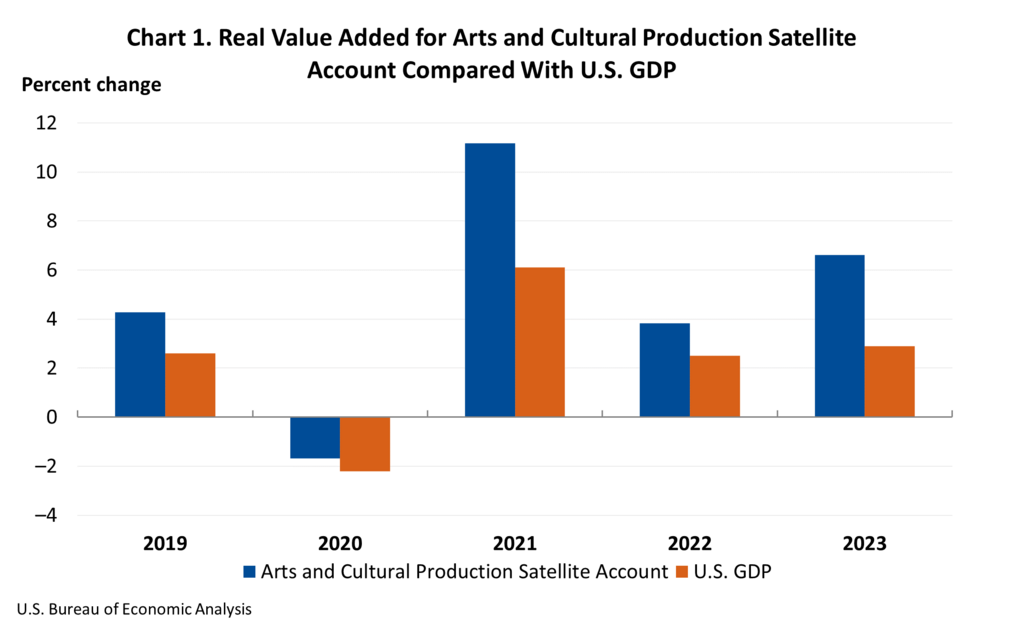
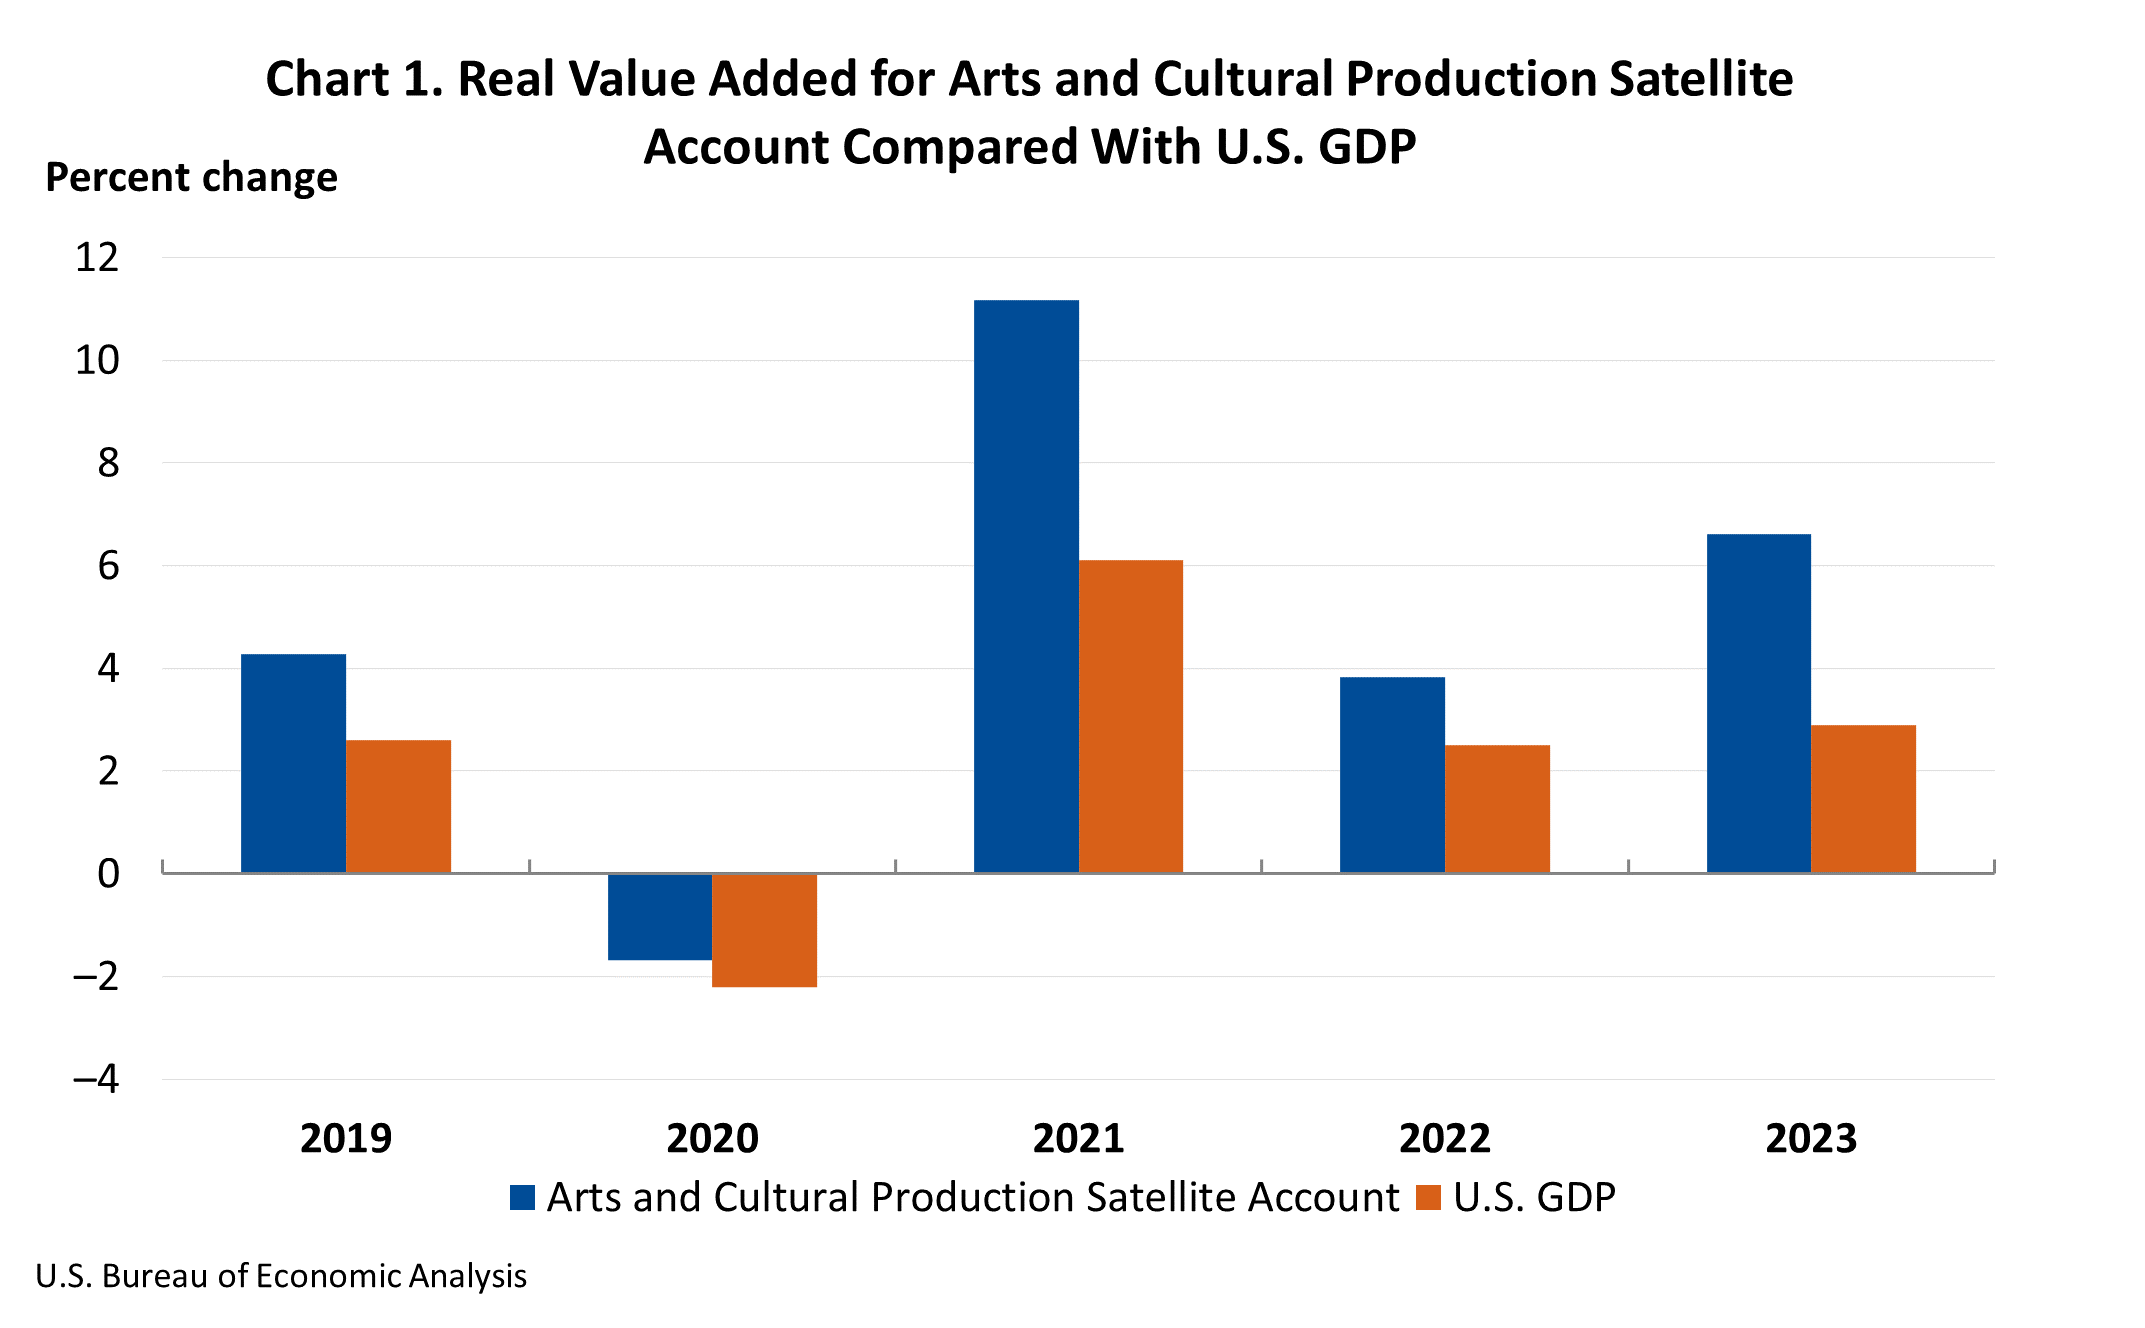
The U.S. Bureau of Economic Analysis (BEA) today released its comprehensive Arts and Cultural Production Satellite Account, revealing a sector that not only outpaced the broader economy in growth but also solidified its substantial contribution to national economic output. In 2023, arts and cultural economic activity, after accounting for inflation, surged by 6.6 percent, building on a strong 3.8 percent increase in 2022. This robust expansion stands in stark contrast to the overall U.S. economy, which saw its real Gross Domestic Product (GDP) grow by 2.9 percent in 2023, following a 2.5 percent rise in the preceding year. The arts and cultural sector’s significant economic footprint was underscored by its accounting for 4.2 percent of the nation’s total GDP in 2023, translating to a staggering $1.17 trillion in economic value.
This latest report from the BEA, a key agency within the U.S. Department of Commerce, provides an in-depth look at the economic performance of industries directly and indirectly involved in the creation and distribution of arts and cultural goods and services. The data reflects a dynamic sector that is increasingly recognized for its economic vitality and its role as a significant employer and contributor to national wealth. The satellite account methodology, which isolates and measures the economic impact of specific sectors, allows for a more granular understanding of how arts and culture are woven into the fabric of the American economy.
Core and Supporting Industries Drive Expansion
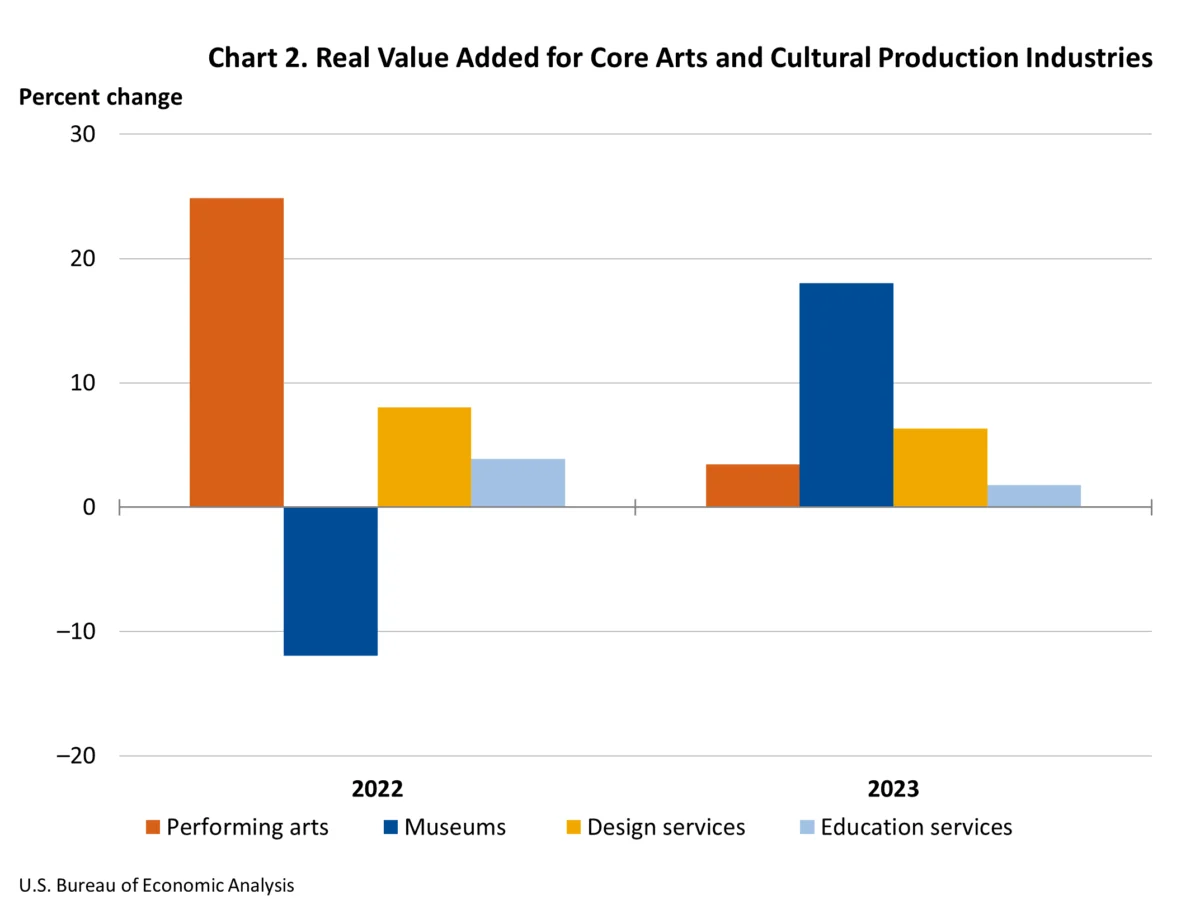
The growth within the arts and cultural sector is not monolithic, with distinct contributions from its core and supporting industries. Core arts and cultural production industries, encompassing performing arts, museums, design services, and fine arts and education services, experienced a substantial increase in real value added of 5.5 percent in 2023. This demonstrates a sustained demand and output from the foundational elements of the arts ecosystem.
Simultaneously, supporting arts and cultural production industries, which include vital services such as art support services and information services, exhibited even more accelerated growth, with a 7.1 percent increase in real value added. This highlights the expanding role of services that enable, amplify, and distribute cultural content, pointing towards innovation and increased efficiency within the broader creative economy. The interplay between these core and supporting industries is crucial for the sector’s overall health and its capacity to generate economic value.
Nominal Value Added Reflects Broad Economic Gains
When examined without adjusting for inflation, the nominal value added for arts and cultural production industries presents an even more striking picture of economic activity. Nationally, nominal value added saw an impressive increase of 7.6 percent in 2023. This growth was predominantly fueled by the supporting arts and cultural production industries, which advanced by 6.8 percent to reach a substantial $873.8 billion. Within this category, information services emerged as a leading driver of this increase.
The core arts and cultural production industries also demonstrated robust nominal growth, increasing by 10.6 percent to a total of $265.8 billion. Key contributors to this surge within the core industries included performing arts and design services, signaling a strong market appetite for live performances, visual arts, and creative design solutions. This dual growth in both core and supporting sectors underscores the comprehensive economic momentum within the arts and culture landscape.
State-Level Dynamics: Growth and Divergence
The economic vitality of the arts and cultural sector is not uniformly distributed across the nation, with significant variations observed at the state level. In 2023, a considerable 47 states and the District of Columbia experienced an increase in nominal value added within their arts and cultural production industries. This widespread growth suggests a broad-based positive trend across much of the country.
However, the magnitude of these changes varied considerably. Nevada led the nation with an exceptional 14.7 percent increase in value added. This surge was largely attributed to significant contributions from promoters of performing arts and similar events, the publishing industry, and performing arts companies. The vibrant entertainment and creative industries in Nevada have clearly translated into substantial economic gains.

Conversely, Louisiana experienced the largest decrease, with a decline of 3.4 percent. The primary factor contributing to this downturn was a contraction in the motion pictures industry within the state. Understanding these regional differences is crucial for targeted economic development strategies and for appreciating the diverse economic landscapes shaped by the arts and culture.
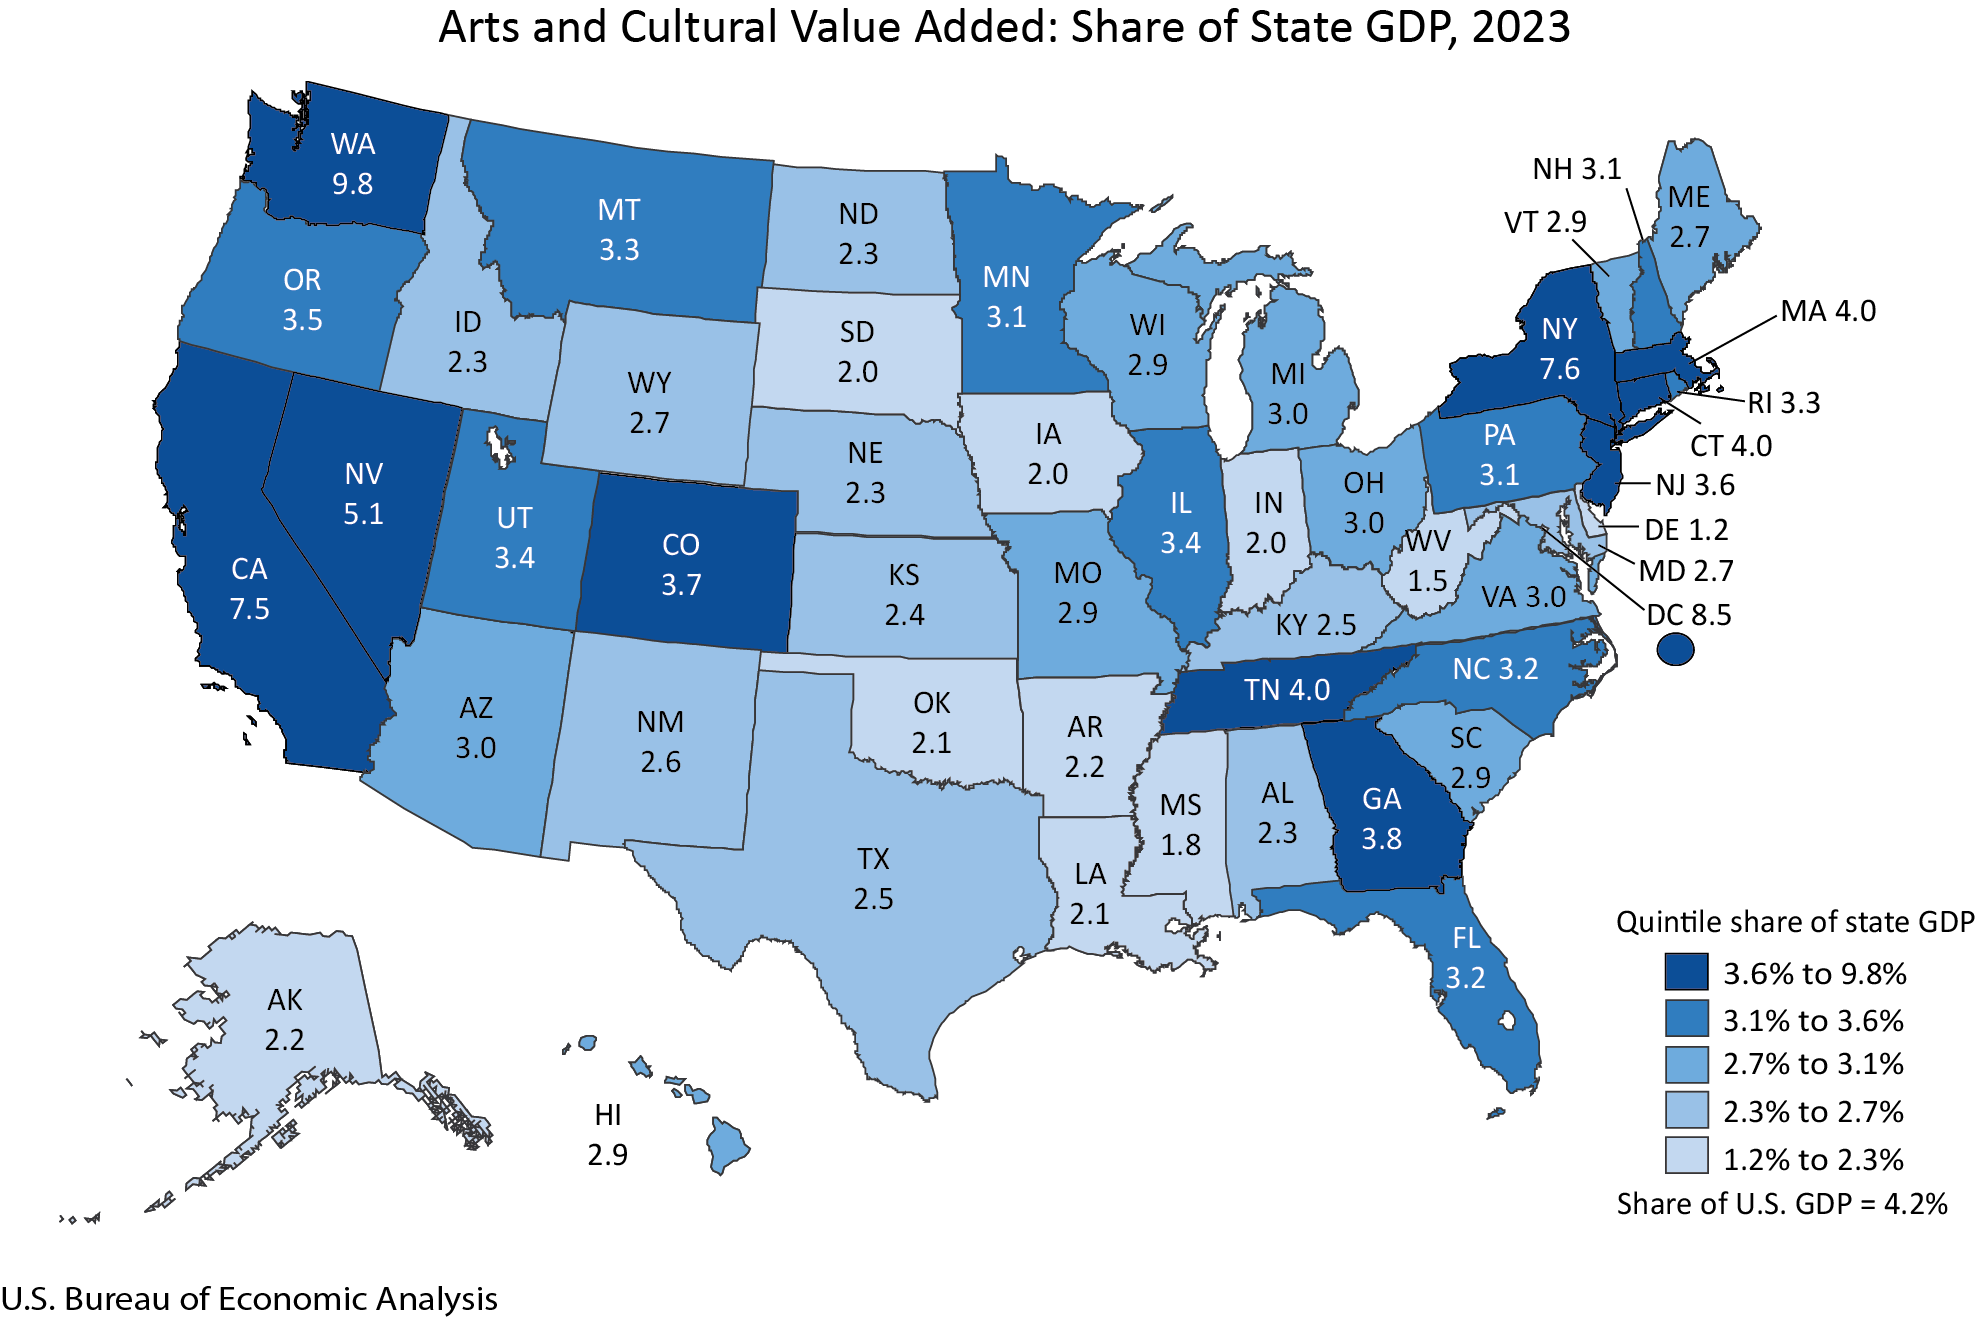
Arts and Culture’s Share of State GDP
The contribution of arts and culture to state economies also shows considerable variation. The arts and cultural share of total GDP ranged from a high of 9.8 percent in Washington state to a more modest 1.2 percent in Delaware. For the majority of states, this share fell within the 2 to 5 percent range, indicating that arts and culture are a significant, but not dominant, economic force in most regions.
However, a select few areas stand out for the disproportionately large economic impact of their arts and cultural sectors. Washington state, the District of Columbia, New York, California, and Nevada were the only jurisdictions where the arts and cultural share of total GDP exceeded 5 percent. This concentration suggests that in these regions, the creative economy plays a particularly vital role in driving overall economic activity and employment.

The specific industries contributing to these significant shares also varied. In Washington state, publishing and retail industries were leading contributors to the arts and cultural share of GDP. The District of Columbia saw government and advertising as key drivers. New York’s strong performance was bolstered by broadcasting and "other information services." California’s creative economy was significantly influenced by other information services and motion pictures. In Nevada, promoters of performing arts and similar events, alongside other information services, were instrumental. These distinct industry profiles underscore the multifaceted nature of the arts and cultural sector and its varied economic drivers across different states.
Employment Trends: A Mixed but Growing Picture
Nationwide, arts and cultural employment experienced a modest increase of 0.3 percent in 2023, bringing the total number of jobs in the sector to 5.4 million. While this represents overall growth, it is a more subdued expansion compared to the economic value added. Arts and cultural employment increased in 27 states, indicating that job growth in this sector is not as widespread as nominal value added gains.
North Carolina emerged as a leader in employment growth, with a 7.6 percent increase in arts and cultural jobs. This growth translated into 167,254 jobs related to arts and culture in the state, accounting for 3.3 percent of all jobs within North Carolina. Government and retail industries were identified as the leading contributors to this employment surge in the Tar Heel State.

In contrast, Hawaii experienced the most significant decline in arts and cultural employment, with a 6.6 percent decrease. The report identified construction and motion pictures as the primary drivers of this reduction in the Aloha State. These employment figures, while showing overall growth, highlight the need for continued attention to job creation and retention within the arts and cultural sector across all regions.
Compensation: A Positive Trajectory
Arts and cultural compensation nationwide also followed a positive trend, increasing by 3.6 percent in 2023. This rise in compensation suggests that the economic gains within the sector are translating into improved earnings for those employed in arts and cultural fields. Compensation increased in 43 states and the District of Columbia, indicating a broadly positive trend in worker earnings across most of the country.
Nevada again stood out with the highest percentage increase in arts and cultural compensation, reaching 12.7 percent. This robust growth in earnings, coupled with the significant increase in value added, underscores Nevada’s strong performance in the arts and cultural sector. Conversely, Georgia experienced the largest decrease in compensation, with a decline of 6.9 percent. Understanding the factors driving these compensation trends is vital for ensuring equitable economic benefits within the arts and cultural workforce.
Methodological Advancements and Future Outlook
The release of these updated statistics is part of the BEA’s ongoing commitment to refining and expanding its measurement of economic activity. The Arts and Cultural Production Satellite Account is regularly updated to incorporate new and revised source data, ensuring that it accurately reflects the dynamic nature of this sector. The 2017 to 2023 statistics primarily reflect the incorporation of the 2024 annual update of BEA’s National and Regional Economic Accounts, while earlier statistics have been revised to align with the 2023 comprehensive update of BEA’s National and Regional Economic accounts. These updates, combined with specific arts and cultural production data, allow for a more precise capture of the sector’s economic contributions.
The BEA’s Arts and Cultural Production Satellite Account is made possible through funding from the National Endowment for the Arts (NEA), a federal agency dedicated to supporting excellence in the arts and reaching all Americans with the arts. This collaboration underscores the federal government’s recognition of the arts and culture sector as a vital component of the national economy and cultural landscape.
The next release of the Arts and Cultural Production Satellite Account, providing statistics for 2024 for both the U.S. and its states, is scheduled for March 2026. This ongoing series of reports is essential for policymakers, industry leaders, and the public to understand the economic impact and evolving trends within the arts and cultural sector, a sector that continues to demonstrate resilience, innovation, and significant economic contribution to the United States. The consistent growth in value added, coupled with steady, albeit varied, employment and compensation trends, paints a picture of a sector that is not only culturally enriching but also a significant engine of economic prosperity.