The U.S. marine economy generated a substantial $511.0 billion, or 1.8 percent, of the nation’s current-dollar Gross Domestic Product (GDP) in 2023, marking a significant increase from the $482.4 billion recorded in 2022. This vital sector of the American economy also achieved a gross output of $826.6 billion, representing 1.7 percent of the total national gross output for the year. These figures, released today by the U.S. Bureau of Economic Analysis (BEA) as part of its Marine Economy Satellite Account (MESA) statistics, underscore the enduring and expanding economic significance of the nation’s oceans, coasts, and Great Lakes.
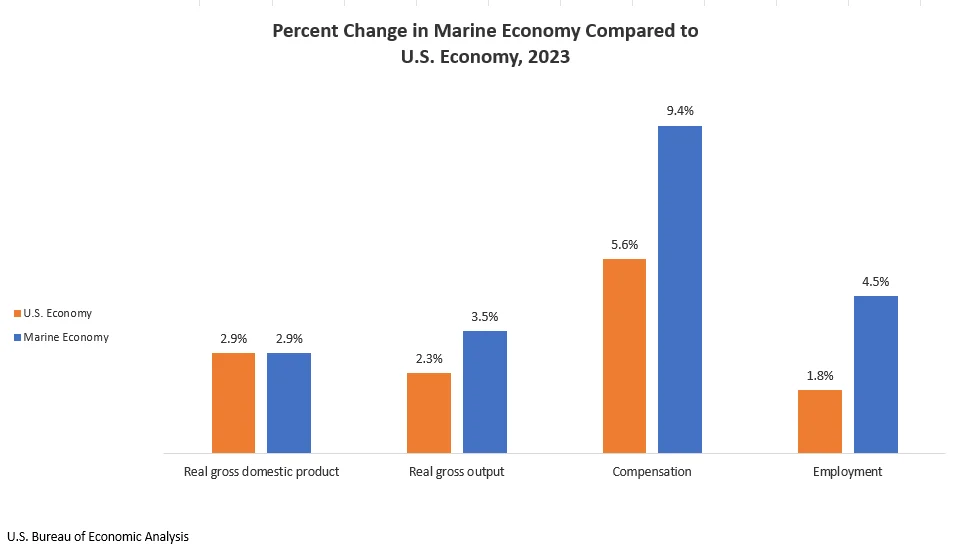
The data highlights a dynamic year for the marine economy, with real (inflation-adjusted) GDP experiencing a 2.9 percent increase from 2022 to 2023. This growth rate precisely matched that of the overall U.S. economy, indicating that the marine sector is not only expanding but doing so in lockstep with national economic trends. Beyond GDP, the sector demonstrated remarkable strength in its workforce and compensation. Marine economy compensation saw a significant surge of 9.4 percent, adding $19.1 billion to the earnings of those employed in the sector. Employment within the marine economy also expanded by a robust 4.5 percent, translating to the creation of 111,000 new full- and part-time positions.
This latest release from the BEA incorporates updated statistics for the period of 2014 through 2022. These revisions are a result of the comprehensive 2023 update and the 2024 annual update of the National Economic Accounts, which includes the Industry Economic Accounts. These updates ensure the accuracy and reliability of the data by integrating newly available and revised source information, providing a more precise picture of the marine economy’s historical performance and its current trajectory.
Marine Economy Performance: A Deeper Dive
The MESA provides a granular view of the marine economy’s contributions, breaking down its economic activity into distinct categories. The account reorganizes industry value added (GDP) and gross output statistics to specifically capture marine-related economic endeavors. These activities are broadly categorized into ten distinct areas, although the specific breakdown of these categories was not detailed in the initial release of data.
Real Gross Output Surges Amidst Sectoral Strength
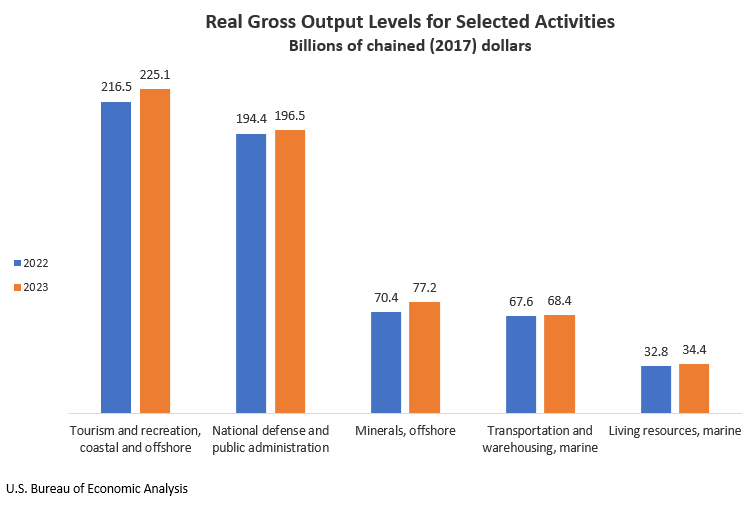
A key indicator of economic vitality, real gross output for the marine economy, which measures inflation-adjusted sales and receipts, experienced a notable increase of 3.5 percent, or $22.7 billion, in 2023. This growth signifies increased production and demand for goods and services originating from or directly related to marine activities. While specific highlights within the ten categories of marine economy activity for 2023 were not fully detailed in the provided excerpt, the overall upward trend in gross output suggests widespread positive performance across various sub-sectors.

Industry Contributions to the Marine Economy
The MESA also offers insights into the contributions of specific industries to the broader marine economy. By analyzing value added (GDP by industry), gross output, employment, and compensation, the report identifies the key sectors driving this economic engine. The detailed industry highlights for 2023, while not fully elaborated in the provided text, would typically reveal which specific industries, such as shipbuilding, fishing, tourism, offshore energy, or maritime transportation, are experiencing the most significant growth and contributing the most to the marine economy’s overall output and employment.
Understanding the Marine Economy Satellite Account
The Marine Economy Satellite Account (MESA) is a specialized framework developed by the BEA to systematically measure the economic activity directly linked to the nation’s marine resources. Its primary objective is to identify the industries responsible for producing these marine-related goods and services and to quantify their output, value added, compensation, and employment.
The methodology behind the MESA is rooted in the BEA’s comprehensive supply and use framework, particularly its Supply and Use Tables (SUTs). These SUTs offer an in-depth examination of the interrelationships between different industries and their respective contributions to GDP. The MESA effectively reconfigures these SUTs, employing specific estimation methods to isolate and quantify marine-related spending and production. This rigorous approach relies on a diverse array of private and public data sources to accurately identify and measure these marine-specific economic activities.
A distinctive feature of the MESA is its dual presentation of data: estimates of gross output and value added are provided not only by industry but also by marine economic activity. This dual perspective is crucial for a comprehensive understanding of the marine economy, allowing for analysis of economic activity that may span multiple industries but is united by its direct connection to marine resources.
The geographic scope of the MESA is extensive, encompassing the Atlantic, Pacific, and Arctic Oceans within the U.S. Exclusive Economic Zone, which extends approximately 200 nautical miles offshore. It also includes marginal seas like the Chesapeake Bay, Puget Sound, Long Island Sound, and San Francisco Bay, as well as the U.S. shoreline directly bordering these waters. Furthermore, the Great Lakes are included up to the international boundary with Canada, recognizing their significant economic and ecological importance.
Historical Context and Data Updates
The release of the 2023 statistics follows a period of ongoing refinement and expansion of the MESA. The integration of the 2023 comprehensive update and the 2024 annual update of the National Economic Accounts signifies the BEA’s commitment to maintaining the highest standards of data accuracy and relevance. These updates ensure that the MESA reflects the most current economic realities and the latest available source data.
The comprehensive set of detailed annual statistics for the marine economy, spanning from 2014 to 2023, is accessible on the BEA’s website. This data includes figures for gross output and value added, presented by both industry and activity, alongside employment and compensation data broken down by industry. This wealth of information provides researchers, policymakers, and industry stakeholders with the tools to conduct in-depth analyses of the marine economy’s performance and its various components.
Implications of a Growing Marine Economy
The sustained growth of the U.S. marine economy has far-reaching implications. Economically, it represents a significant and expanding source of national wealth, contributing to GDP, creating jobs, and fostering innovation. The robust increase in compensation suggests that skilled labor within the sector is in demand and is being rewarded accordingly.
From a policy perspective, these statistics provide critical data for informed decision-making. Understanding the economic drivers within the marine sector can help guide investments in infrastructure, research and development, and workforce training. For instance, sustained growth in sectors like offshore renewable energy or sustainable fisheries could prompt policies that support their further development and environmental stewardship.
The expansion of employment within the marine economy also signals opportunities for workforce development. As the sector grows, there will be an increasing need for skilled professionals in a variety of fields, from marine engineering and environmental science to maritime logistics and coastal tourism management. Investments in education and training programs tailored to these needs will be essential to harness the full potential of this growth.
Furthermore, the MESA’s emphasis on both industry and activity allows for a more nuanced understanding of economic linkages. Activities that might be spread across multiple traditional industry classifications can now be analyzed holistically, revealing the true economic impact of marine-related endeavors. This integrated approach is invaluable for developing comprehensive strategies that promote sustainable economic development while safeguarding marine ecosystems.
The partnership between the BEA and the National Oceanic and Atmospheric Administration (NOAA) in producing the MESA is a testament to the interdisciplinary nature of understanding and managing the marine economy. NOAA’s expertise in ocean science and policy complements the BEA’s economic data analysis capabilities, leading to a more holistic and effective assessment of the nation’s marine resources.
Looking ahead, the next release of Marine Economy Satellite Account data is anticipated in the Spring of 2026, which will provide statistics for 2024. This ongoing series of releases ensures that policymakers and stakeholders have access to timely and relevant information to navigate the evolving landscape of the U.S. marine economy. The continued growth and dynamism of this sector underscore its importance not only to the nation’s economic prosperity but also to its environmental health and long-term sustainability.