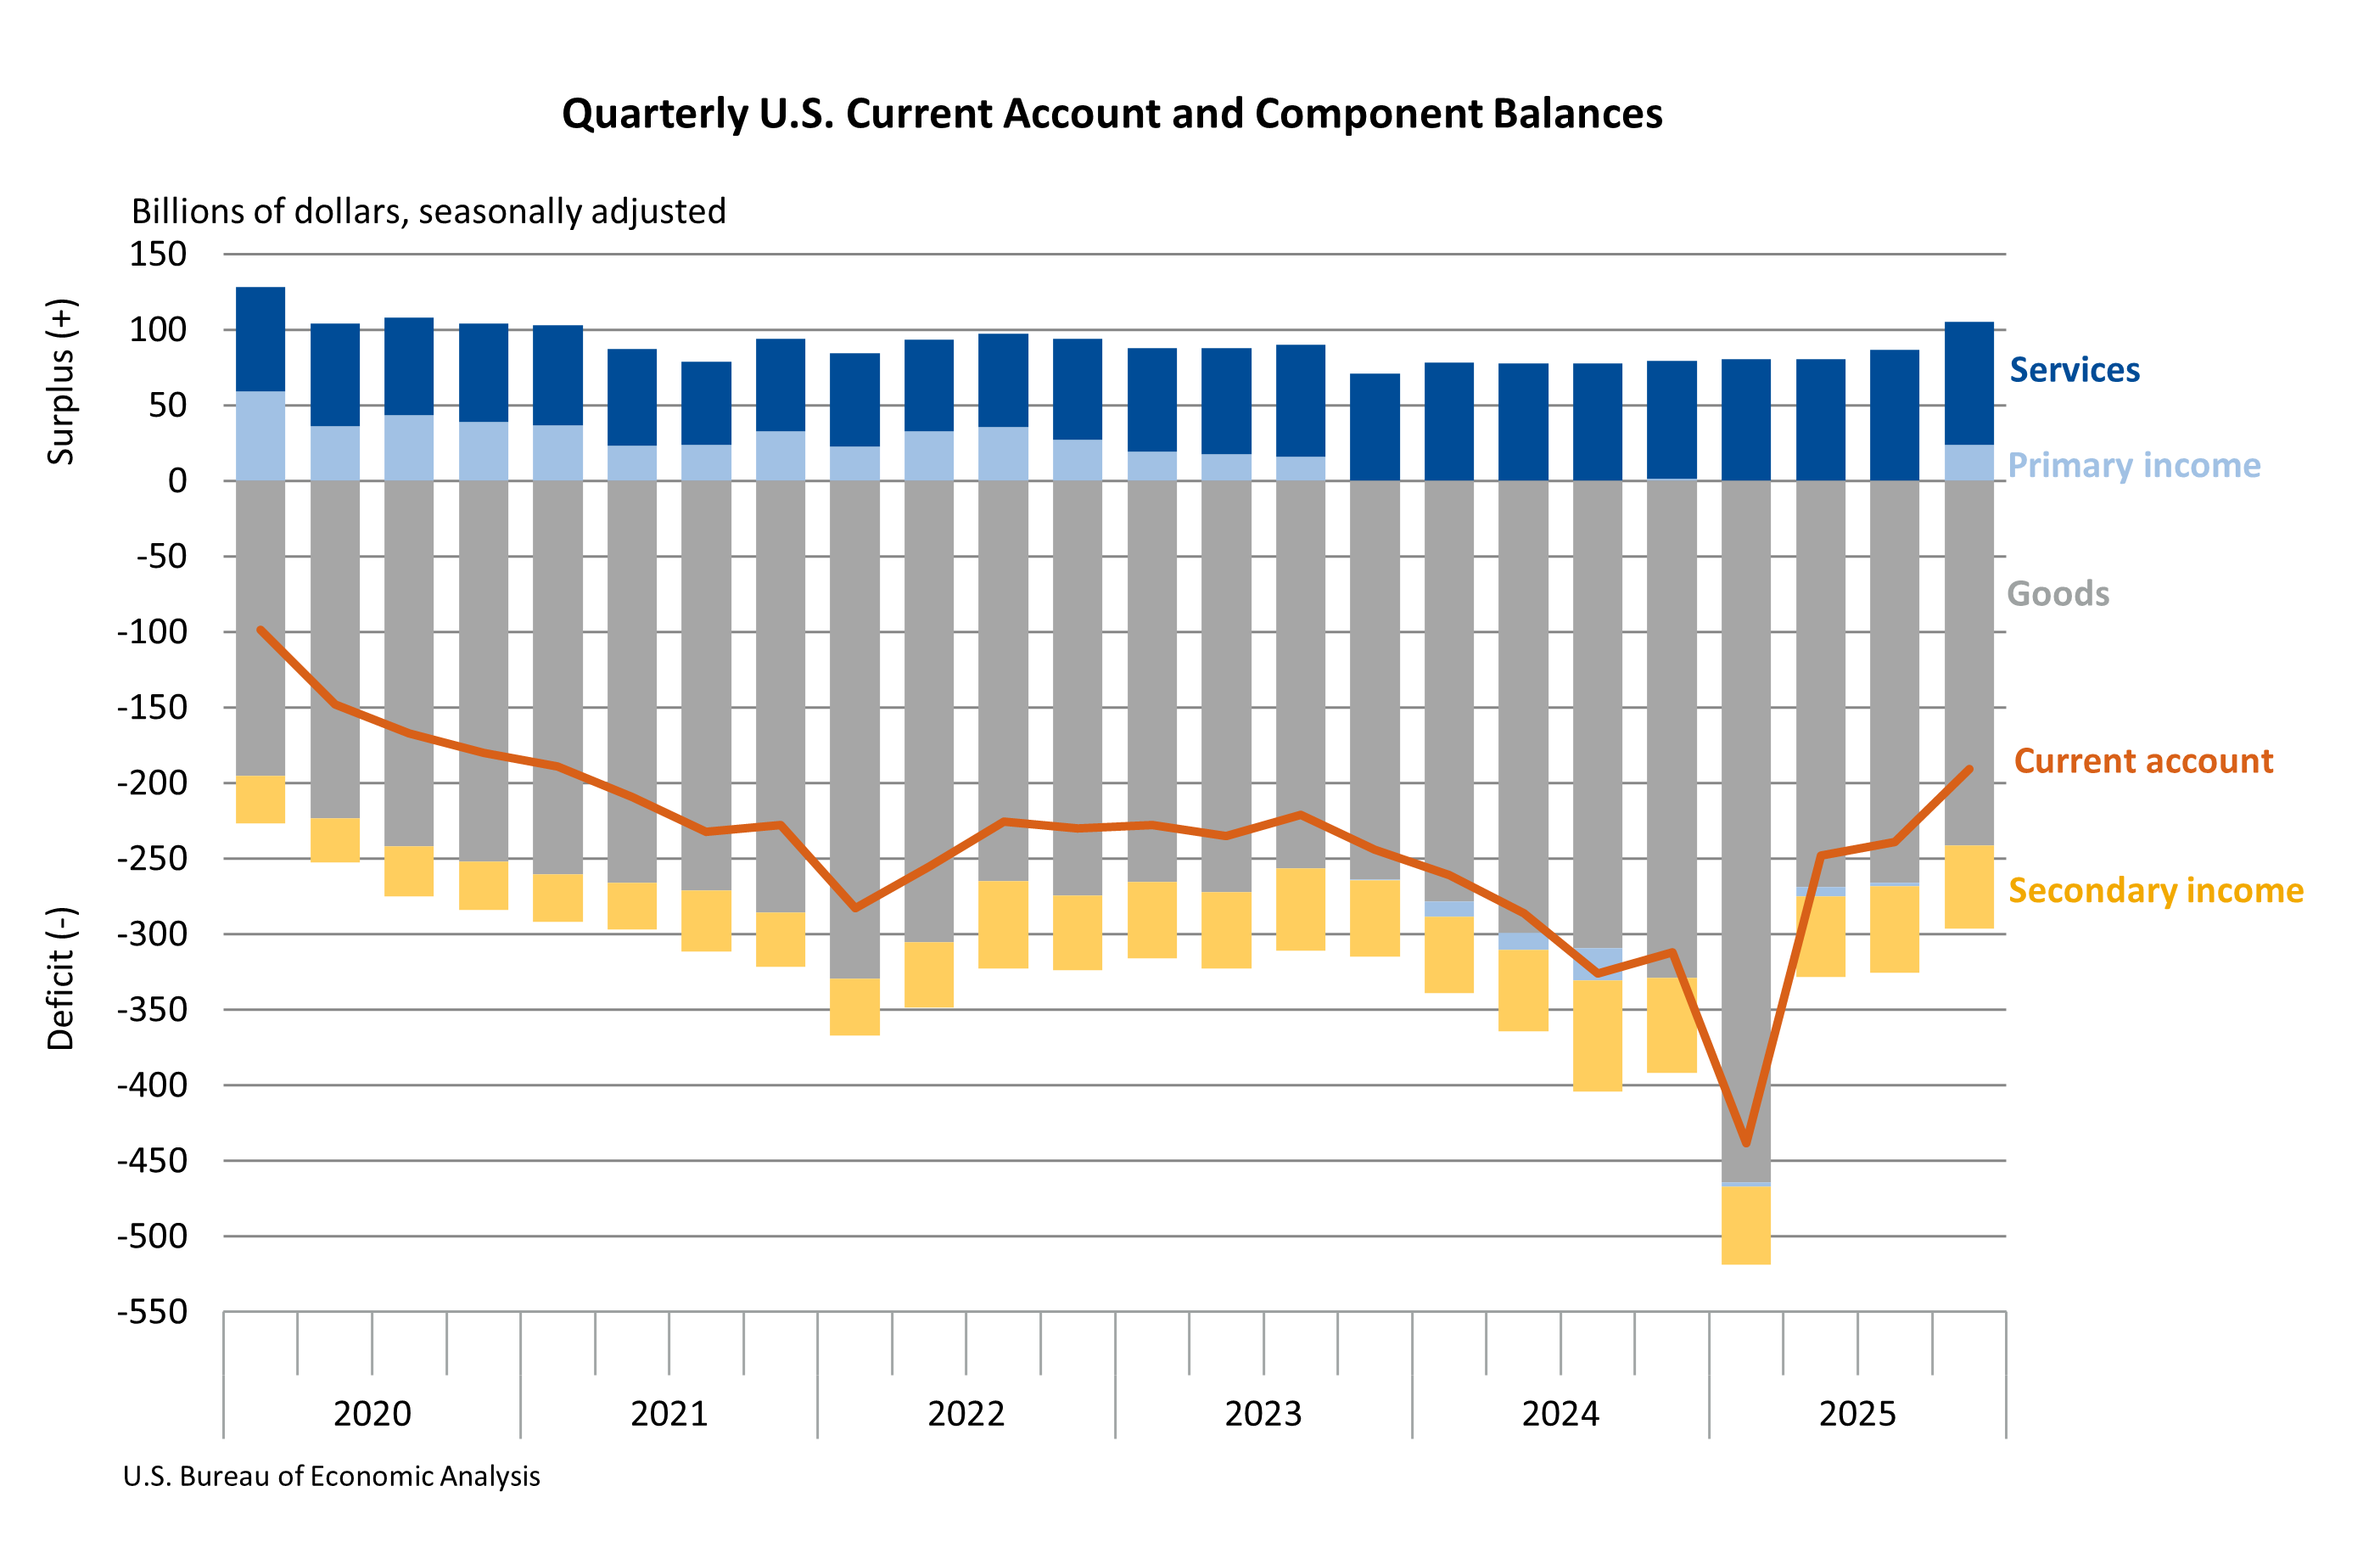
The United States experienced a notable reduction in its current-account deficit during the fourth quarter of 2025, a key indicator of the nation’s economic interactions with the rest of the world. According to the latest statistics released by the U.S. Bureau of Economic Analysis (BEA), the deficit contracted by $48.4 billion, or 20.2 percent, to $190.7 billion. This improvement marks a significant shift from the revised third-quarter deficit of $239.1 billion, signaling a more balanced international economic posture as the year concluded.
The narrowing of the current-account deficit, which represents the sum of the balance on trade in goods and services, primary income, and secondary income, is a critical metric for understanding a nation’s financial health and its role in the global economy. A shrinking deficit suggests that the U.S. is either exporting more or importing less relative to its income flows from abroad, or a combination of both. In the fourth quarter of 2025, this deficit represented 2.4 percent of the nation’s current-dollar Gross Domestic Product (GDP), a decrease from 3.1 percent in the preceding quarter. This reduction in the deficit’s proportion to GDP further underscores the strengthening of the U.S. economic position relative to its total economic output.
The primary drivers behind this substantial improvement were a positive shift in the balance on primary income, which moved from a deficit in the third quarter to a surplus in the fourth, and a reduction in the deficit on goods. This dual movement indicates a more robust performance in both investment income flows and the trade of tangible products.
Key Drivers of the Fourth-Quarter Improvement
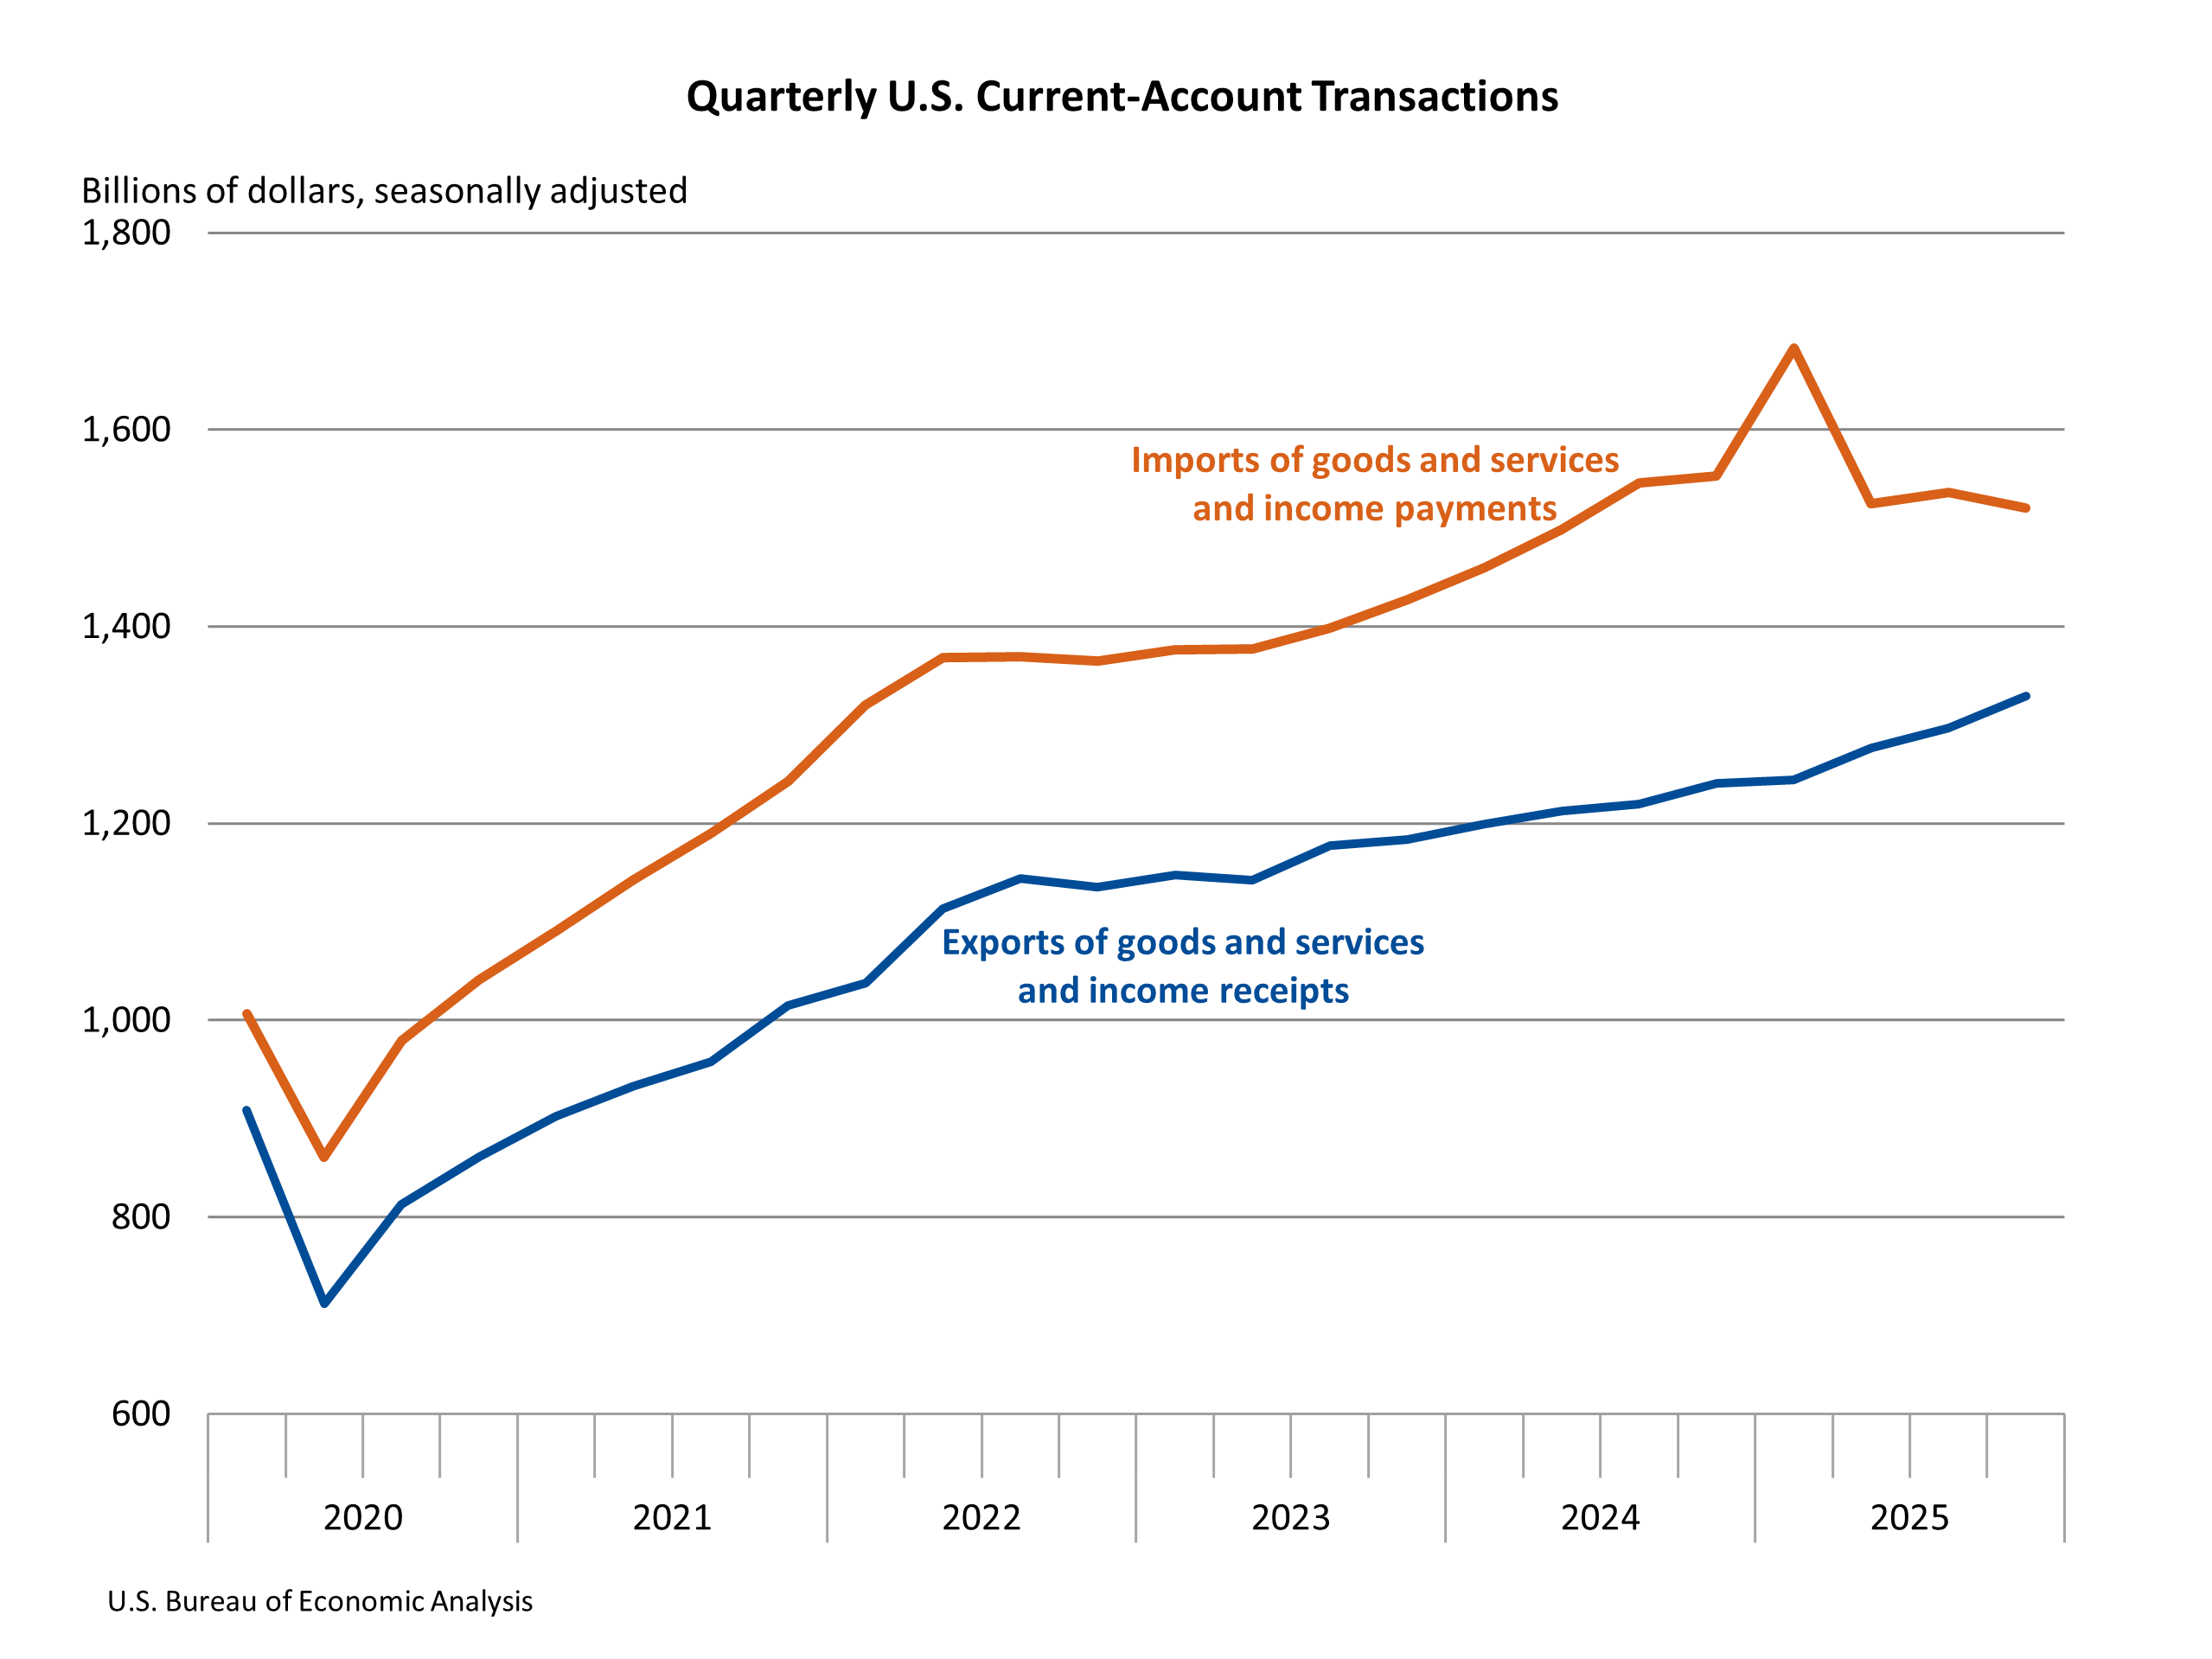
The BEA’s detailed breakdown of international transactions reveals that total exports of goods and services, along with income received from foreign residents, saw a robust increase of $32.4 billion, reaching $1.33 trillion in the fourth quarter. This surge was largely attributable to an uptick in goods exports and a significant rise in primary income receipts. Primary income encompasses earnings on foreign direct investments, portfolio investments, and other investments. A stronger inflow of income from U.S. assets held abroad, such as dividends from foreign subsidiaries or interest on foreign bonds, contributed substantially to this positive development.
Conversely, imports of goods and services from, and income paid to, foreign residents experienced a decrease of $16.0 billion, settling at $1.52 trillion. This decline was primarily due to reduced primary income payments and a decrease in goods imports. Lower payments of income to foreign entities on their investments in the U.S., coupled with a reduction in the value of goods purchased from other countries, played a crucial role in shrinking the overall deficit.
The balance on primary income, a key component of the current account, shifted from a deficit of $2.5 billion in the third quarter to a surplus of $5.2 billion in the fourth quarter. This turnaround, representing a $7.7 billion swing, highlights the growing returns on U.S. investments abroad or a deceleration in payments to foreign investors in the U.S.
Trade Dynamics and Income Flows
The goods deficit, which has historically been a significant contributor to the U.S. current-account deficit, also saw a contraction. While the BEA data does not provide the exact figures for the goods balance in the fourth quarter, the overall narrowing of the current-account deficit, coupled with the positive shift in primary income, implies a substantial improvement in the trade balance of goods. The services balance, which has typically been in surplus for the U.S., also contributed to the overall improvement, though its impact was less pronounced than that of primary income and goods trade.
Primary income receipts, which include compensation of employees and investment income, increased significantly. Investment income, in particular, saw a notable rise, reflecting stronger returns on U.S. direct investments abroad and portfolio investments. This suggests a healthier performance of U.S. global assets in the latter part of 2025.
Simultaneously, primary income payments to foreign residents saw a decline. This could be attributed to various factors, including a decrease in foreign direct investment in the U.S. or a moderation in the profitability of foreign-owned companies operating within the United States. The combination of increased receipts and decreased payments effectively swung the primary income balance into positive territory, a crucial development for the current account.
Capital Transfers and Financial Account Transactions
While the current account showed significant improvement, capital transfers presented a mixed picture. Capital-transfer receipts saw a modest decrease of $80 million, totaling $101 million in the fourth quarter. However, capital-transfer payments increased by $1.8 billion, reaching $3.0 billion. Capital transfers are one-sided transactions, such as inheritances or debt forgiveness, and their impact on the current account is generally less significant compared to trade in goods and services or income flows.
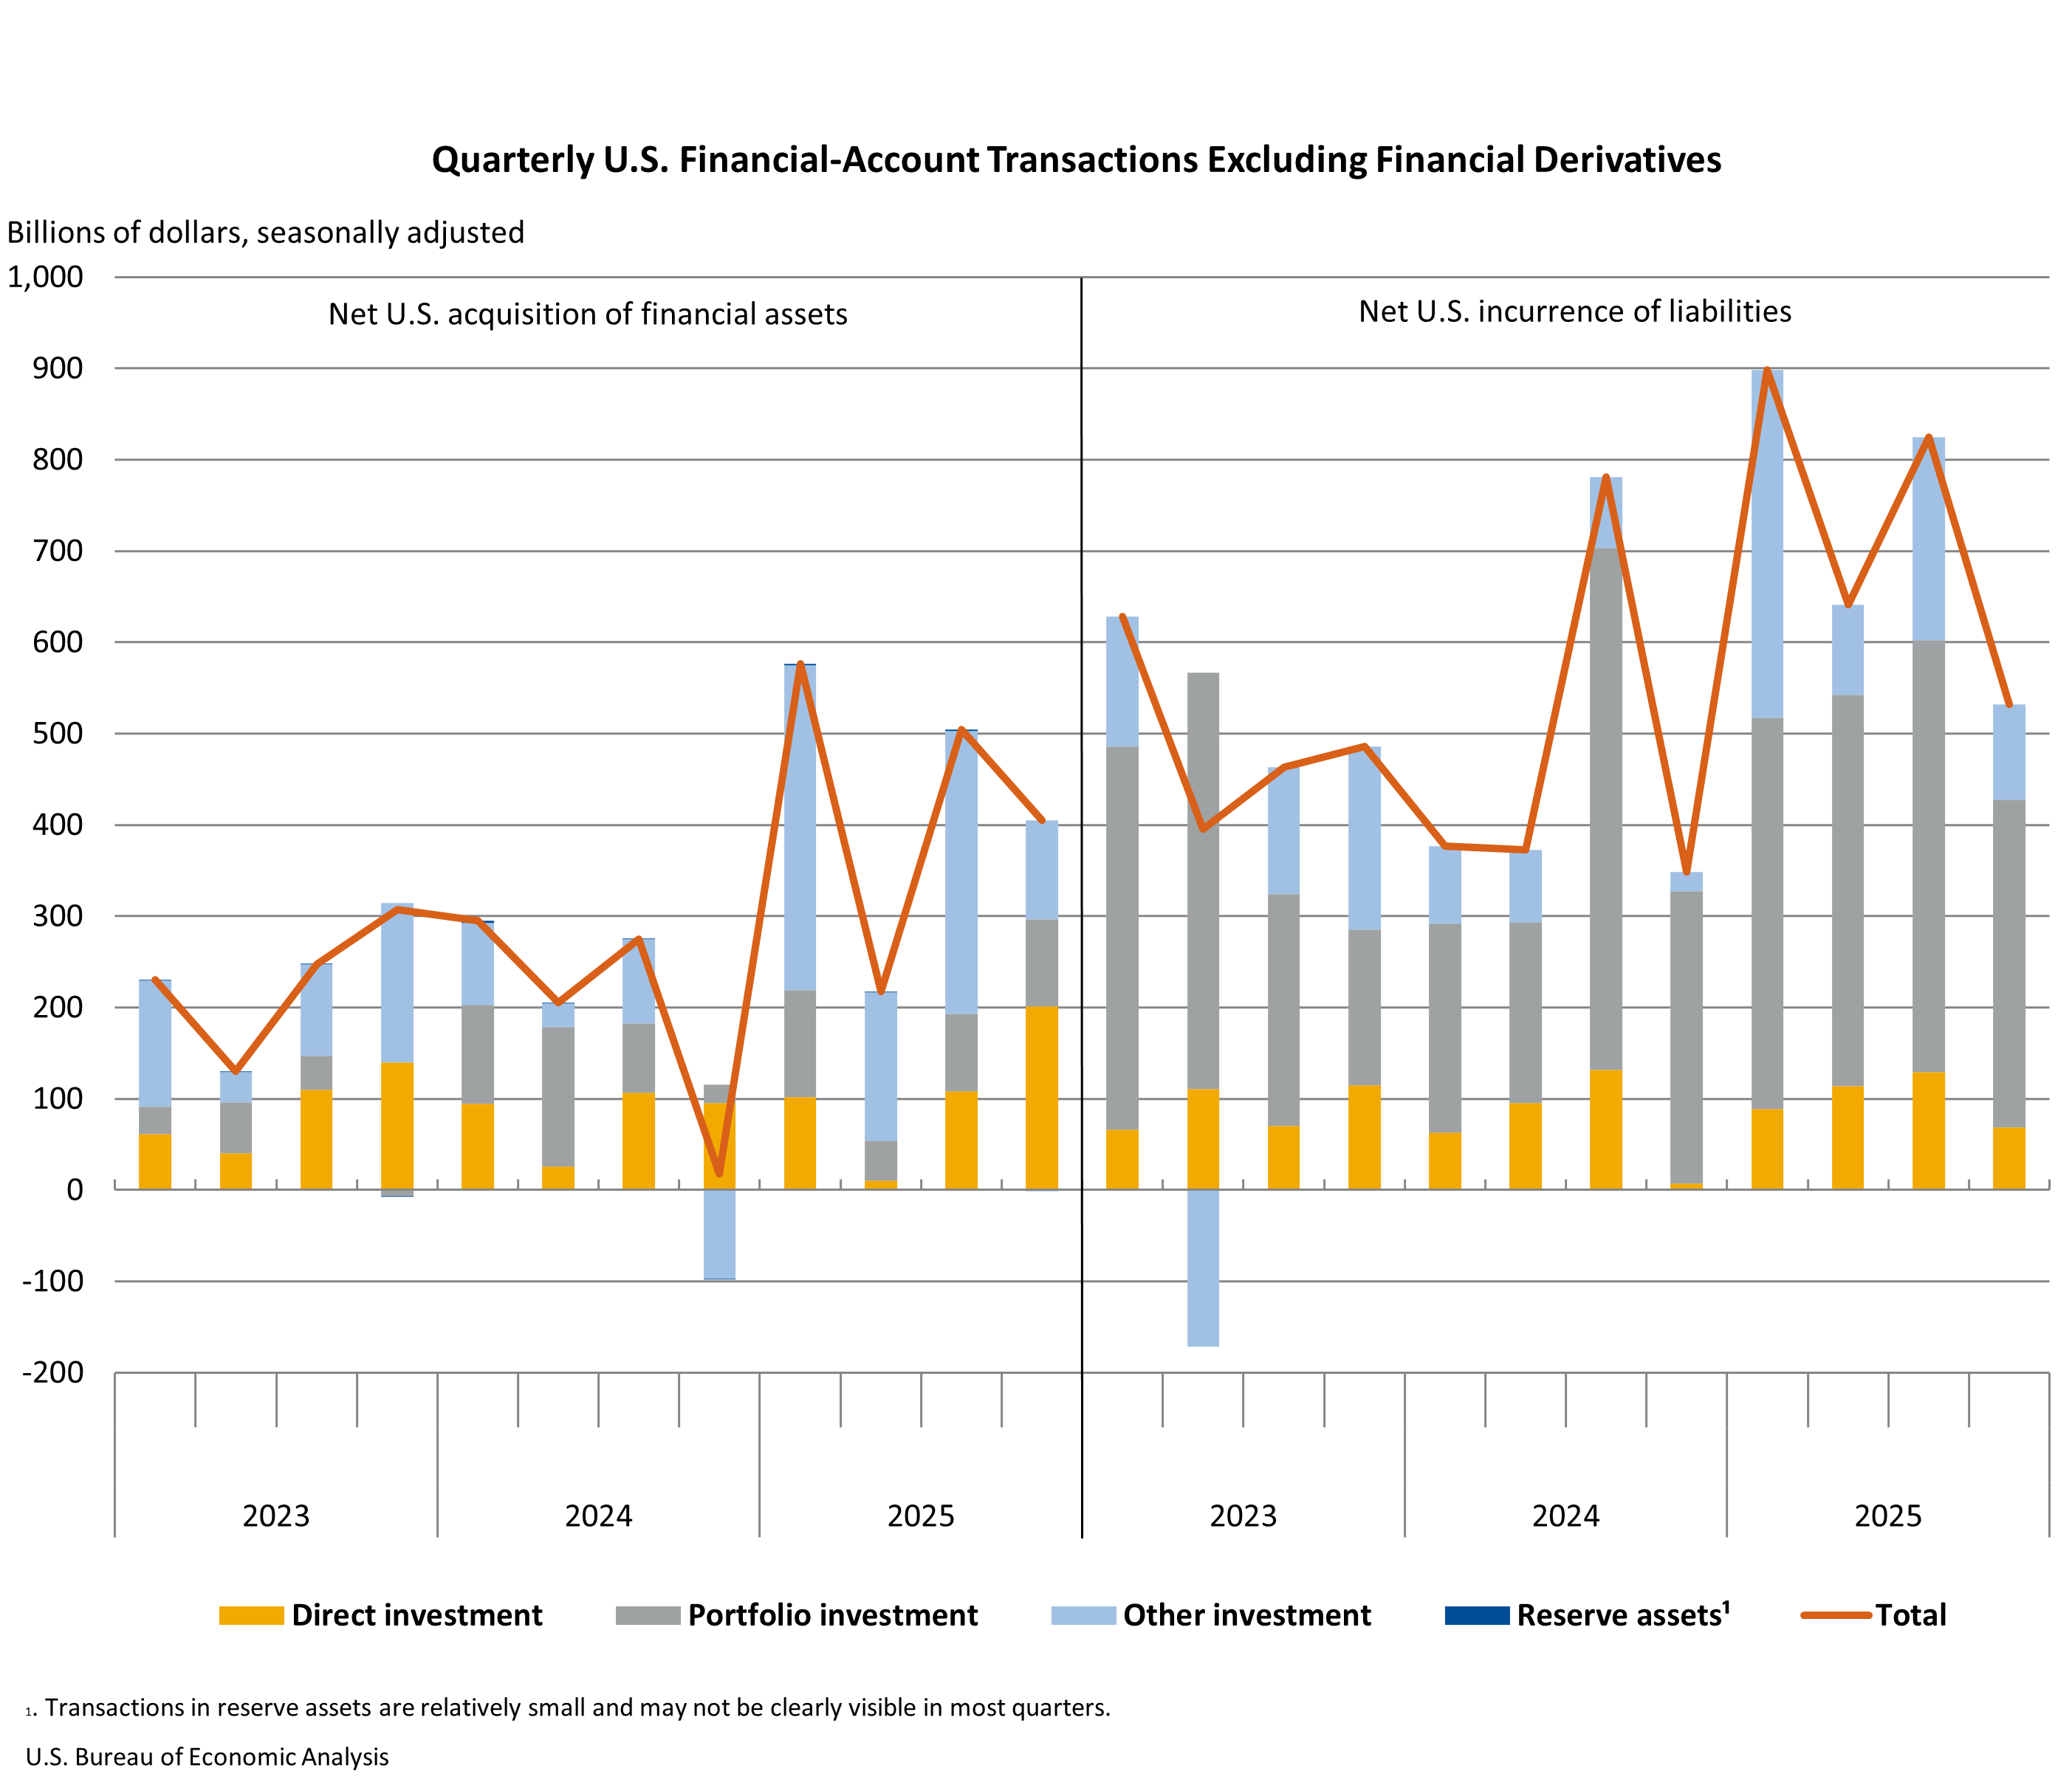
The financial account, which tracks cross-border investment flows, recorded net financial-account transactions of -$135.9 billion in the fourth quarter. This figure reflects net U.S. borrowing from foreign residents, meaning that foreigners invested more in the U.S. than U.S. residents invested abroad through financial transactions. During this period, U.S. residents’ foreign financial assets increased by $405.0 billion, while U.S. liabilities to foreign residents increased by a larger $532.0 billion. This outflow of capital through increased liabilities indicates a continued reliance on foreign investment to finance domestic activities or asset acquisition.
U.S. Net International Investment Position
As of the end of the fourth quarter of 2025, the U.S. net international investment position, which is the difference between the value of U.S. residents’ foreign financial assets and liabilities, stood at a negative $27.54 trillion. This represents a slight improvement from the revised end-of-third-quarter position of -$27.55 trillion. At year-end, U.S. assets abroad totaled $42.96 trillion, while liabilities to foreign residents amounted to $70.49 trillion.
The change in the net international investment position is influenced by both financial transactions and valuation changes (price and exchange rate fluctuations). In the fourth quarter, U.S. assets increased by $1.62 trillion, driven by increases across major investment categories, particularly direct and portfolio investments. This increase was a result of price changes amounting to $1.10 trillion and financial transactions totaling $405.0 billion.
Similarly, U.S. liabilities increased by $1.61 trillion. This growth was also broad-based, with notable increases in portfolio investment. The overall rise in liabilities was propelled by price changes of $631.6 billion and financial transactions of $532.0 billion. The fact that liabilities grew slightly more than assets contributed to the marginally negative shift in the net international investment position for the quarter, despite the overall improvement in the current account.
Revisions to Third-Quarter Data
The BEA also released revised estimates for the third quarter of 2025, which provided further context for the fourth-quarter improvements. The current-account deficit for the third quarter was revised upward from preliminary estimates of -$226.4 billion to -$239.1 billion. This upward revision was primarily due to a larger deficit in secondary income and a shift in the primary income balance from a slight surplus to a deficit.
However, the net financial-account transactions for the third quarter were revised downward from -$409.9 billion to -$376.4 billion, indicating that the net borrowing from foreign residents was less pronounced than initially estimated. The U.S. net international investment position at the end of the third quarter was revised to -$27.55 trillion from -$27.61 trillion. These revisions highlight the dynamic nature of economic data and the importance of updated figures for accurate analysis.
Full-Year 2025 Performance
Looking at the entire year 2025, the U.S. current-account deficit narrowed by $69.3 billion, or 5.8 percent, to $1.12 trillion. This annual reduction indicates a trend towards a more sustainable international economic balance over the course of the year. The deficit represented 3.6 percent of current-dollar GDP, a decrease from 4.0 percent in 2024, reinforcing the positive trajectory.
Throughout 2025, exports of goods and services and income received from foreign residents increased by $276.2 billion, reaching $5.15 trillion. Imports of goods and services and income paid to foreign residents also rose, albeit at a slower pace, by $206.9 billion, totaling $6.26 trillion. This differential growth in exports over imports contributed to the narrowing of the overall deficit for the year.
Capital-transfer receipts decreased by $3.6 billion to $9.2 billion for the year, while capital-transfer payments declined by $1.0 billion to $8.2 billion. Net financial-account transactions for the year were -$1.21 trillion, signifying ongoing net U.S. borrowing from foreign residents. During 2025, U.S. residents’ foreign financial assets increased by $1.7 trillion, and U.S. liabilities to foreign residents rose by $2.90 trillion.
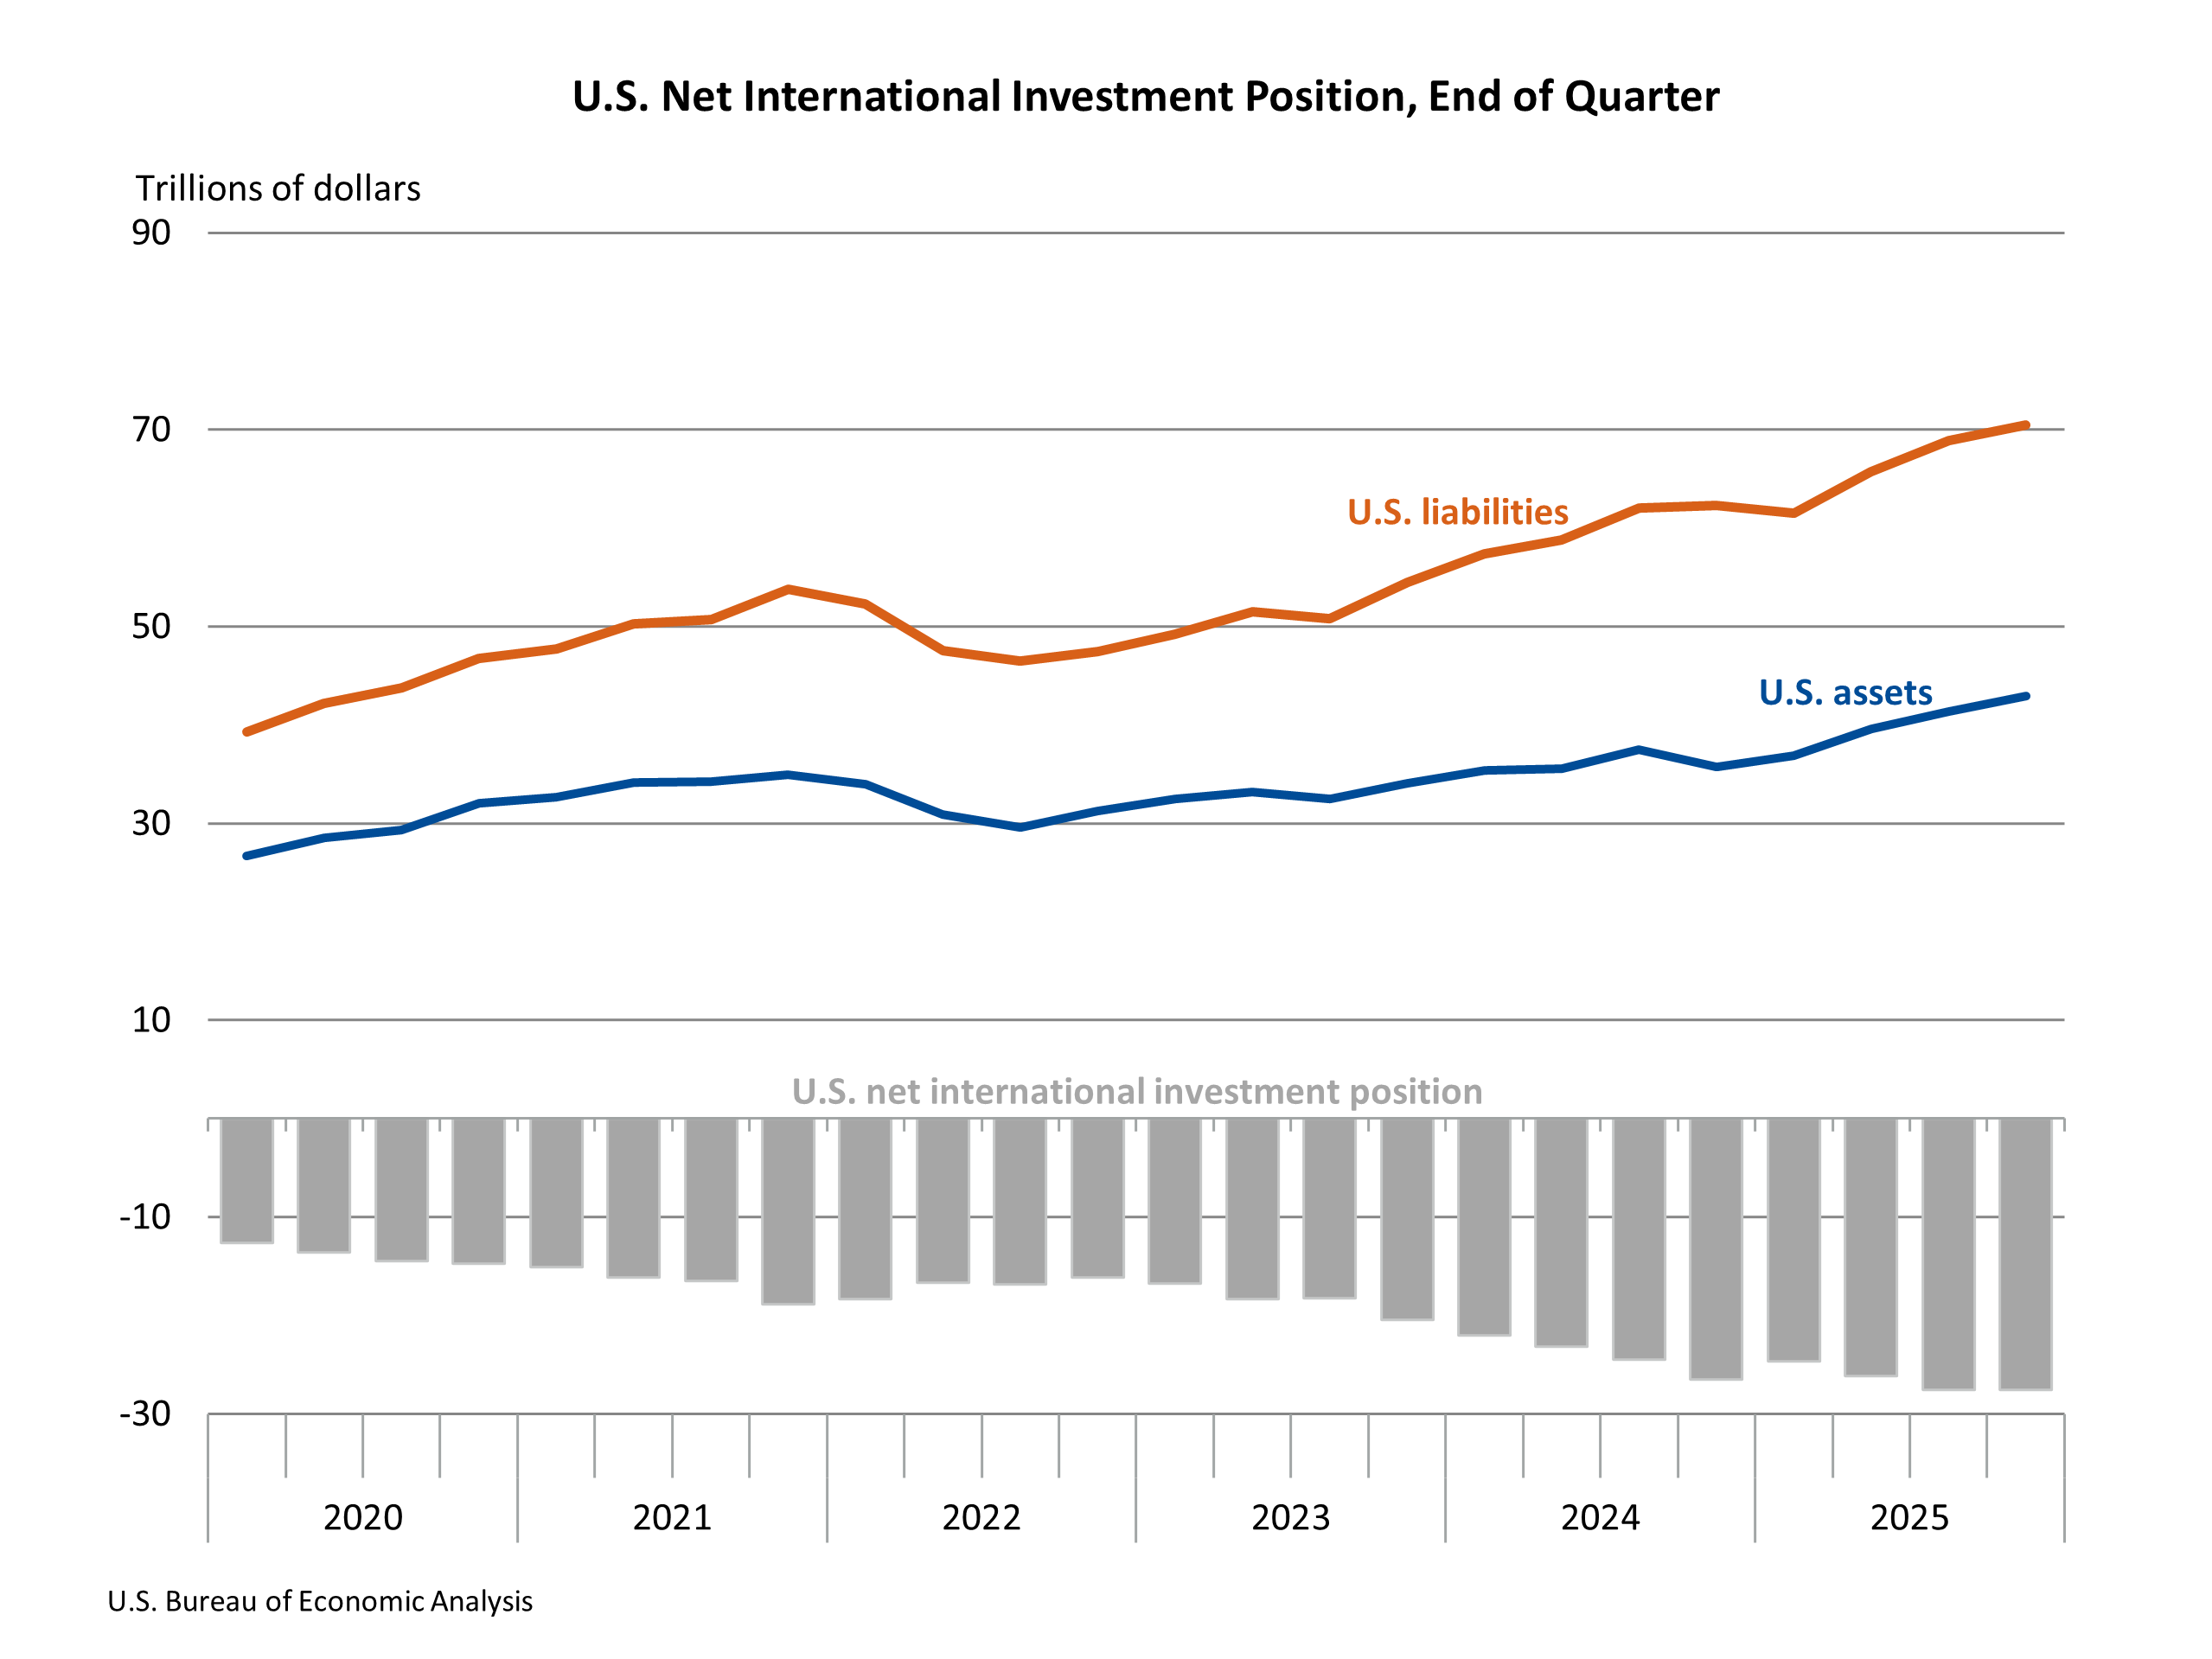
The U.S. net international investment position at the end of 2025 was -$27.54 trillion, compared to -$26.54 trillion at the end of 2024. This widening of the net debt position over the year is a significant factor to monitor, as it reflects the accumulation of foreign claims on U.S. assets. U.S. assets abroad grew by $7.24 trillion to $42.96 trillion, while U.S. liabilities increased by a larger $8.24 trillion to $70.49 trillion.
Future Outlook and Upcoming Data Releases
The BEA also announced upcoming updates to its data releases. The annual updates of the U.S. International Transactions Accounts (ITAs) and International Investment Position (IIP) Accounts, along with preliminary estimates for the first quarter of 2026, are scheduled for release on June 24, 2026. A preview of these annual updates will be available in the Survey of Current Business in April 2026, offering early insights into the comprehensive revisions.
Furthermore, the BEA has updated "Table 1.3. Change in the U.S. Net International Investment Position" to incorporate seasonally adjusted financial transactions. This enhancement provides users with more granular data for analyzing short-term trends and the impact of seasonal patterns on cross-border investment flows.
The release of the fourth-quarter and full-year 2025 data provides a comprehensive snapshot of the U.S. economic relationship with the rest of the world. The significant narrowing of the current-account deficit in the final quarter of 2025 is a positive indicator, driven by a resurgence in primary income and a more controlled goods deficit. However, the continued growth of U.S. liabilities and the substantial negative net international investment position remain areas of ongoing economic observation, suggesting a complex interplay of global economic forces shaping the United States’ financial standing.
The next release of U.S. International Transactions and Investment Position data, including the first quarter of 2026 statistics and the annual update, is anticipated on June 24, 2026, at 8:30 a.m. EDT. This upcoming release will provide the latest figures and potentially revise historical data, offering a continuously evolving picture of the U.S. economy’s global engagement.