The U.S. Bureau of Economic Analysis (BEA) today unveiled a comprehensive report detailing the significant economic contributions of the arts and cultural sector in 2023. The Arts and Cultural Production Satellite Account reveals that this dynamic sector experienced substantial growth, outpacing the broader U.S. economy in inflation-adjusted terms. This latest data underscores the resilience and increasing importance of arts and culture to the national economic landscape.
Arts and Culture Sector Outpaces Overall Economic Growth
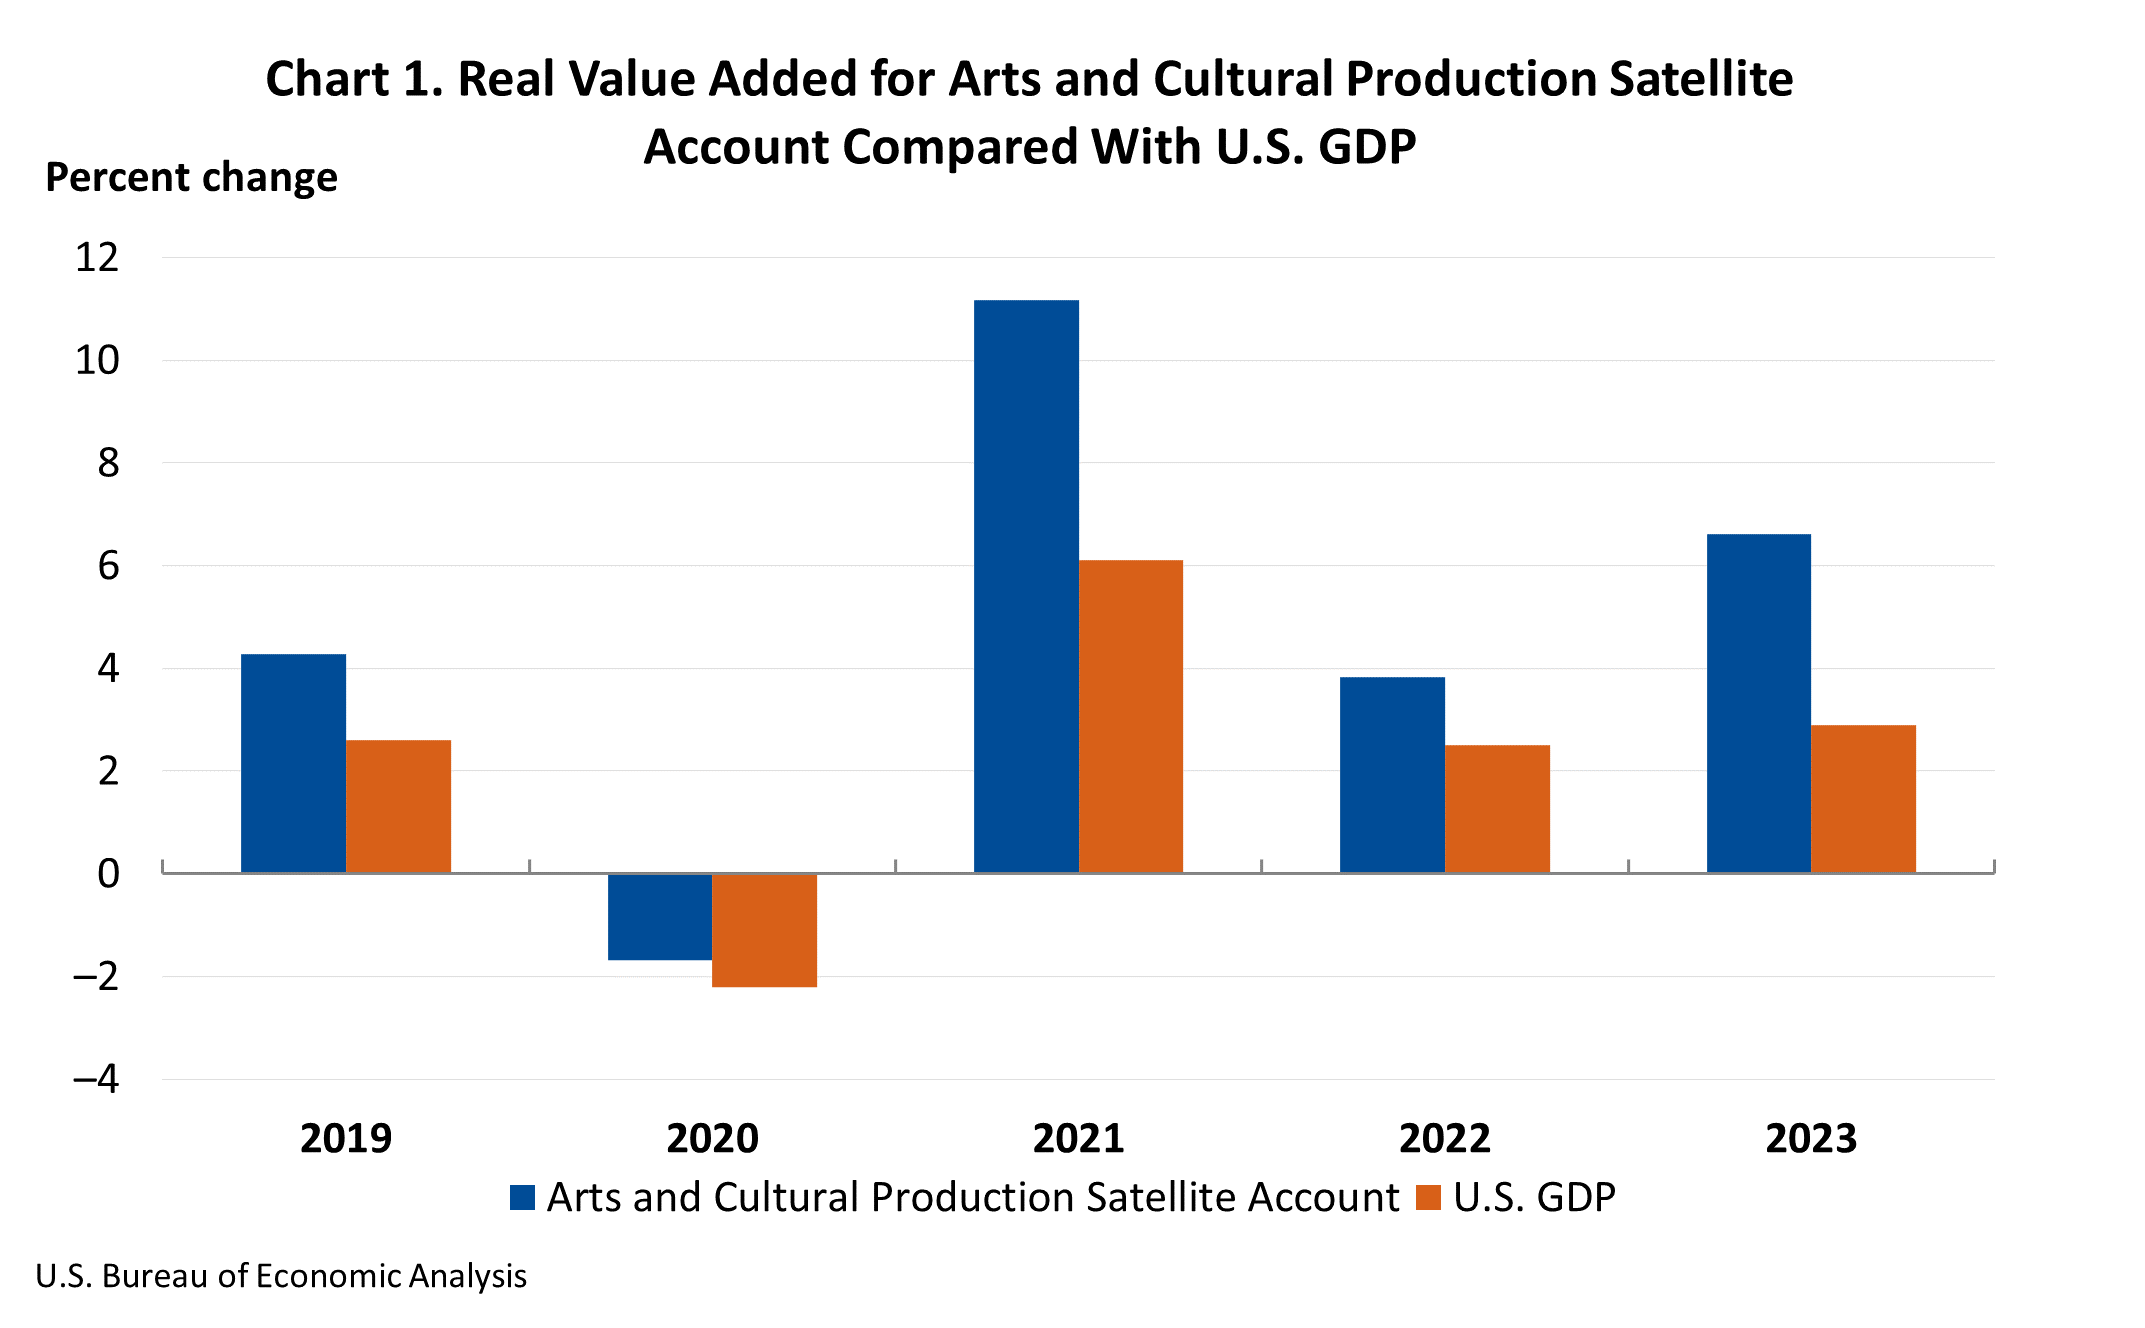
In 2023, the real (inflation-adjusted) economic activity within the arts and cultural sector surged by 6.6 percent. This represents a notable acceleration from the 3.8 percent increase observed in 2022, indicating a robust recovery and expansion trajectory for the industry. In stark contrast, the broader U.S. economy, as measured by real Gross Domestic Product (GDP), grew at a more moderate pace of 2.9 percent in 2023, following a 2.5 percent increase the previous year. This divergence highlights the exceptional performance of the arts and cultural sector, which is increasingly demonstrating its capacity as a key driver of national economic prosperity.
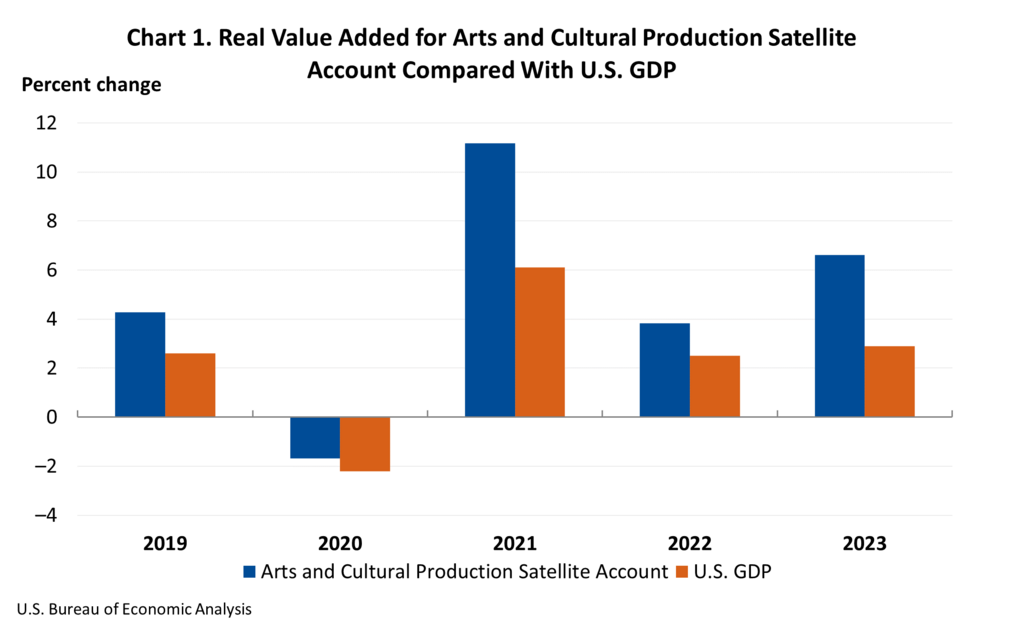
The cumulative economic impact of arts and cultural production in 2023 was substantial, accounting for 4.2 percent of the total U.S. GDP. This translates to a significant monetary contribution of $1.17 trillion, a figure that underscores the sector’s considerable weight within the national economy. This substantial contribution signifies that for every dollar of economic activity generated in the U.S., a considerable portion is directly attributable to the creation, production, and distribution of arts and cultural goods and services.
Deep Dive into Sectoral Performance: Core vs. Supporting Industries
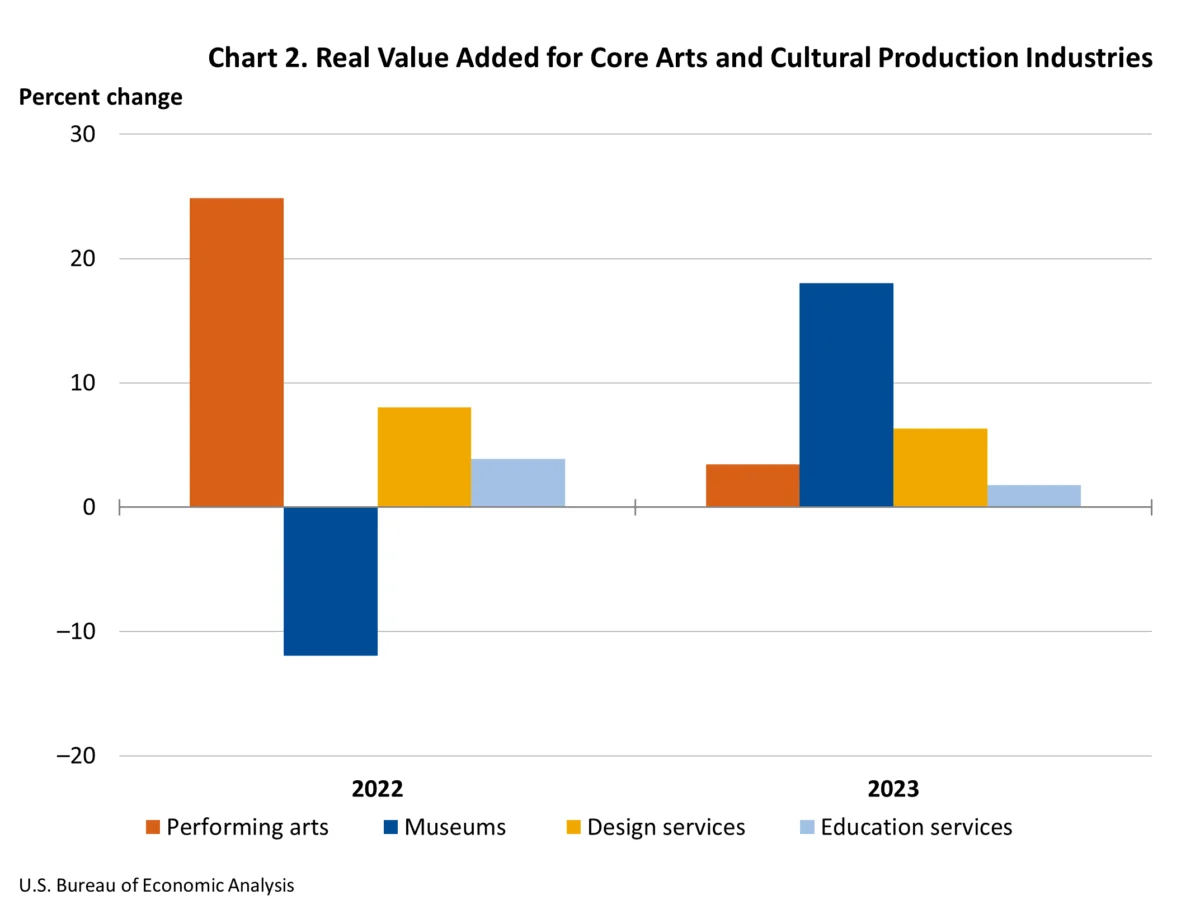
The BEA’s report further dissects the performance of the arts and cultural sector into its constituent components: core and supporting industries. Core arts and cultural production industries, which encompass a wide array of creative endeavors including performing arts, museums, design services, and fine arts education, saw their real value added increase by 5.5 percent in 2023. This sustained growth in foundational creative fields indicates a healthy demand for direct artistic and cultural experiences.
Even more dynamic was the performance of supporting arts and cultural production industries. This category, which includes critical areas such as art support services and information services that facilitate and disseminate creative content, experienced an impressive 7.1 percent increase in real value added. This robust growth in supporting industries suggests that the infrastructure and services that enable the arts and culture sector are expanding and becoming more efficient, further bolstering the sector’s overall economic output.
Nominal Value Added: A Deeper Financial Perspective
When examining nominal value added, which is not adjusted for inflation, the national picture for the arts and cultural sector in 2023 is even more striking, with a 7.6 percent increase. This surge in nominal terms reflects both the volume of economic activity and the price dynamics within the sector.
Supporting arts and cultural production industries were the leading contributors to this nominal growth, achieving an 6.8 percent increase to reach $873.8 billion. Within this category, information services emerged as the primary driver, indicating the growing economic significance of digital platforms, media, and data-driven services that are integral to modern cultural dissemination.
Core arts and cultural production industries also demonstrated strong nominal growth, increasing by 10.6 percent to a substantial $265.8 billion. The leading contributors to this growth within the core sector were performing arts and design services. This suggests a renewed vigor in live performances and a heightened demand for sophisticated design solutions across various industries, both of which are fundamental to the arts and cultural ecosystem.

State-Level Dynamics: A Patchwork of Growth and Variation
The economic impact of the arts and cultural sector is not uniformly distributed across the nation, with significant variations observed at the state level. In 2023, nominal value added in arts and cultural production industries experienced an increase in 47 states and the District of Columbia, underscoring a widespread positive trend. However, the magnitude of this growth varied considerably, with percentage changes ranging from an impressive 14.7 percent in Nevada to a decline of 3.4 percent in Louisiana.
Nevada’s remarkable surge in arts and cultural value added was largely propelled by sectors such as promoters of performing arts and similar events, publishing, and performing arts companies. This indicates a robust expansion in entertainment and cultural offerings, likely driven by the state’s established tourism and entertainment industries. Conversely, Louisiana’s decline was primarily attributed to a downturn in the motion picture industry, suggesting sector-specific challenges or shifts in production activity within the state.
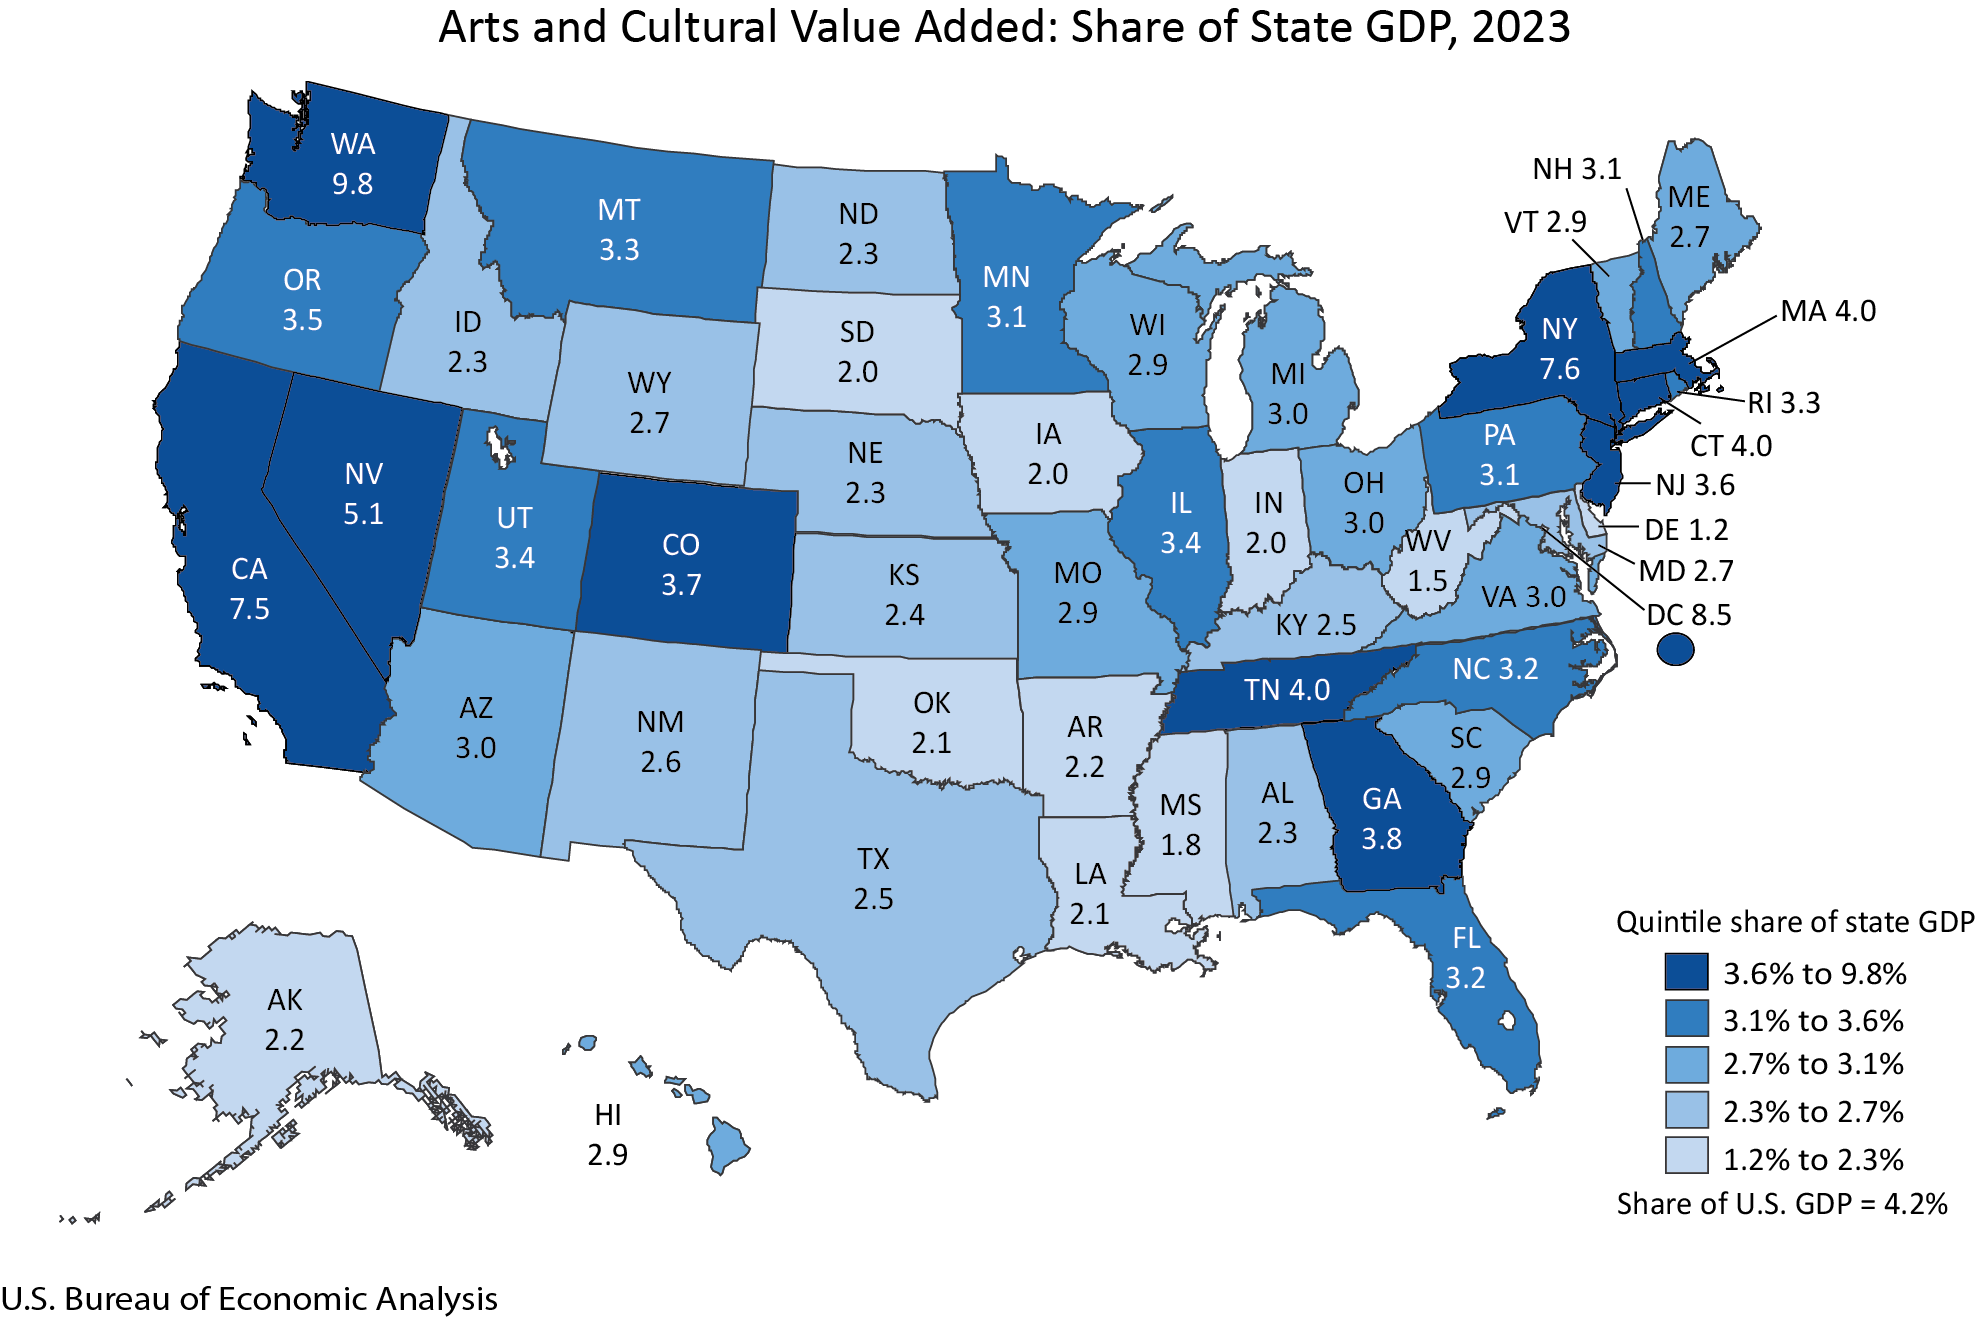
The arts and cultural sector’s contribution to a state’s total GDP also presented a diverse landscape. Washington state led the nation with the highest share, with arts and culture accounting for 9.8 percent of its total GDP. The District of Columbia, New York, California, and Nevada were the only other areas where the arts and cultural share of GDP exceeded 5 percent, highlighting these regions as cultural economic powerhouses. In contrast, Delaware had the lowest share, at 1.2 percent, indicating a comparatively smaller direct economic footprint from the arts and culture sector. The majority of states saw their arts and cultural share of GDP fall between 2 and 5 percent.

The specific industries driving these state-level contributions also varied. In Washington state, publishing and retail industries were significant contributors to its arts and cultural GDP share. The District of Columbia’s strong performance was bolstered by government and advertising sectors. New York’s economic landscape benefited from broadcasting and "other information services." California saw contributions from other information services and motion pictures, while Nevada’s growth was fueled by other information services and promoters of performing arts. These variations underscore the unique economic ecosystems and creative specializations present in different regions of the United States.
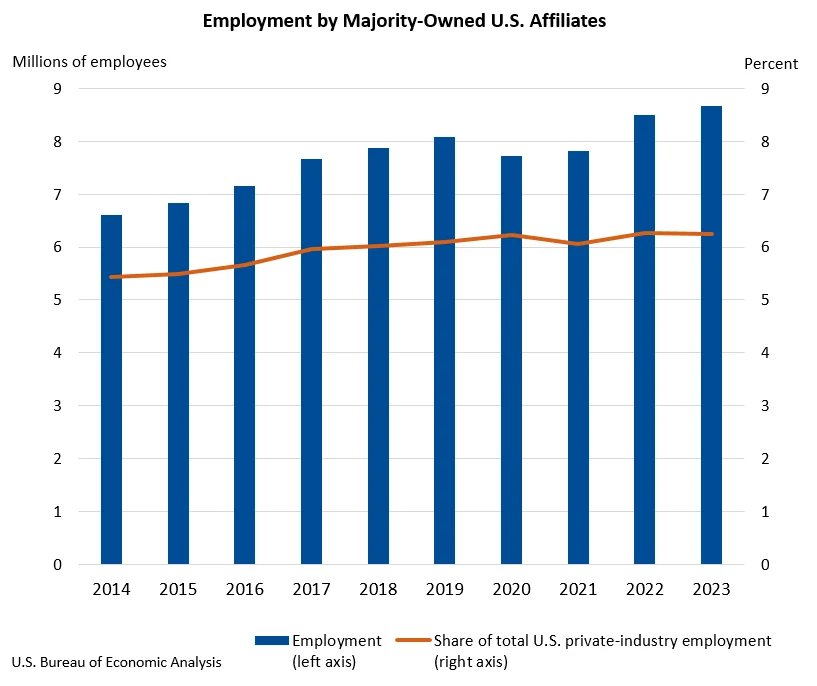
Employment Trends: A Modest but Positive Uptick
Nationwide, arts and cultural employment saw a modest increase of 0.3 percent in 2023, bringing the total number of arts and cultural jobs to 5.4 million. This growth, while not as dramatic as the value added figures, indicates a stable and gradually expanding job market within the sector. Arts and cultural employment increased in 27 states, demonstrating a positive trend in a significant portion of the country.
North Carolina emerged as a leader in job creation within the sector, experiencing a 7.6 percent increase in arts and cultural employment. This growth translated to 167,254 jobs related to arts and culture in the state, representing 3.3 percent of its total employment. Government and retail industries were identified as the leading contributors to this surge in North Carolina. In contrast, Hawaii experienced the largest decrease in arts and cultural employment, with a 6.6 percent decline. Construction and motion pictures were cited as the primary drivers of this decrease in Hawaii, pointing to potential project-based employment fluctuations or shifts in media production.

Compensation Growth: A Steady Rise
Arts and cultural compensation nationwide also exhibited positive growth, increasing by 3.6 percent in 2023. This rise in compensation suggests that the sector is not only creating jobs but also offering increasingly competitive remuneration for its workforce. Compensation in the arts and cultural sector increased in 43 states and the District of Columbia, reflecting a broad-based improvement in earnings across the country. Nevada again stood out with the highest percentage increase in compensation, at 12.7 percent, while Georgia saw the largest decrease, at -6.9 percent.
Background and Methodology: Understanding the Data
The release of the updated Arts and Cultural Production Satellite Account by the BEA is a crucial event for understanding the economic impact of this vital sector. This account provides a detailed and consistent framework for measuring the output, value added, employment, and compensation associated with arts and cultural activities. The BEA’s methodology involves integrating data from various sources, including industry surveys, government administrative records, and other economic indicators, to create a comprehensive picture of the sector’s economic footprint.
The BEA’s commitment to regularly updating these statistics, with the latest release covering data from 1998 to 2023, ensures that policymakers, industry leaders, and the public have access to the most current and accurate information. The incorporation of new and updated source data, along with the annual updates to BEA’s National and Regional Economic Accounts, allows for a more precise capture of the sector’s dynamics, including the evolving landscape of digital media, streaming services, and the gig economy’s impact on creative work. The support from the National Endowment for the Arts (NEA) highlights the federal government’s recognition of the importance of quantifying and understanding the economic contributions of the arts.
Implications and Future Outlook
The robust growth demonstrated by the arts and cultural sector in 2023 carries significant implications for the U.S. economy. As a sector that consistently contributes a substantial portion to national GDP and provides millions of jobs, its continued expansion can serve as a powerful engine for economic recovery and diversification. The outperformance relative to the broader economy suggests that investments in arts and cultural infrastructure, education, and creative industries can yield substantial economic returns.
The state-level data also offers valuable insights for regional economic development strategies. States that have fostered environments conducive to arts and cultural production, such as Nevada and Washington, are reaping significant economic rewards. This suggests that targeted policies aimed at supporting creative entrepreneurs, promoting cultural tourism, and investing in arts education can be highly effective in stimulating local economies.
Looking ahead, the BEA’s commitment to releasing updated statistics annually, with the next release scheduled for March 2026, will provide ongoing insights into the sector’s trajectory. As the arts and cultural landscape continues to evolve with technological advancements and shifting consumer preferences, these updated figures will be critical for understanding emerging trends and informing future policy decisions. The BEA’s Arts and Cultural Production Satellite Account serves as an indispensable tool for appreciating and leveraging the full economic potential of the nation’s vibrant arts and cultural sector.