Lana Rhoades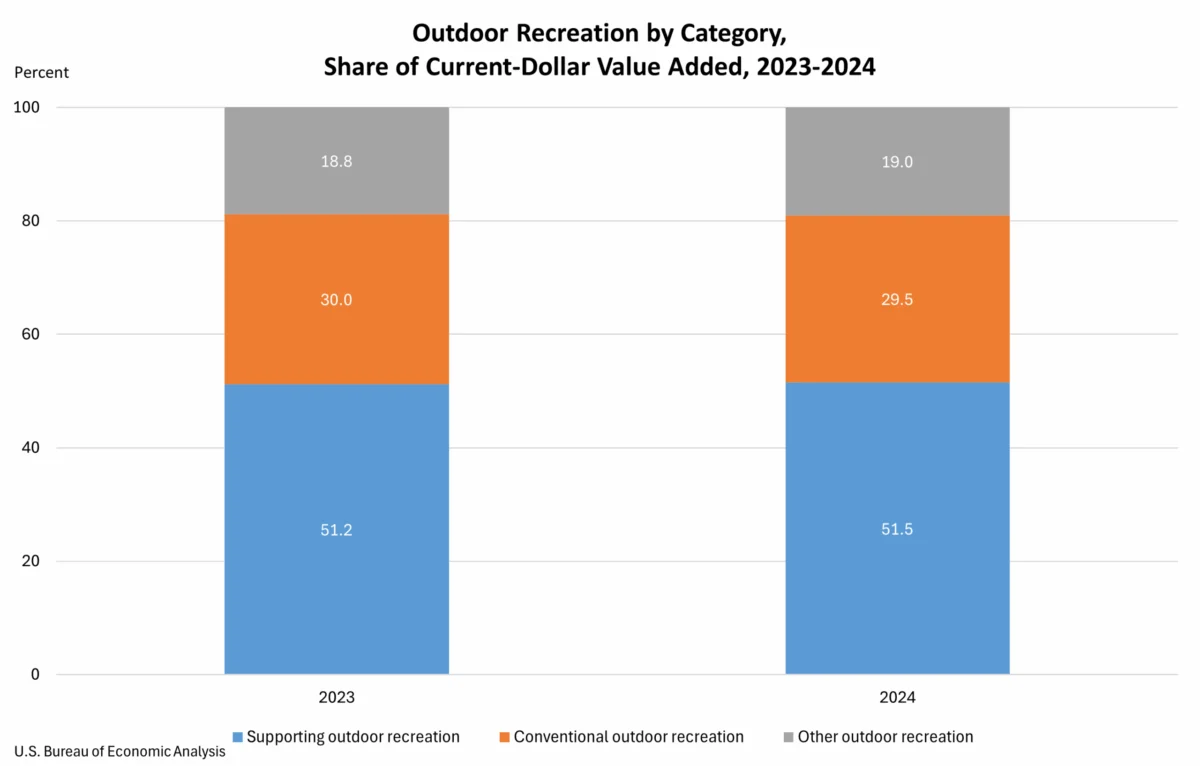
The U.S. Bureau of Economic Analysis (BEA) has unveiled its latest comprehensive report on the nation’s outdoor recreation economy, revealing that this vital sector accounted for a significant 2.4 percent of the current-dollar Gross Domestic Product (GDP) in 2024, totaling an impressive $696.7 billion. The newly released statistics offer an in-depth look at the economic contributions of outdoor activities not only at the national level but also across all 50 states and the District of Columbia. This annual update underscores the enduring and evolving importance of outdoor pursuits in the American economic landscape, providing valuable insights into consumer behavior, industry growth, and regional economic disparities.
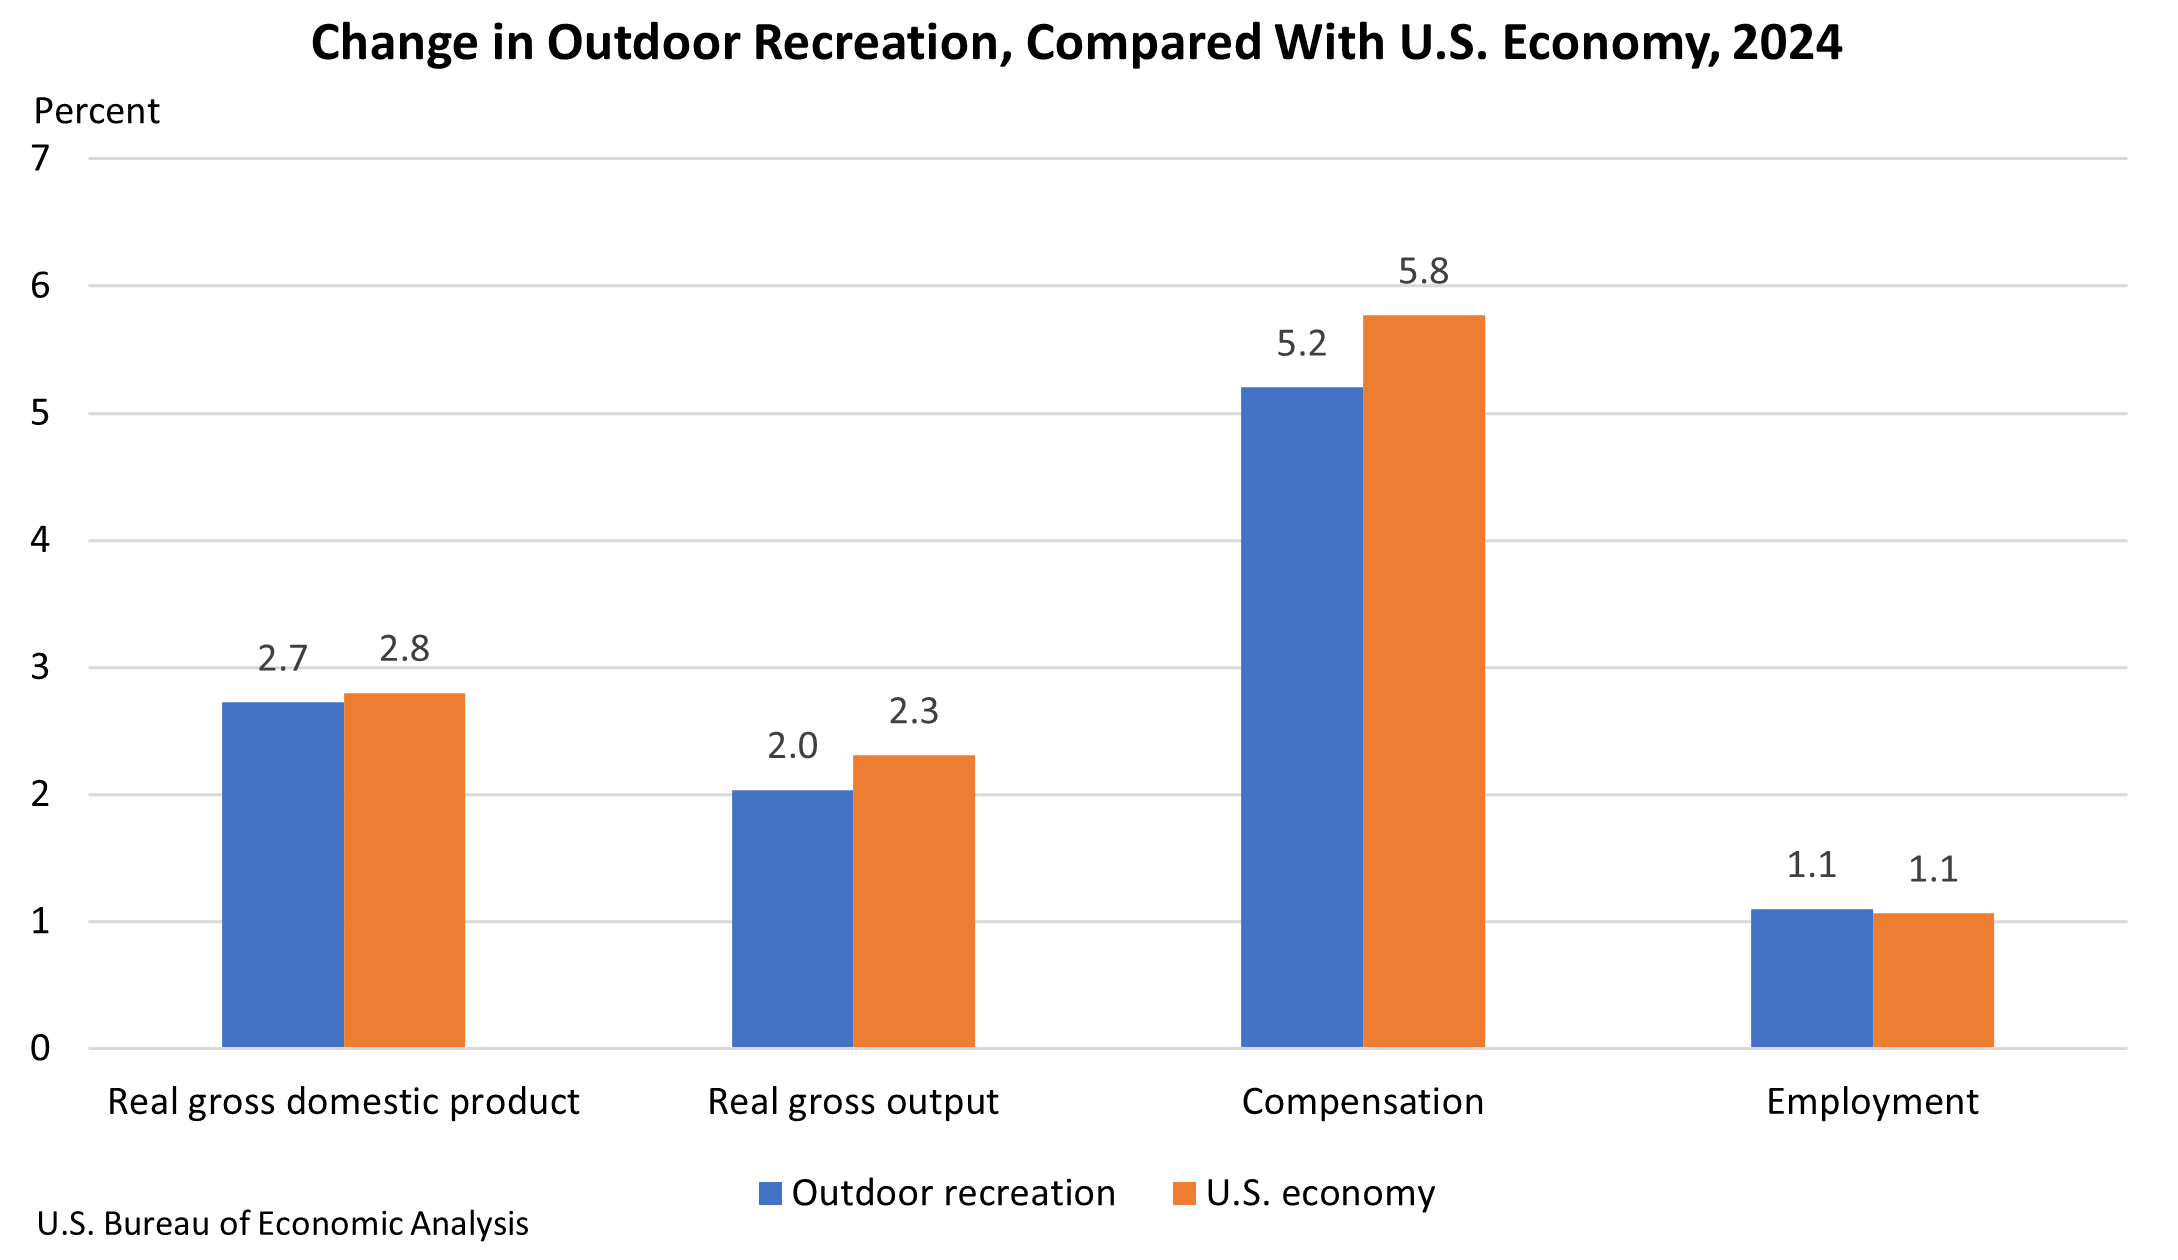
The data indicates that the value added of the outdoor recreation economy experienced a 2.7 percent increase in real terms (adjusted for inflation) in 2024. While this represents a slight deceleration from the robust 5.3 percent growth observed in 2023, it still outpaced the overall U.S. economy’s growth rate of 2.8 percent for the same year. This sustained expansion highlights the resilience of the outdoor recreation sector, even amidst broader economic fluctuations. Beyond GDP contribution, the sector also demonstrated positive momentum in other key economic indicators. Real gross output for outdoor recreation saw a 2.0 percent increase, while compensation for outdoor recreation workers rose by a substantial 5.2 percent. Employment within the sector also expanded, with a 1.1 percent increase nationwide.
National Overview: A Sector of Growing Significance
The BEA’s meticulous data collection and analysis, updated annually, provide a consistent and reliable measure of the outdoor recreation economy. This year’s report, incorporating the latest updates to the National Income and Product Accounts and Industry Economic Accounts, offers the most accurate picture to date of the sector’s performance. The $696.7 billion figure represents the direct contribution of outdoor recreation activities to the nation’s economic output, encompassing a wide array of industries and services that facilitate and support these pursuits.
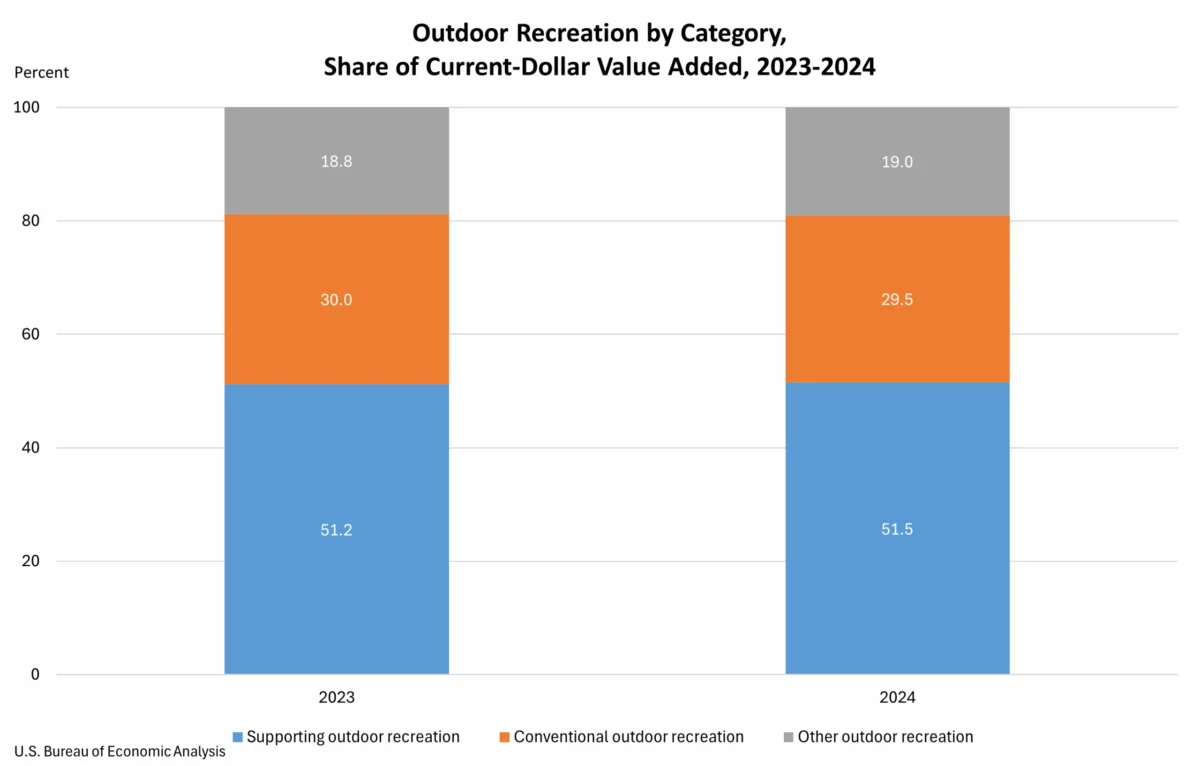
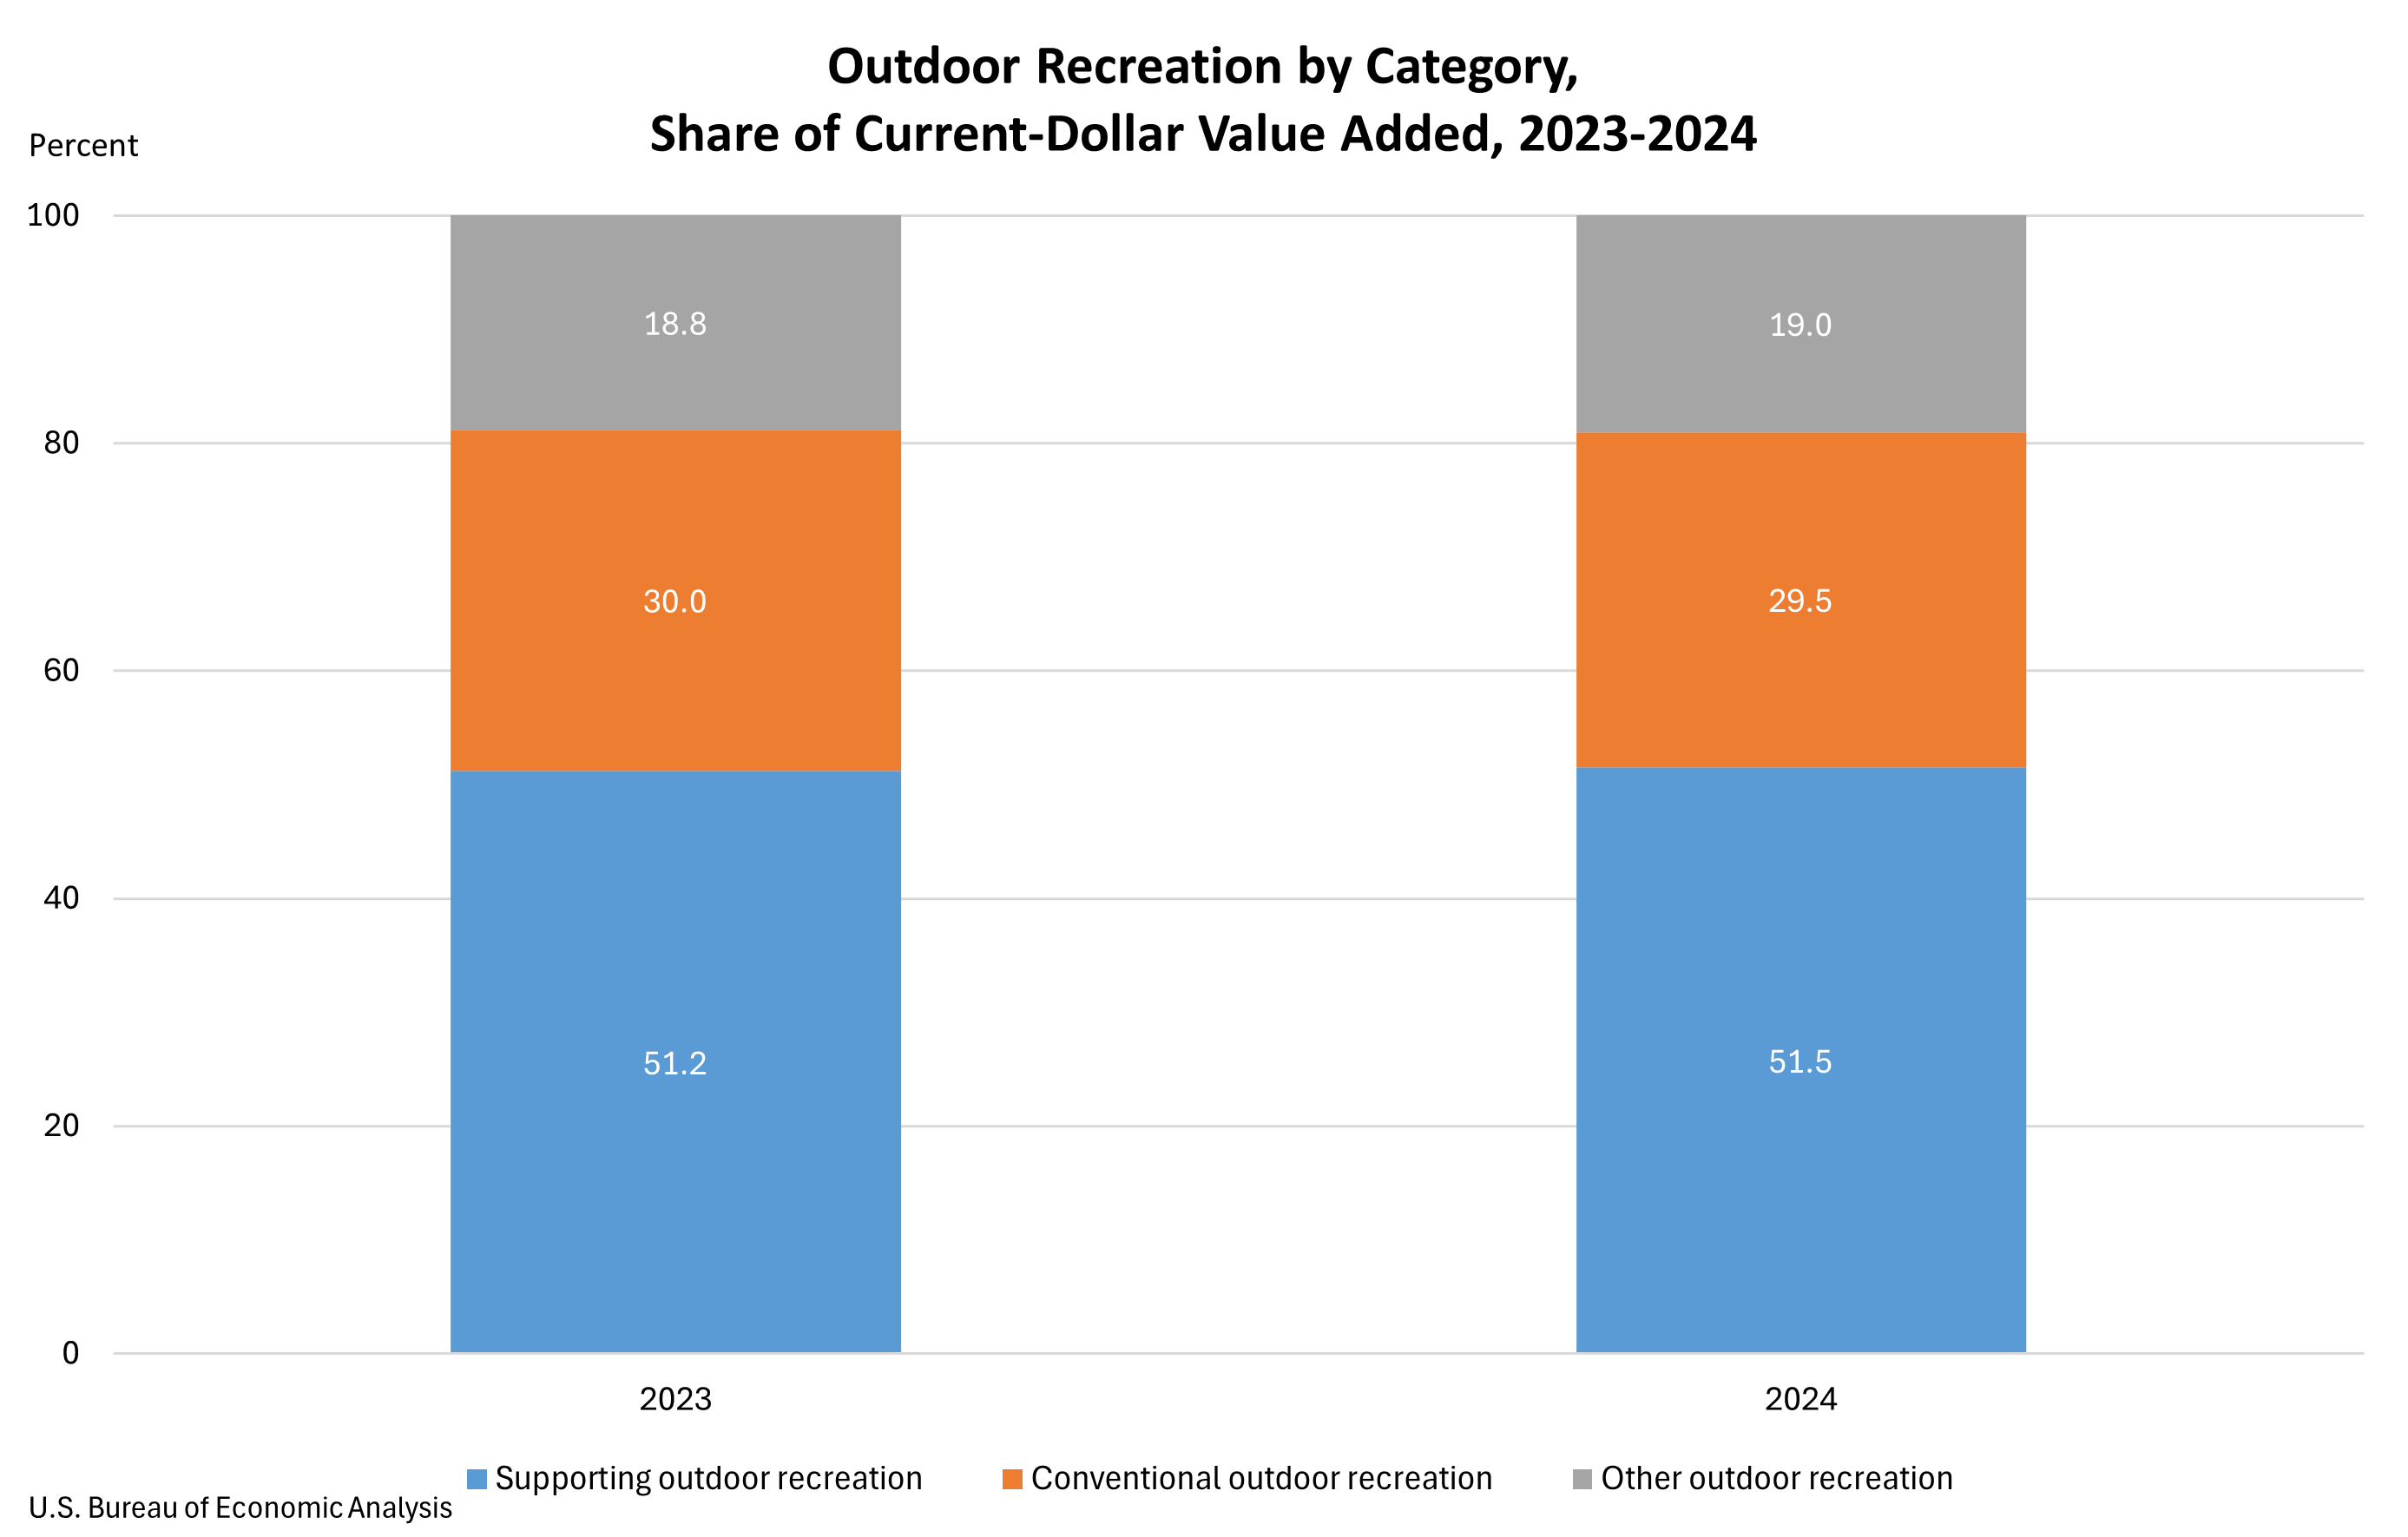
The BEA categorizes outdoor recreation into three broad segments: conventional activities, other activities, and supporting activities. Conventional activities, such as bicycling, boating, hiking, and hunting, accounted for 29.5 percent of the sector’s value added in 2024. "Other outdoor recreation," which includes pursuits like gardening and outdoor concerts, represented 19.0 percent. The largest share, a substantial 51.5 percent, was attributed to "supporting activities." This category is crucial and encompasses essential elements like construction related to recreational facilities, travel and tourism, local transportation, and government expenditures aimed at preserving and promoting outdoor spaces. The growth in supporting activities, particularly in travel and tourism, was driven by increased spending on transportation, accommodation, and food services, underscoring the interconnectedness of the outdoor recreation economy with broader service sectors.
State-Level Disparities: A Tale of Two Economies
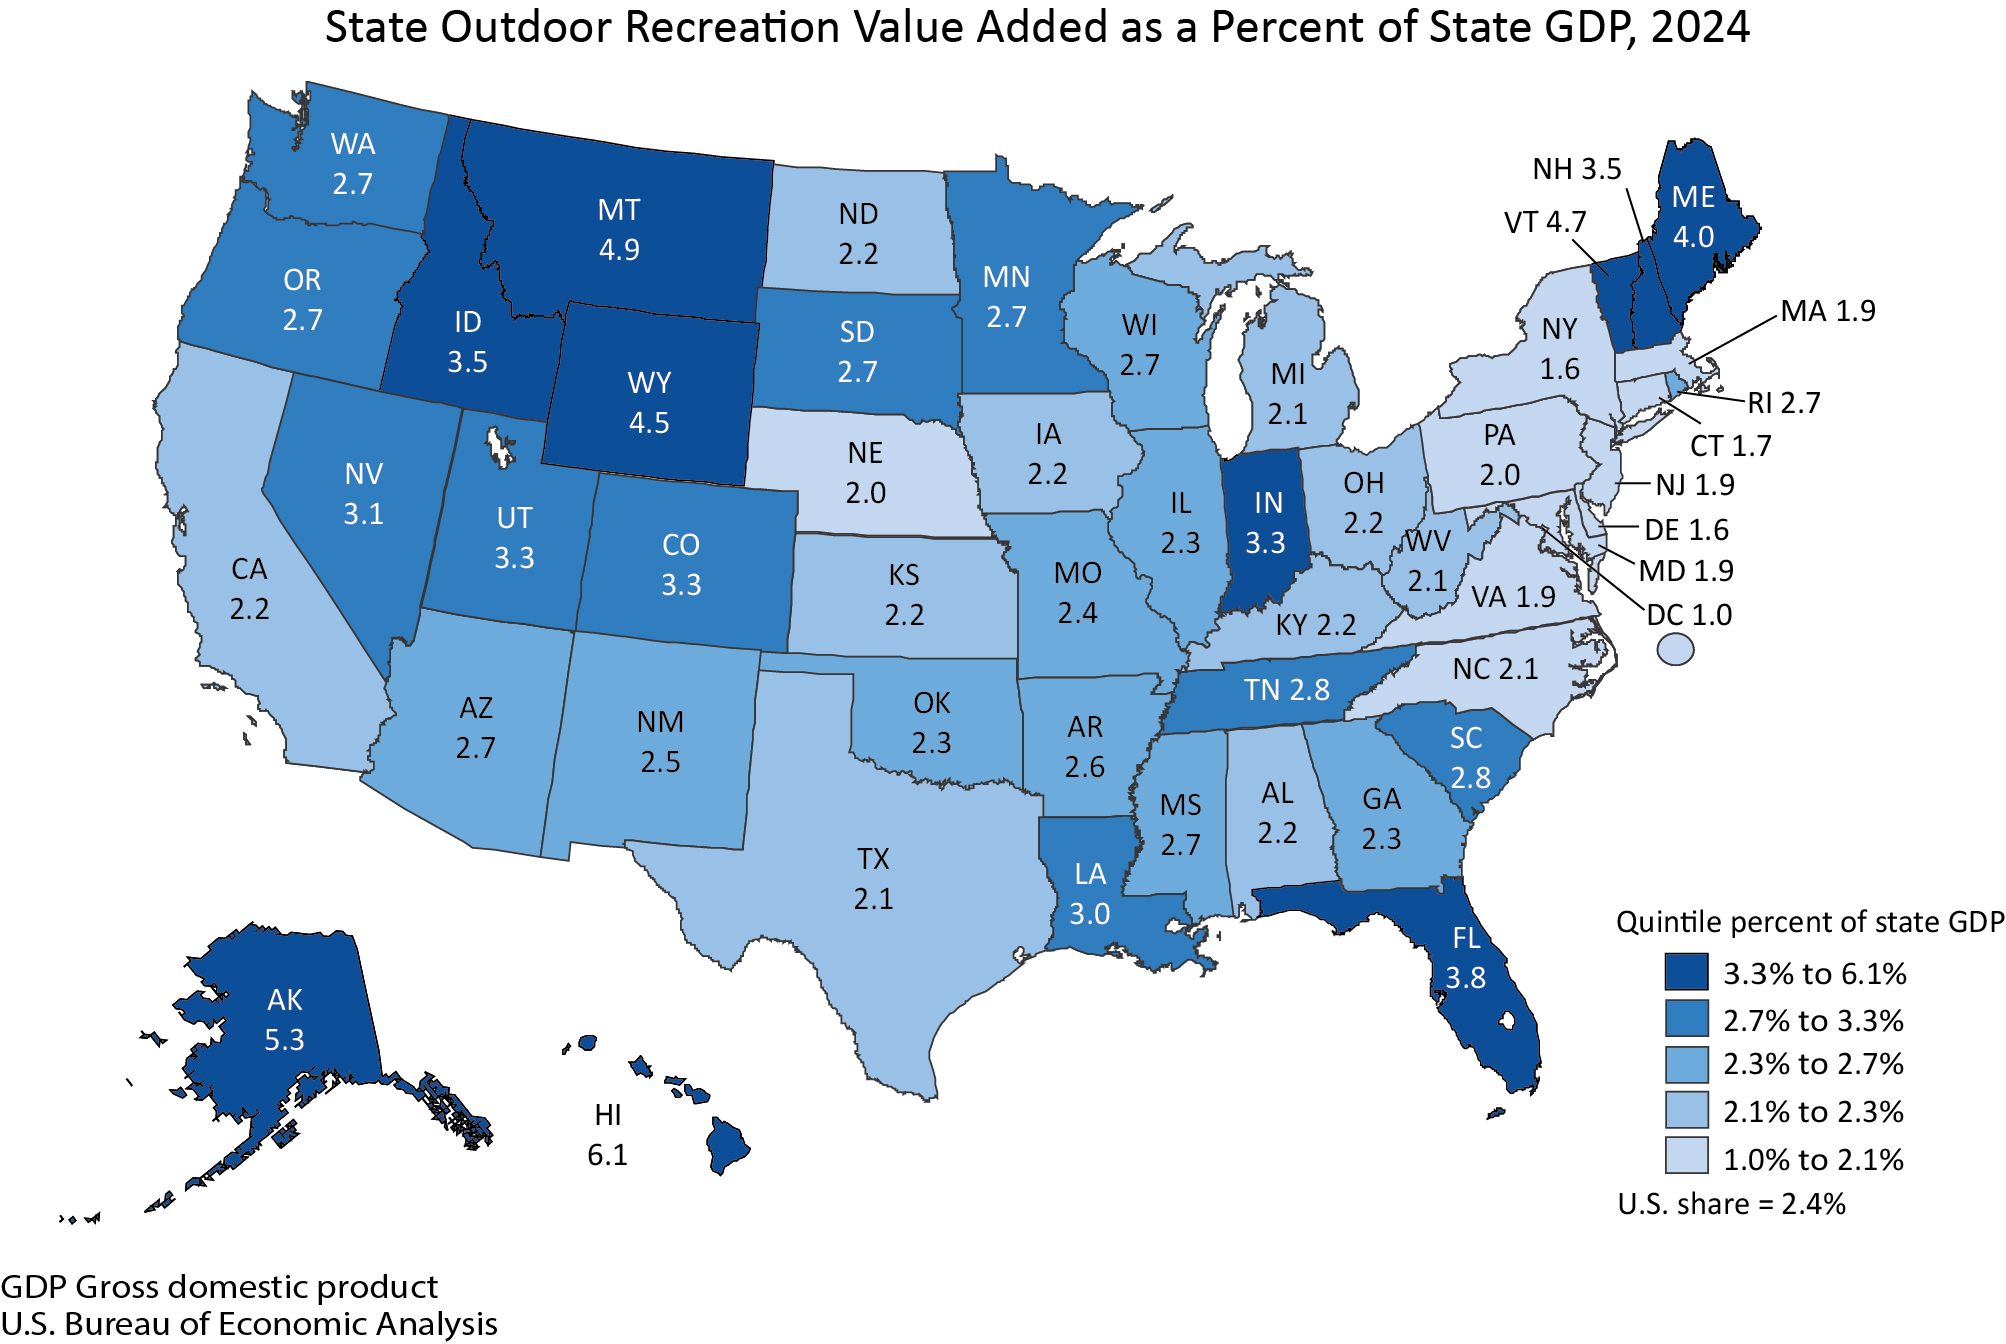
A significant finding of the BEA report is the considerable variation in the economic impact of outdoor recreation across different states. Hawaii emerged as the leader, with its outdoor recreation economy contributing a remarkable 6.1 percent to its state GDP. This highlights the integral role that outdoor pursuits play in the Hawaiian economy, likely driven by its unique natural attractions and strong tourism sector. In stark contrast, the District of Columbia registered the lowest contribution at 1.0 percent of its GDP.
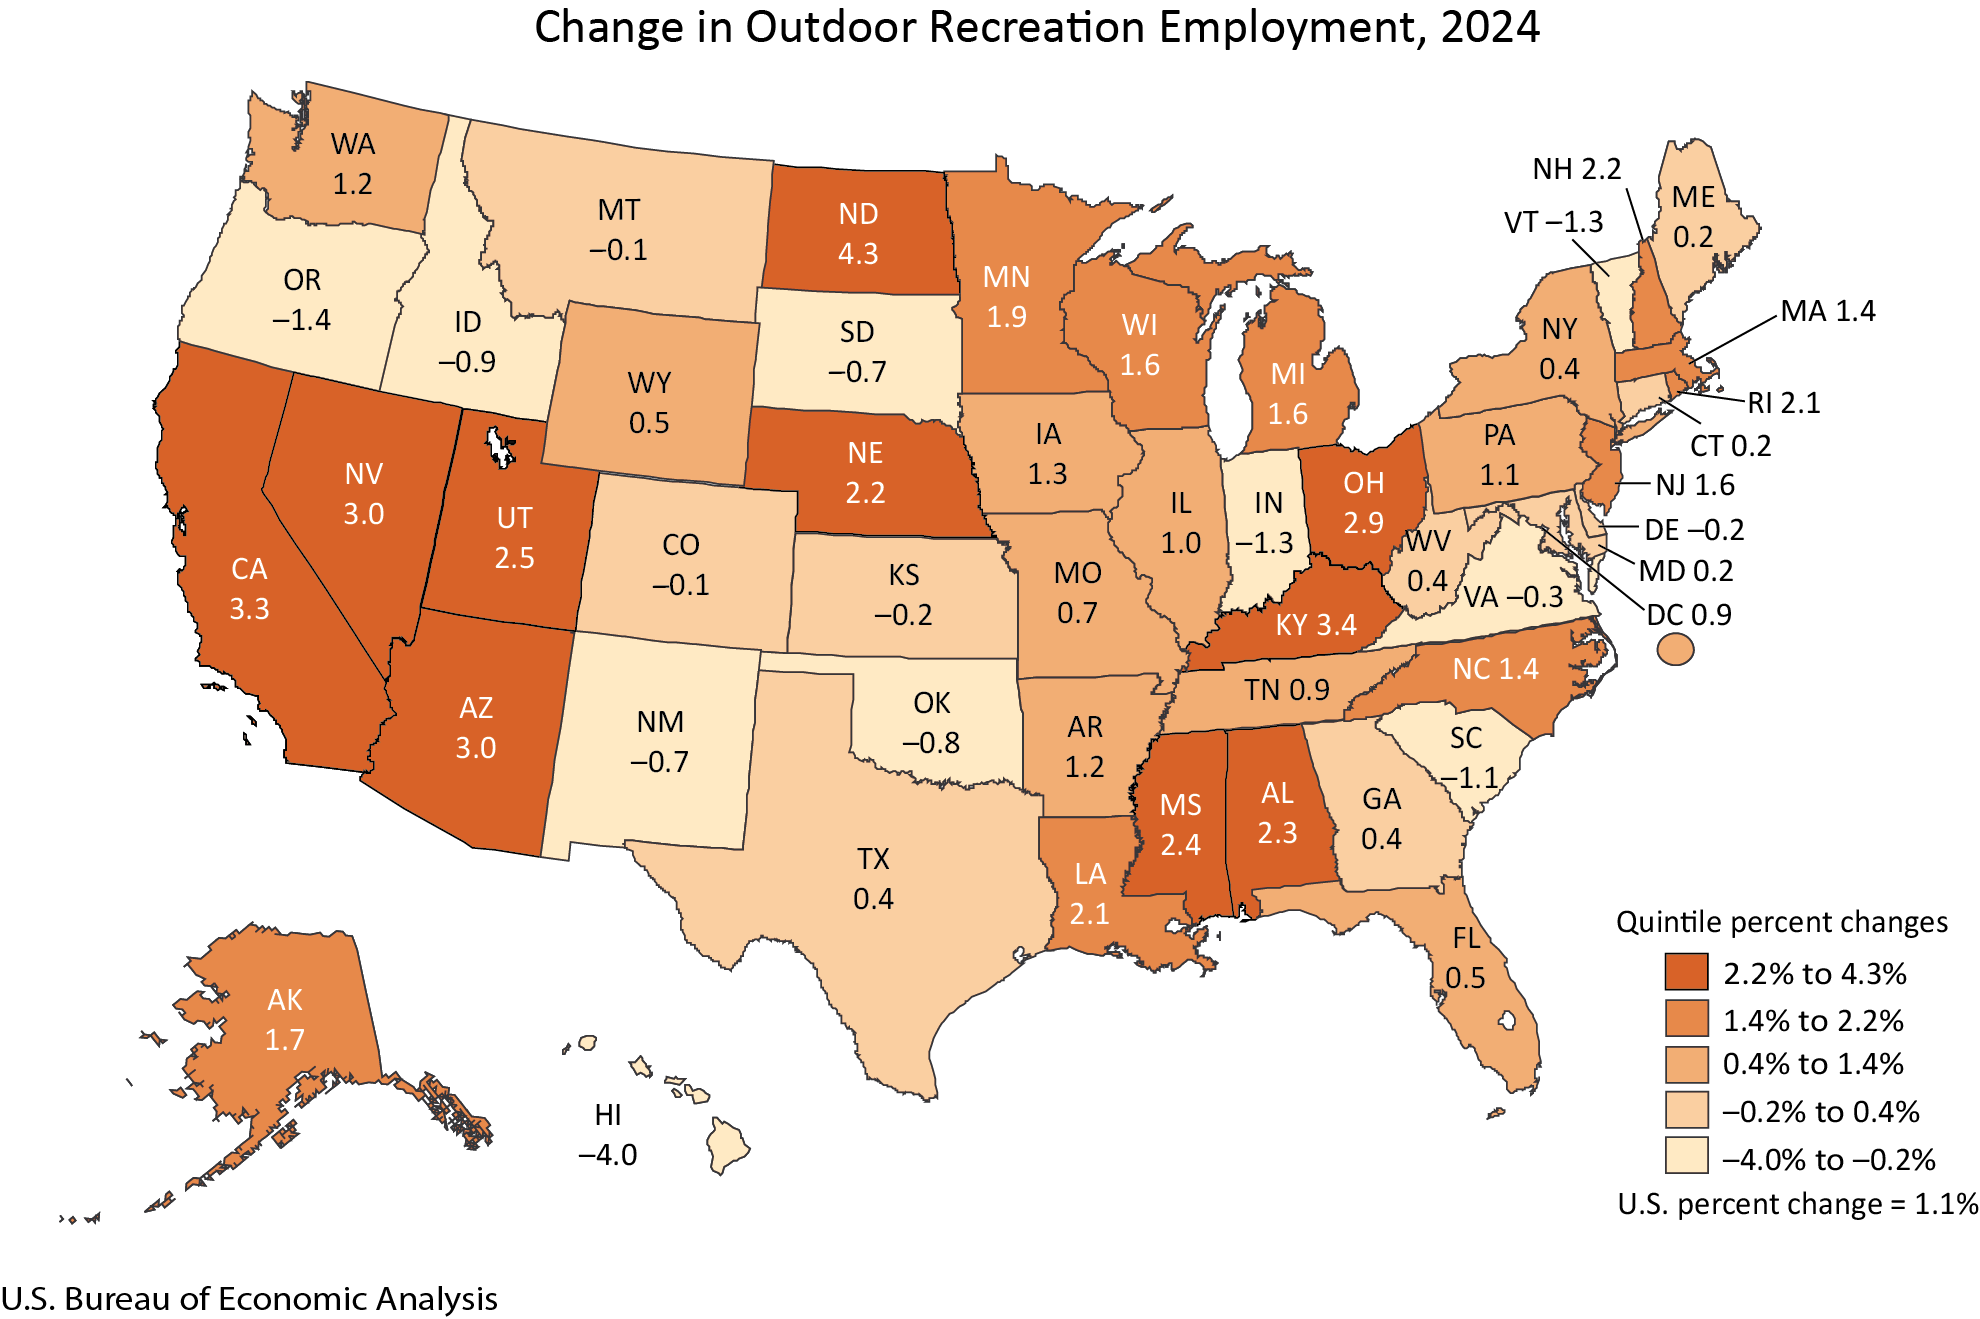
The BEA’s interactive tables provide granular data on state-level performance, allowing for a detailed examination of trends. In 2024, outdoor recreation employment saw an increase in 36 states and the District of Columbia. North Dakota led the nation with an impressive 4.3 percent increase in outdoor recreation employment, a notable achievement that may reflect burgeoning local interest or investment in outdoor infrastructure. Conversely, Hawaii experienced a contraction in outdoor recreation employment, with a decline of 4.0 percent, indicating potential shifts or challenges within its specific outdoor recreation landscape. These state-level variations underscore the diverse economic ecosystems and the varying reliance on outdoor recreation as a driver of employment and economic growth.
Industry Contributions: The Pillars of Outdoor Recreation
The BEA report also dissects the outdoor recreation economy by industry, revealing which sectors are the primary engines of this economic activity. Nationally, the arts, entertainment, recreation, accommodation, and food services industry group emerged as the largest contributor, accounting for $174.4 billion, or 25.0 percent, of the sector’s value added. This segment’s dominance underscores the direct link between experiencing outdoor activities and the services that cater to visitors and participants. California, Florida, and New York led the nation in this category, reflecting their status as major tourism hubs and population centers with significant demand for recreational services.
The retail trade sector followed closely as the second-largest contributor, generating $169.1 billion, or 24.3 percent, of the outdoor recreation value added. This segment’s strength lies in the sale of outdoor gear, equipment, and apparel. California, Texas, and Florida again demonstrated significant contributions in retail trade, indicating a strong consumer market for outdoor products in these populous states.
The manufacturing sector held the third-largest share, contributing $91.3 billion, or 13.1 percent, of the national value added. This segment is crucial for producing the goods that enable outdoor recreation, from bicycles and boats to camping equipment and sporting goods. Indiana and Louisiana were identified as states where manufacturing played a particularly dominant role within their respective outdoor recreation economies, likely due to strong domestic production capabilities in relevant industries. Texas and California also showed substantial contributions in this sector, highlighting their broad industrial bases.
Shifting Trends and Future Outlook
The BEA’s annual update provides a valuable historical perspective, allowing for the tracking of trends over time. The slight deceleration in real GDP growth for outdoor recreation in 2024, from 5.3 percent in 2023 to 2.7 percent, suggests a return to more normalized growth patterns after a period of significant expansion, potentially fueled by pent-up demand following earlier pandemic-related restrictions. However, the continued growth in compensation and employment indicates that the sector remains a significant source of jobs and income.
The increasing share of "supporting activities" within the overall value added is a noteworthy trend. This suggests that the economic impact of outdoor recreation extends beyond direct participation in activities to encompass the infrastructure, services, and travel that enable these experiences. This growing reliance on supporting activities, particularly travel and tourism, implies that investments in transportation networks, hospitality infrastructure, and destination marketing will be crucial for the continued growth of the outdoor recreation economy.
The BEA’s commitment to providing annual updates ensures that policymakers, industry leaders, and researchers have access to timely and accurate data. This information is instrumental in developing informed strategies for economic development, conservation, and public land management. As consumer preferences continue to evolve and the appreciation for outdoor experiences grows, the outdoor recreation economy is poised to remain a significant and dynamic force in the American economic landscape. The detailed insights provided by the BEA will be essential in navigating its future trajectory and maximizing its benefits for communities across the nation.
Methodology and Data Updates
The current release of outdoor recreation economic statistics incorporates significant updates to estimates for 2020 through 2023. These revisions are a result of the BEA’s comprehensive annual update of the National Economic Accounts, which includes the National Income and Product Accounts and the Industry Economic Accounts. This process integrates newly available and revised source data, ensuring the highest level of accuracy in the reported figures. Similarly, state-level statistics have been refined to reflect these updated national data, alongside the 2025 annual update of the Regional Economic Accounts and revised regional source data. This rigorous updating process ensures that the BEA’s outdoor recreation statistics remain a benchmark for economic analysis and policy development. Previously published estimates are accessible through BEA’s Data Archive, allowing for longitudinal analysis and comparison. The BEA plans its next release of Outdoor Recreation Economic Statistics for the Fall of 2026, which will cover data for 2025.