Lana Rhoades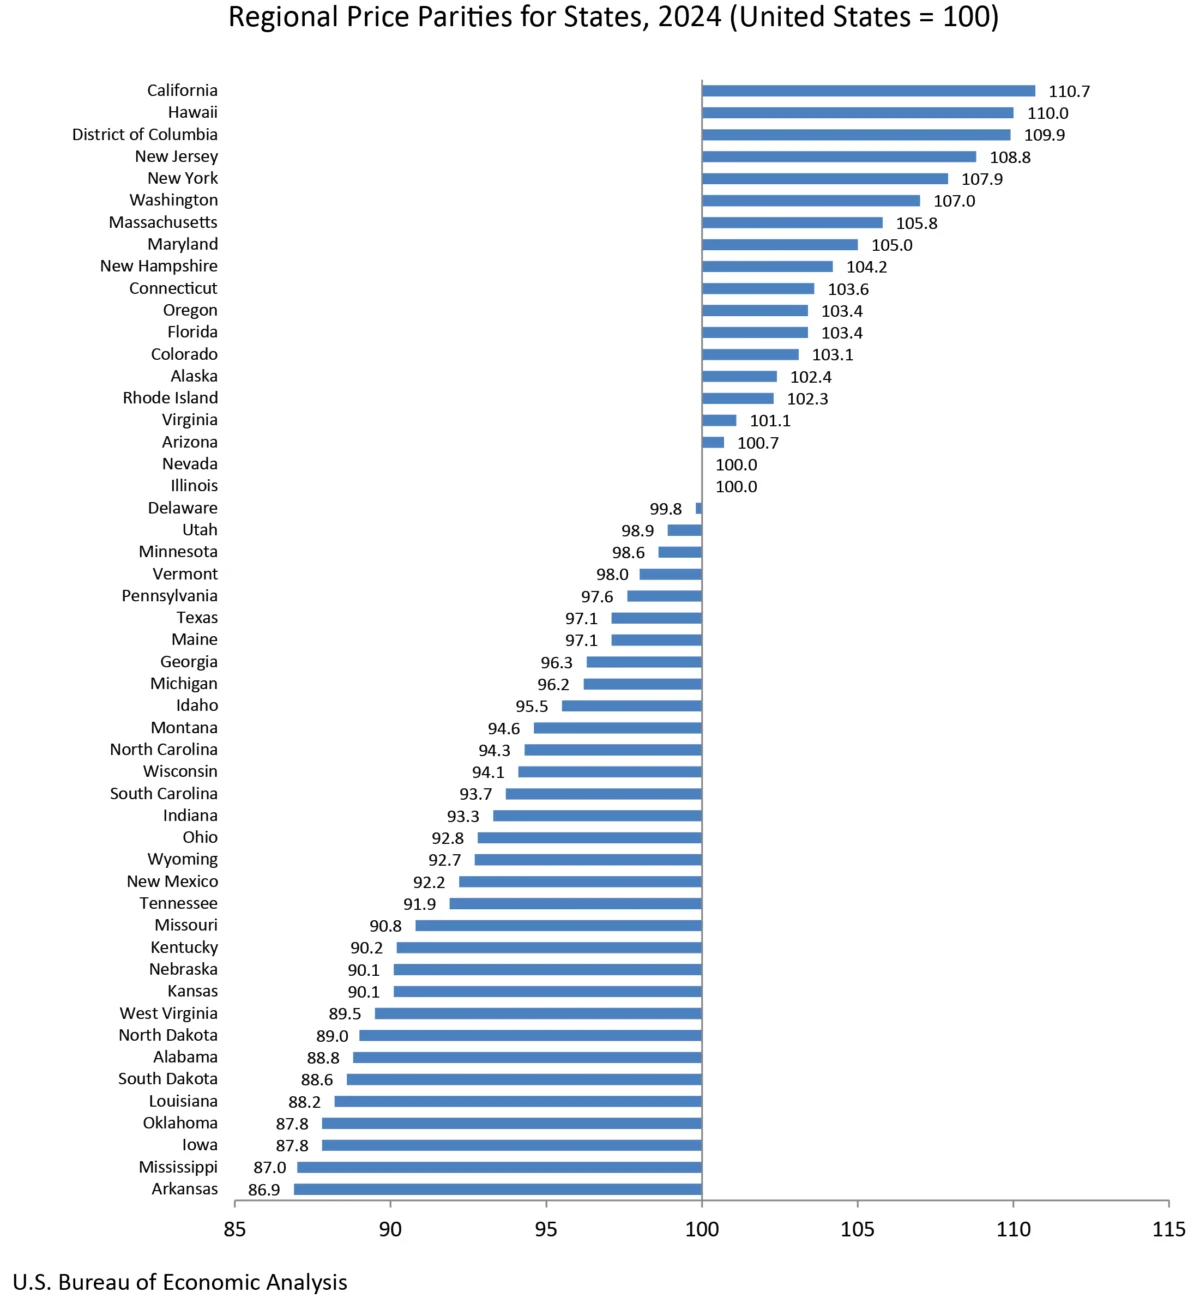
The U.S. Bureau of Economic Analysis (BEA) today unveiled its comprehensive annual statistics for 2024, offering a detailed look at real personal consumption expenditures (PCE), real personal income, and regional price parities (RPPs) across all 50 states and the District of Columbia. This release provides crucial insights into the economic performance and cost of living variations at the state level, serving as a vital resource for policymakers, businesses, and the public alike.
Key Findings in Real Personal Consumption Expenditures (PCE)
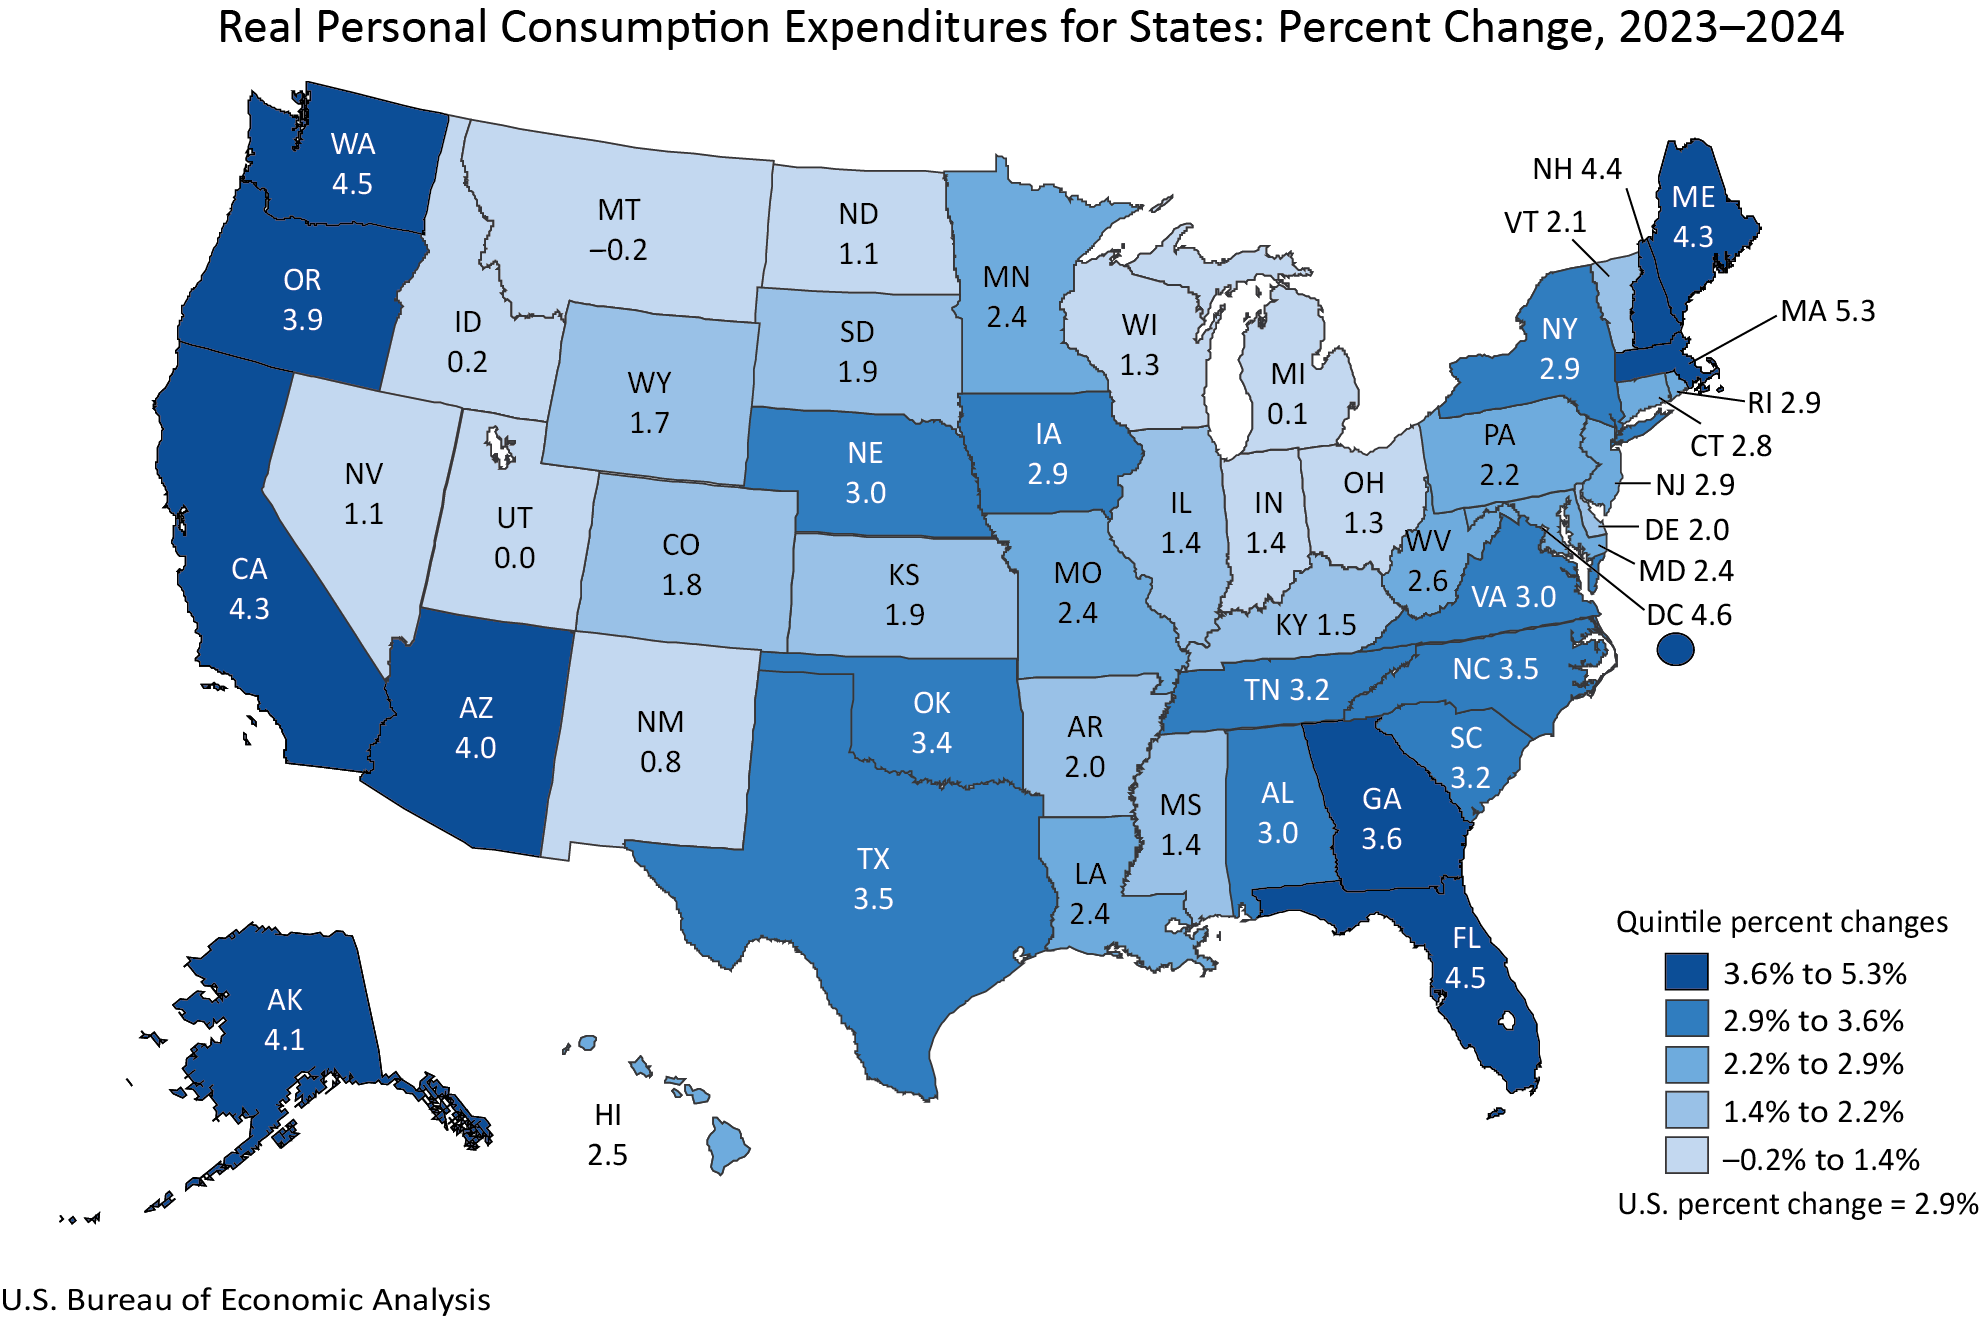
The data reveals a broad-based expansion in real personal consumption expenditures, a key indicator of consumer spending adjusted for inflation. In 2024, 48 states and the District of Columbia experienced an increase in real PCE. This growth signifies that Americans, on average, were able to purchase more goods and services than in the previous year, after accounting for price changes.
Massachusetts led the nation in real PCE growth, with an impressive increase of 5.3 percent. This suggests a robust surge in consumer demand within the Commonwealth, potentially driven by factors such as strong employment, rising wages, or increased consumer confidence. On the other end of the spectrum, Montana saw a slight contraction in real PCE, decreasing by 0.2 percent. While a minor decline, it indicates a potential softening of consumer spending in that state during the period.
Nationally, real PCE grew by 2.9 percent in 2024. This figure is a significant indicator of the overall health of the U.S. economy, reflecting the collective spending habits of its citizens. The national growth rate suggests a moderate but steady expansion in consumer activity.
When examining current-dollar PCE, which does not adjust for inflation, the increase was more pronounced at 5.6 percent nationally. This difference between current-dollar and real PCE highlights the impact of inflation. The national PCE price index, which measures the average price level of consumer goods and services, rose by 2.6 percent in 2024. The fact that current-dollar PCE outpaced the PCE price index indicates that, on average, consumers were spending more not only due to rising prices but also due to an actual increase in the volume of goods and services purchased.
Real Personal Income Shows Widespread Growth
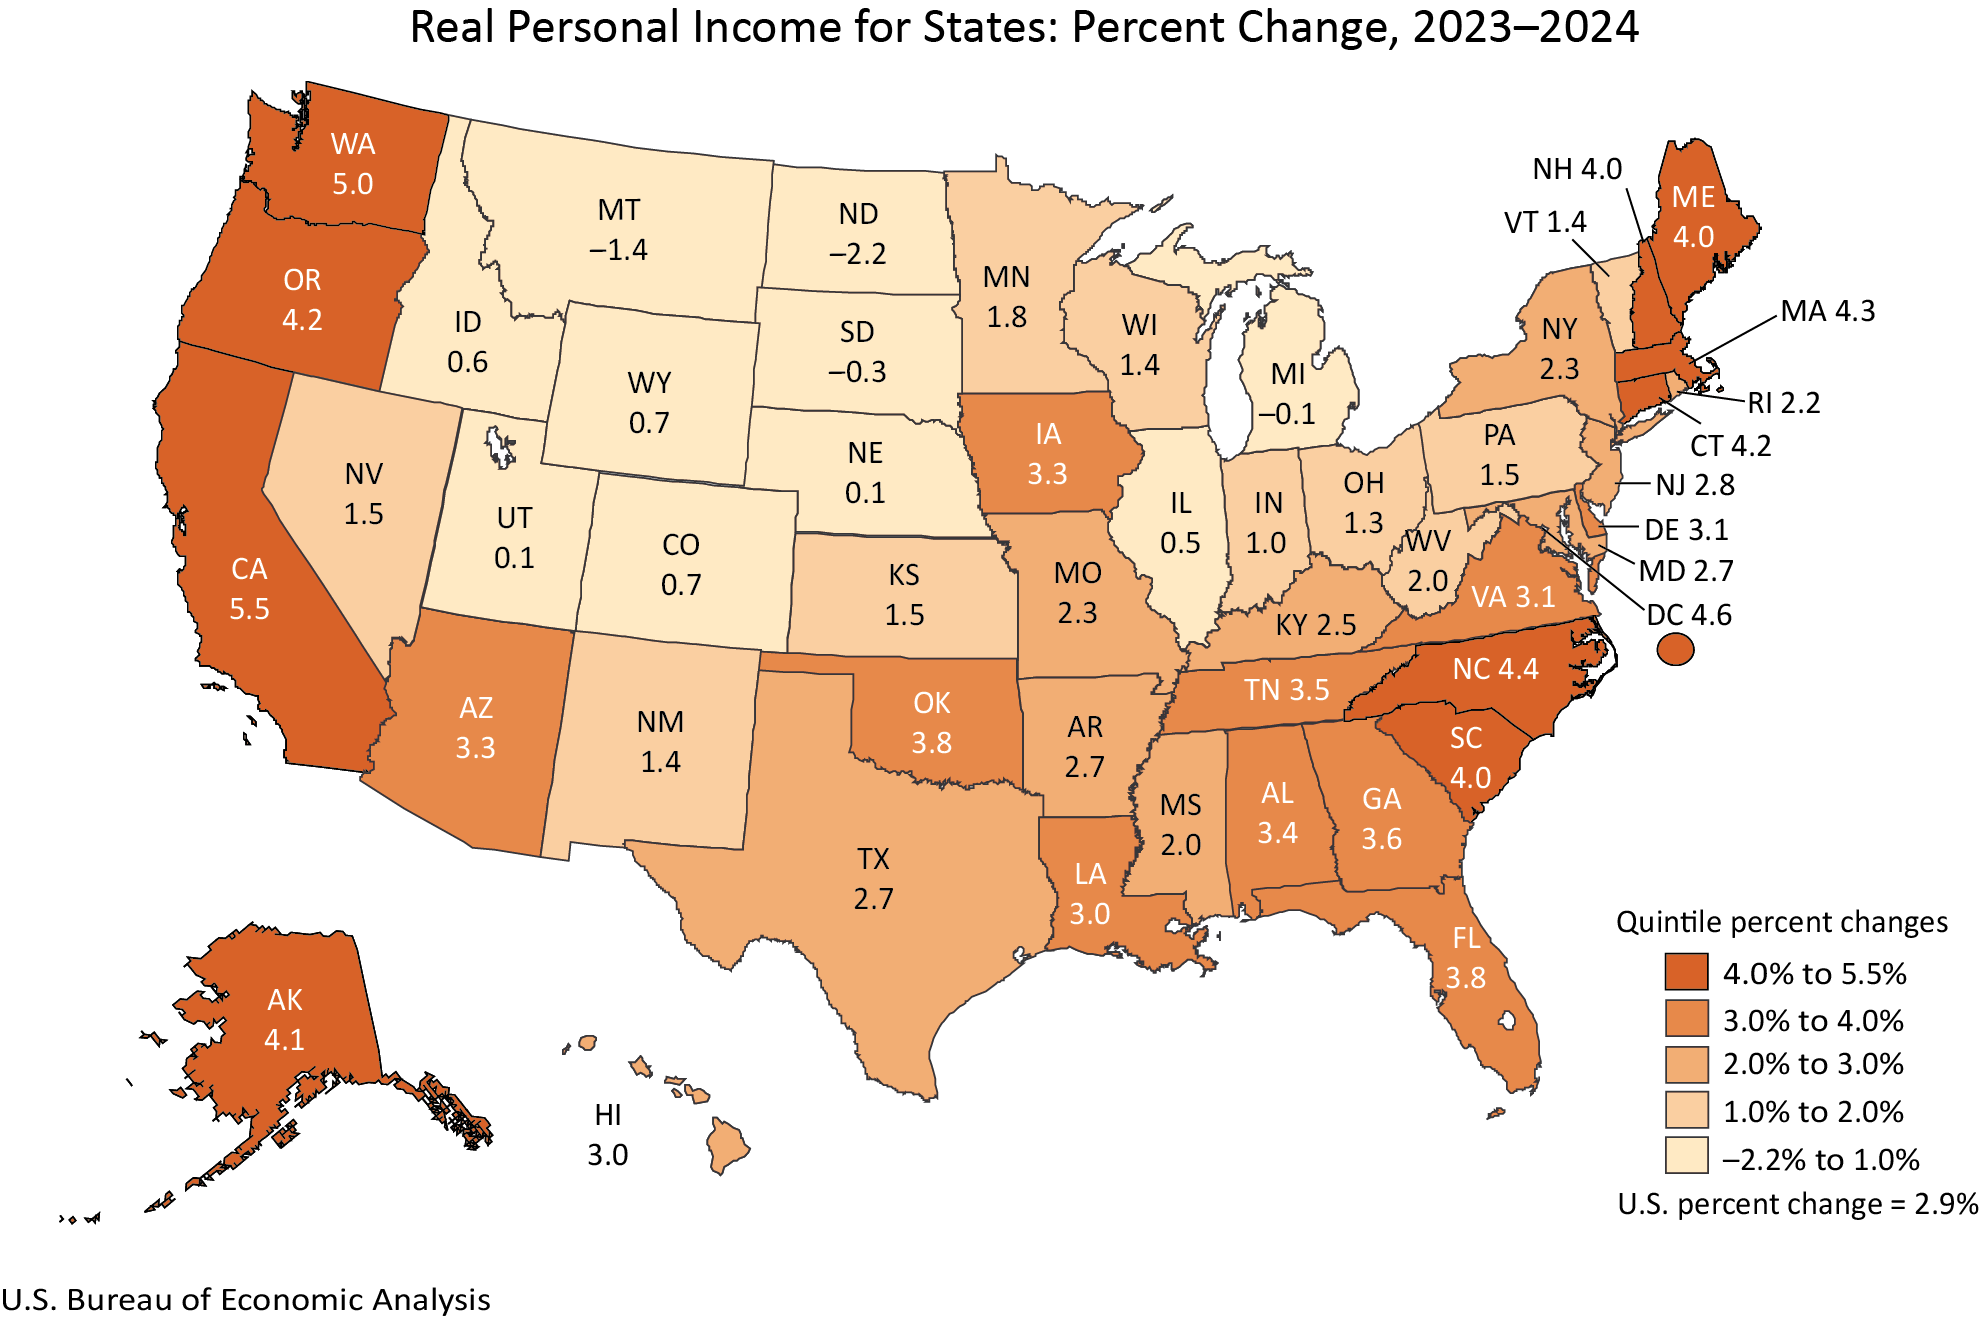
Complementing the spending data, the BEA’s statistics on real personal income paint a picture of widespread income gains across the United States. In 2024, 46 states and the District of Columbia witnessed an increase in real personal income, meaning that individuals’ earnings, adjusted for inflation, rose in these jurisdictions. This indicates an improvement in the purchasing power of a significant majority of Americans.
California stood out with the highest growth in real personal income, experiencing a substantial increase of 5.5 percent. This strong performance suggests that the Golden State’s economy generated significant real income gains for its residents, potentially due to robust job creation, high-paying industries, or substantial wage increases. Conversely, North Dakota experienced a decline in real personal income, falling by 2.2 percent. This downturn could be attributed to various factors, such as fluctuations in key industries, changes in employment levels, or a slowdown in economic activity.
Nationally, real personal income grew by 2.9 percent in 2024, mirroring the growth in real PCE. This alignment suggests a healthy economic environment where income growth is keeping pace with, or slightly exceeding, the increased cost of living. Similar to PCE, current-dollar personal income saw a more significant increase of 5.6 percent nationally, again outpacing the national PCE price index of 2.6 percent. This further reinforces the notion that real purchasing power expanded for many Americans.
Regional Price Parities: Understanding Cost of Living Differences
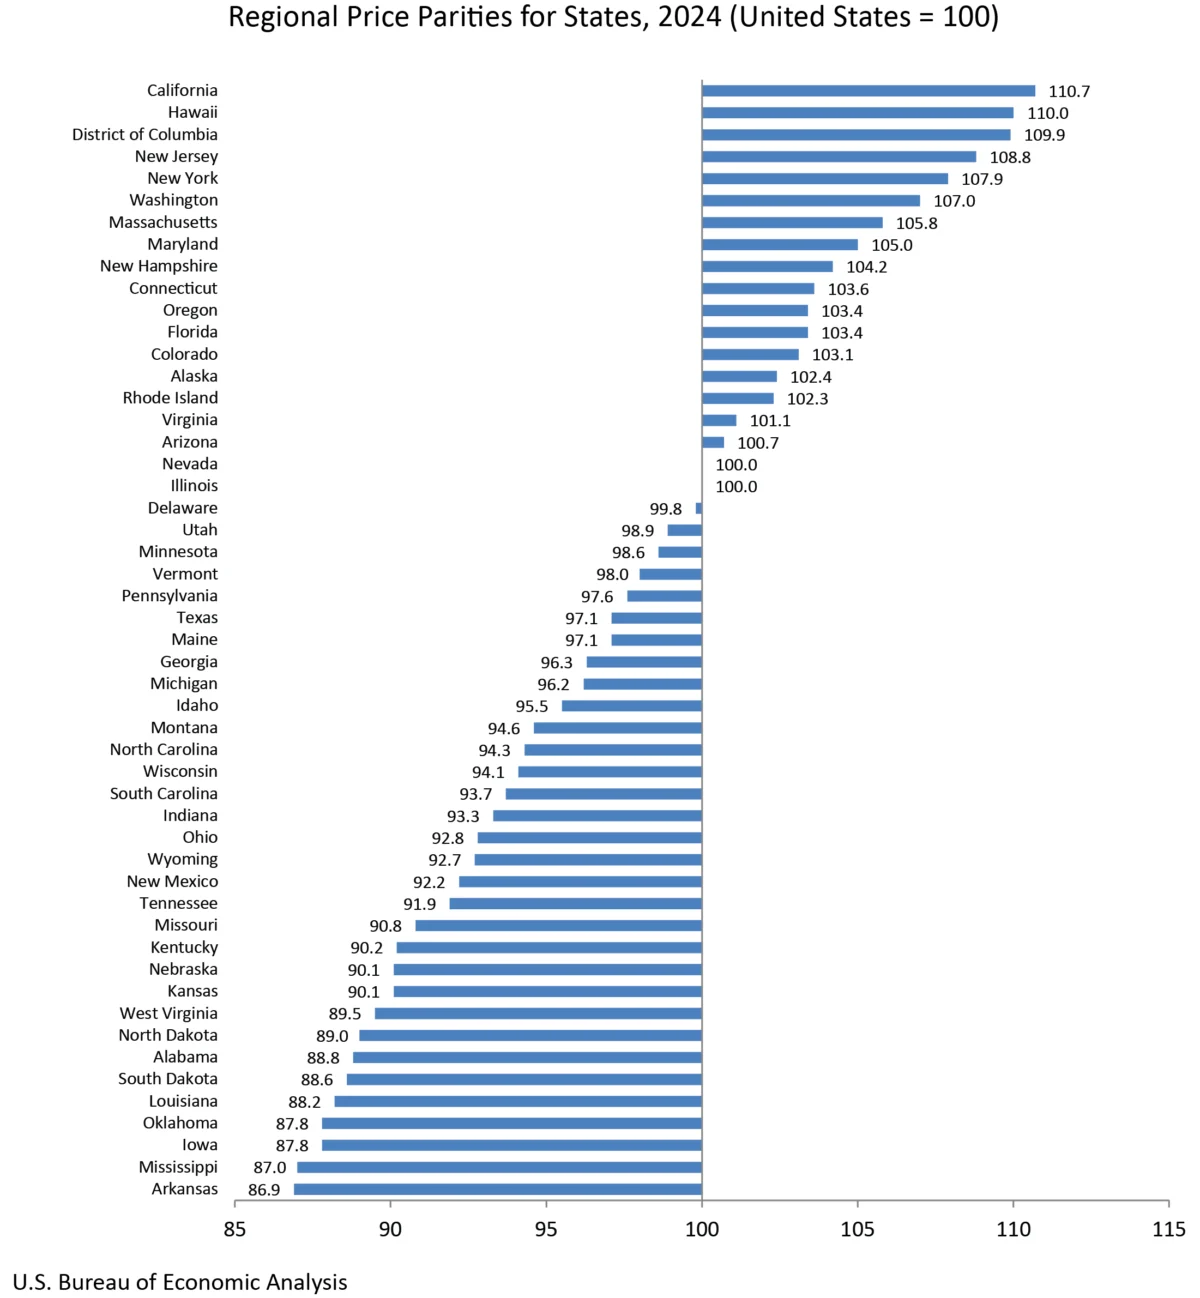
The release also includes updated Regional Price Parities (RPPs), which are crucial for understanding the variations in the cost of living across different states. RPPs measure the differences in price levels for a given year, expressed as a percentage of the overall national price level. They are derived by adjusting current-dollar estimates by the regional price parity and the national PCE price index.
The "all items RPP" encompasses all consumption goods and services, including housing rents. Housing costs, particularly rents, are frequently identified as a primary driver of disparities in RPPs among different regions. States with higher RPPs generally have a higher cost of living, meaning that a given amount of money buys less than it would in a state with a lower RPP. Conversely, states with lower RPPs offer a more affordable cost of living.
The BEA’s interactive data application also provides metropolitan area RPP statistics, offering a more granular view of price level differences within states and across major urban centers. These detailed figures are invaluable for understanding the localized impact of cost of living variations.
Historical Revisions and Data Updates
A significant aspect of this annual release is the revision of historical data. The BEA has updated its annual estimates of real PCE by state and real personal income by state from 2008 to 2023. These revisions incorporate new and more comprehensive source data, ensuring greater accuracy and detail in the historical economic record. This alignment with the National Income and Product Accounts and GDP by industry statistics, released previously, provides a more cohesive and reliable economic narrative.
Furthermore, the BEA has released new estimates of real per capita PCE and real per capita personal income for 2024. These per capita figures, calculated using U.S. Census Bureau population data from 2020 through 2024, offer a valuable perspective on the average economic well-being of individuals within each state.
Discontinuation of Metropolitan Area Statistics
In a notable change, the BEA has announced the discontinuation of publishing statistics for metropolitan statistical areas and their metropolitan and nonmetropolitan portions with the release of the 2024 data. While real PCE and real personal income will continue to be reported at the state level, and RPPs will still be available for state and local areas, the granular breakdown by metropolitan areas is being phased out. This decision aims to streamline data reporting and focus resources on state-level analysis. The BEA has provided a Frequently Asked Questions (FAQ) document to address user queries regarding this change.
Evolution of Data Presentation
The BEA has also updated its presentation of data tables. Moving forward, data previously published within news releases will now be exclusively available through the BEA’s online Interactive Data Application. This move is intended to reduce duplication, enhance efficiency, and provide users with more flexible and comprehensive data access. The customizable tables within the application allow for full time-series analysis and can be downloaded in various formats, including PDF, Excel, and CSV. This shift signifies a move towards a more dynamic and user-driven data dissemination model.
Broader Economic Context and Implications
The release of these state-level economic indicators provides a critical snapshot of the nation’s economic landscape. The widespread growth in real PCE and real personal income suggests a generally positive economic environment in 2024, characterized by increasing consumer purchasing power and economic activity.
The disparity in growth rates across states, however, underscores the uneven nature of economic development within the U.S. States with robust growth in income and spending are likely benefiting from strong underlying economic fundamentals, such as diversified economies, investment in innovation, and favorable business climates. Conversely, states experiencing slower growth or declines may face challenges related to industry concentration, labor market conditions, or external economic shocks.
The RPP data is particularly important for understanding the real value of income and spending. A high nominal income in a state with a very high cost of living may translate to less actual purchasing power than a lower nominal income in a more affordable state. This nuanced understanding is vital for economic planning, policy development, and individual financial decisions.
For policymakers, these statistics offer invaluable data for assessing the effectiveness of economic policies, identifying areas of strength and weakness, and targeting interventions. Businesses can use this information to inform strategic decisions regarding market entry, expansion, and investment. For individuals, the data provides context for understanding their local economic conditions and making informed decisions about where to live, work, and invest.
Future Outlook and Data Availability
The BEA has indicated that the 2024 data will be superseded with the release of the 2025 statistics on December 10, 2026. This regular cycle of updates ensures that the economic data remains current and reflective of evolving economic conditions. Original data featured in past releases can be accessed through the BEA’s Data Archive, providing a comprehensive historical record. The next release, scheduled for December 10, 2026, will present the 2025 real personal consumption expenditures and real personal income by state.
The comprehensive nature of this release, from macroeconomic trends to regional cost-of-living variations, underscores the BEA’s commitment to providing detailed and timely economic intelligence. These statistics serve as a foundational element for informed decision-making across all sectors of the American economy.