Lana Rhoades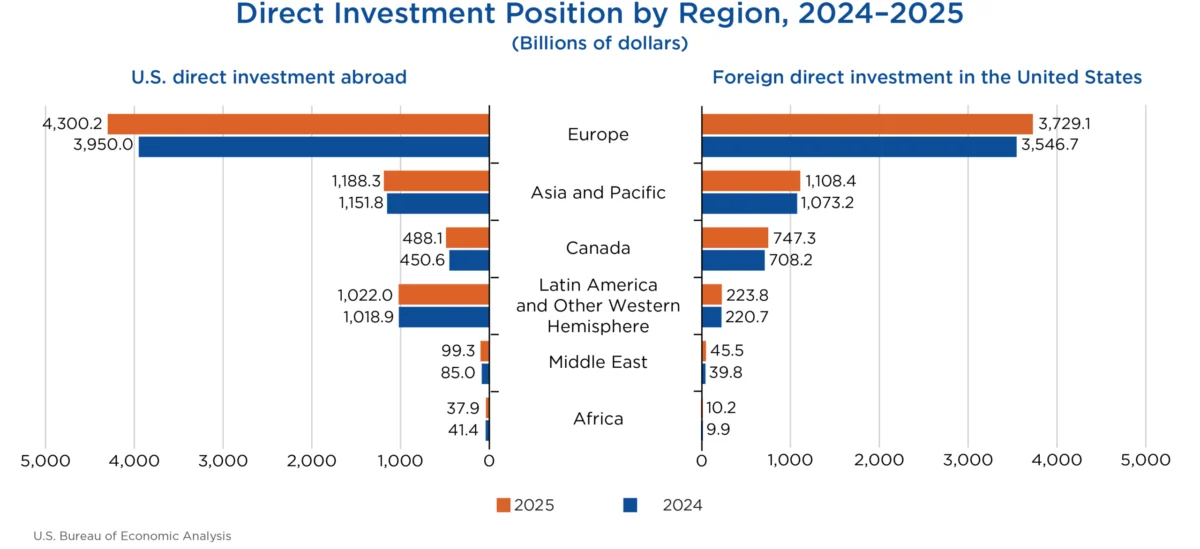
The United States’ direct investment position abroad experienced a substantial increase of $438.1 billion, reaching a cumulative total of $7.14 trillion by the end of 2025. This growth, as detailed in statistics released by the U.S. Bureau of Economic Analysis (BEA), was primarily fueled by a surge in investment within Europe, particularly in the United Kingdom and Luxembourg, which saw an influx of $350.2 billion. Manufacturing, especially chemical manufacturing, was the leading industrial sector for this outward investment.
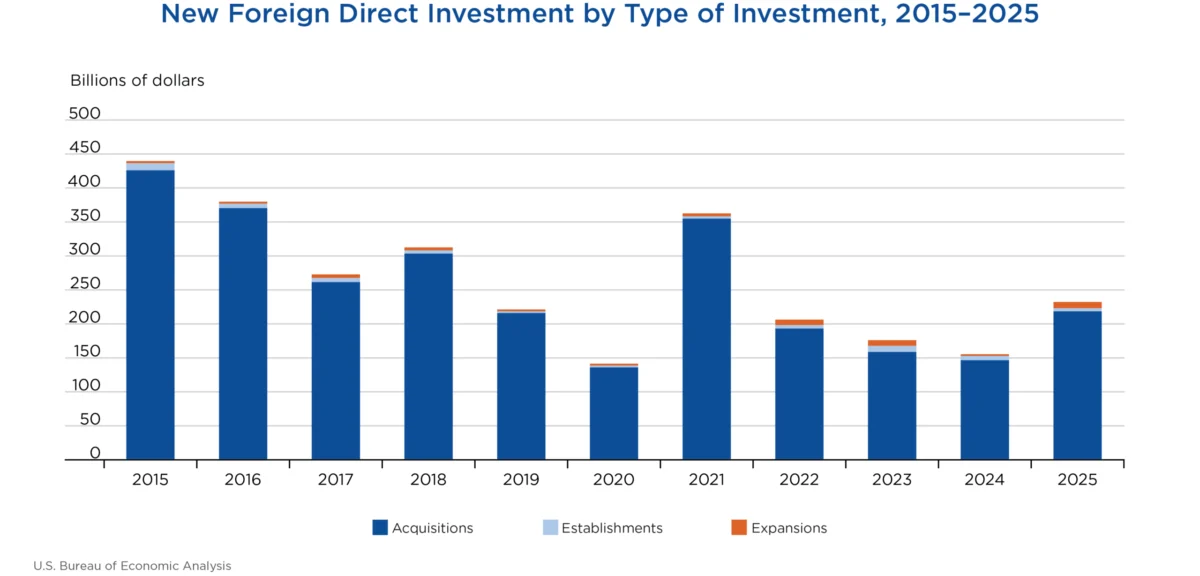
Concurrently, foreign direct investment in the United States also demonstrated robust expansion, growing by $266.0 billion to a total of $5.86 trillion at the close of 2025. Europe again emerged as the dominant source of this inbound investment, contributing an additional $182.4 billion. German multinationals were at the forefront of this trend, increasing their U.S. investment by $49.0 billion, followed by Canadian multinationals with an increase of $39.2 billion. The manufacturing sector in the U.S. was the primary beneficiary of this foreign capital, with electrical equipment and components manufacturing experiencing the most significant growth.
Trends in U.S. Direct Investment Abroad
U.S. multinational enterprises (MNEs) maintain a global investment footprint, with operations in nearly every country. However, a significant portion of this outward investment is concentrated in a few key destinations. In 2025, over half of the total U.S. direct investment abroad was allocated to five countries: the United Kingdom ($1,114.7 billion), the Netherlands ($1,044.0 billion), Luxembourg ($645.3 billion), Ireland ($511.9 billion), and Canada ($488.1 billion). These figures highlight the continued strategic importance of these nations for American businesses seeking international market access and operational advantages.
By industry, holding companies represented the largest share of U.S. direct investment abroad, accounting for 45.8 percent of the total position in 2025. Manufacturing affiliates followed, representing 15.9 percent, and finance and insurance affiliates constituted 13.5 percent of U.S. investment overseas. This distribution underscores the diverse nature of U.S. MNEs’ global activities, spanning financial management, industrial production, and service provision.
Analyzing investment by the industry of the U.S. parent company provides a different perspective. Manufacturing MNEs were the largest contributors to U.S. direct investment abroad, representing 50.2 percent of the total position. MNEs in the finance and insurance sector were the second-largest contributors, accounting for 15.8 percent. This data suggests that while holding companies are significant recipients of foreign direct investment, U.S. industrial and financial giants are the primary drivers of outward investment.
Income Generation from Overseas Investments
The income generated by U.S. MNEs from their cumulative investments abroad reached $660.1 billion in 2025, marking an 11.1 percent increase from the previous year. This robust growth in earnings reflects the profitability of U.S. overseas operations. The most substantial income gains were observed in the holding company sector, which saw an increase of $40.0 billion. Conversely, income from investments in the finance and insurance sectors experienced a slight decline of $6.3 billion compared to 2024, indicating potential shifts in market conditions or investment strategies within this industry.
Dynamics of Foreign Direct Investment in the U.S.
Foreign direct investment in the United States also exhibited significant concentration by country of origin. In 2025, four countries accounted for more than half of the total foreign direct investment in the U.S. Japan led the pack with a substantial investment position of $776.3 billion, followed by the Netherlands ($751.8 billion), Canada ($747.3 billion), and the United Kingdom ($738.3 billion). These figures underscore the enduring appeal of the U.S. market for major global economies.
When examining investment based on the ultimate beneficial owner (UBO) – the entity at the apex of the global ownership structure – Japan remained the top investing country with $827.1 billion. Canada followed closely in second place with $819.8 billion, and Germany secured the third position with $706.2 billion. Notably, the UBO data revealed a significant divergence for investment from the Netherlands and Luxembourg. Their reported investment positions were considerably lower on a UBO basis than when measured by the country of foreign parent. This discrepancy suggests that a substantial portion of capital flowing through these financial hubs originates from investors in other countries, highlighting their role as intermediaries in international investment flows.
By industry, foreign direct investment in the United States was heavily weighted towards the U.S. manufacturing sector, which accounted for 42.8 percent of the total position. This amounted to $2.51 trillion in foreign investment within U.S. manufacturing. Chemical manufacturing alone represented a third of this total, with $835.9 billion invested. The finance and insurance sectors also attracted significant foreign capital, with $629.7 billion invested, followed by wholesale trade with $534.0 billion. This industrial distribution indicates that foreign investors are actively participating in key sectors of the U.S. economy, particularly in production and trade.
Income Generated by Foreign Investors in the U.S.
Foreign MNEs generated $310.1 billion in income from their cumulative investments in the United States during 2025. This figure represents a 1.9 percent decrease compared to the income earned in 2024. This slight contraction in earnings for foreign investors could be attributed to various factors, including shifts in market demand, increased operational costs, or evolving economic conditions within specific sectors of the U.S. economy.
Revisions to Previously Published Statistics
The Bureau of Economic Analysis also released revised data for direct investment statistics from 2022 through 2024. These revisions are a standard part of the BEA’s statistical process, incorporating newly available and updated source data to ensure the accuracy and reliability of economic reporting. For instance, foreign direct investment in the United States for 2022 was revised to $5,110 billion from a previously published $5,124 billion. Similarly, U.S. direct investment abroad for 2024 was revised from $6,827 billion to $6,698 billion, and foreign direct investment in the U.S. for the same year was adjusted from $5,708 billion to $5,598 billion. These adjustments reflect the dynamic nature of economic data collection and reporting.
Context and Broader Implications
The robust growth in both U.S. direct investment abroad and foreign direct investment in the United States underscores the interconnectedness of the global economy and the continued strategic importance of international capital flows. For the United States, the increase in foreign direct investment signifies foreign confidence in the stability and growth potential of the U.S. economy, contributing to job creation, technological advancement, and overall economic dynamism. The concentration of investment in manufacturing, particularly in sectors like chemicals and electrical equipment, suggests a focus on strengthening domestic production capabilities and supply chains.
Conversely, the expansion of U.S. direct investment abroad reflects the global ambitions of American corporations. Their strategic investments in key markets like the United Kingdom and the Netherlands are aimed at expanding market reach, optimizing operational efficiencies, and tapping into new growth opportunities. The significant role of holding companies in this outward investment pattern highlights the complex financial structures employed by multinational corporations to manage their global assets and liabilities.
The income generated from these cross-border investments is a crucial component of the U.S. balance of payments. The increase in income from U.S. investments abroad suggests a positive contribution to the nation’s net international investment position, while the slight decrease in income earned by foreign investors in the U.S. may indicate a period of recalibration or normalization of returns within certain U.S. industries.
The detailed breakdowns by country and industry, as provided by the BEA, offer valuable insights for policymakers, businesses, and researchers. They allow for a nuanced understanding of investment patterns, identifying areas of strength and potential vulnerability in both inbound and outbound investment flows. This data is critical for formulating economic policy, guiding corporate investment strategies, and fostering international economic cooperation.
The BEA’s commitment to refining its data through revisions and the implementation of enhanced disclosure avoidance methods, such as coarsening, demonstrates an effort to provide more comprehensive and accessible statistical information while safeguarding respondent confidentiality. This approach is vital for maintaining public trust and enabling informed decision-making in an increasingly complex global economic landscape.
As the global economy continues to evolve, monitoring these direct investment flows will remain paramount. Future trends will likely be shaped by geopolitical developments, technological innovations, and shifting trade policies. The data released for 2025 provides a snapshot of a dynamic period, with significant capital movements reinforcing the United States’ central role in the global financial system. The next release, scheduled for July 2027, will offer further insights into Direct Investment by Country and Industry for 2026, providing an updated view of these critical economic indicators.