

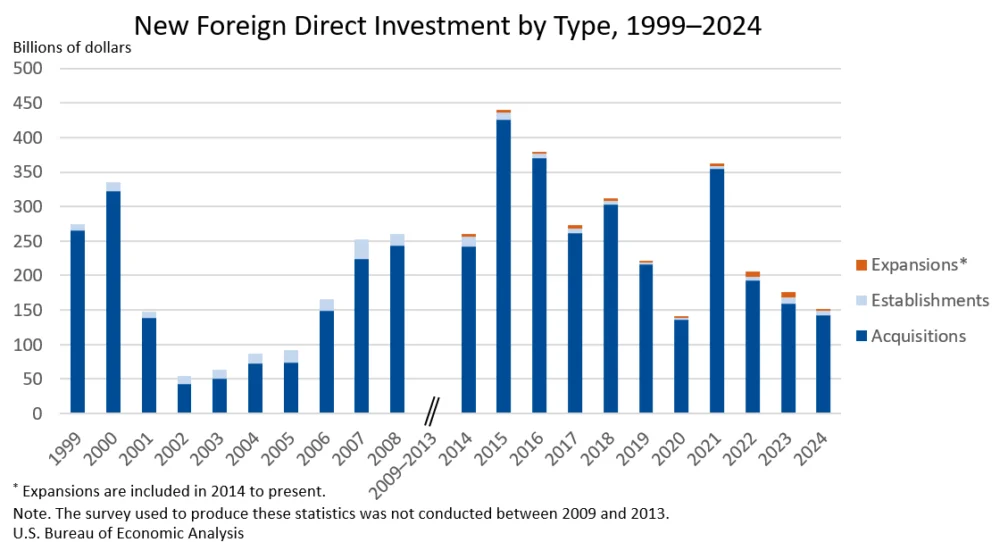
Expenditures by foreign direct investors to acquire, establish, or expand U.S. businesses totaled $151.0 billion in 2024, according to preliminary statistics released by the U.S. Bureau of Economic Analysis (BEA). This figure represents a significant decrease of $24.9 billion, or 14.2 percent, from the revised $176.0 billion recorded in 2023. The 2024 total also falls considerably below the annual average of $277.2 billion observed between 2014 and 2023, underscoring a notable shift in foreign investment trends. As has been the pattern in previous years, the acquisition of existing U.S. businesses constituted the predominant form of foreign direct investment (FDI) activity.
The BEA’s latest report reveals that within the $151.0 billion expenditure in 2024, acquisitions of existing U.S. businesses accounted for the largest share, totaling $143.0 billion. Establishing new U.S. businesses attracted $6.3 billion in foreign investment, while the expansion of existing foreign-owned businesses accounted for $1.8 billion. Beyond these first-year expenditures, planned total expenditures, which encompass both immediate and projected future outlays, were estimated at $157.0 billion. This suggests a continued, albeit moderated, pipeline of anticipated foreign investment into the U.S. economy.
The impact of this investment on the U.S. labor market was also quantified. In 2024, newly acquired, established, or expanded foreign-owned businesses in the United States were projected to employ 204,200 individuals. This figure provides a snapshot of the direct job creation and retention associated with FDI.
Key Trends and Sectoral Focus
The decline in overall FDI expenditures in 2024 was largely driven by a reduction in the acquisition of U.S. businesses. While the BEA does not provide specific reasons for this shift, broader economic factors such as global economic uncertainty, interest rate policies, and geopolitical developments could have influenced foreign investor decisions. The sustained reliance on acquisitions as the primary mode of FDI highlights the appeal of established U.S. companies as investment targets, potentially due to their market presence, intellectual property, or existing infrastructure.
Manufacturing Sector Dominates Investment:
Breaking down the investment by industry, the manufacturing sector emerged as the primary recipient of new foreign direct investment in 2024, attracting $67.7 billion. This substantial figure represents 44.9 percent of the total FDI expenditures. Within the manufacturing umbrella, chemical manufacturing saw the most significant inflows, with $23.7 billion invested. This focus on manufacturing suggests a continued international confidence in the U.S. industrial base and its capacity for production and innovation.
Beyond manufacturing, other sectors also drew considerable foreign capital. The finance and insurance sector attracted $23.2 billion, indicating ongoing foreign interest in the U.S. financial services landscape. The utilities sector received $16.0 billion, pointing to foreign investment in critical infrastructure and energy services.
Geographical Origins of Investment
The report also sheds light on the geographical origins of this foreign investment. Ireland emerged as the leading country of investment, with expenditures totaling $30.1 billion. Canada followed closely with $23.9 billion in investments. On a continental scale, Europe was the most significant source of new FDI, contributing a substantial $96.7 billion, which accounts for 64.0 percent of all new foreign investment in 2024. The Asia and Pacific region represented the second-largest investing bloc, with expenditures amounting to $23.2 billion.
State-Level Distribution of Investment
At the state level, Texas secured the largest share of foreign direct investment in 2024, with $22.8 billion in expenditures. This reflects the state’s robust economy and its attractiveness to foreign investors. Georgia followed with significant investment inflows of $16.3 billion, and California also garnered substantial investment, totaling $12.9 billion. These figures highlight the diverse geographical appeal of the U.S. market to foreign investors, with both established economic powerhouses and rapidly growing regions attracting capital.
Greenfield Investments: Building for the Future
While acquisitions dominated the overall FDI landscape, the BEA also tracks "greenfield" investments, which involve establishing new businesses or expanding existing foreign-owned ones. In 2024, greenfield expenditures amounted to $8.1 billion. This category represents a forward-looking investment strategy, focused on creating new operational capacity within the U.S.
Sectoral Breakdown of Greenfield Investments:
Within greenfield investments, the professional, scientific, and technical services sector led the way, attracting $2.8 billion. This was notably driven by investments in management, scientific, and technical consulting services, which accounted for $1.6 billion of this total. This trend suggests a foreign appetite for investing in the U.S. knowledge economy and its specialized service industries.
Regional and State Contributions to Greenfield Investment:
From a regional perspective, Europe again played a significant role in greenfield investments, contributing $3.8 billion. Latin America and the Other Western Hemisphere region followed with $1.4 billion, and the Asia and Pacific region accounted for $1.2 billion. At the state level, Wyoming recorded the highest greenfield investment at $2.0 billion, followed by New Mexico with $1.4 billion. These figures indicate that while major economic hubs attract significant FDI, opportunities for new business creation also exist in other regions.
Planned total expenditures for greenfield investment initiated in 2024, including future outlays, were projected at $14.1 billion, indicating continued interest in building new ventures in the U.S.
Employment Implications of FDI
The employment figures associated with FDI provide a crucial measure of its impact on the U.S. workforce. In 2024, current employment at newly acquired enterprises stood at 203,600. When factoring in planned employment for newly established businesses and expansions, the total projected employment reached 213,200. This indicates that FDI continues to be a significant driver of job creation and preservation in the United States.
Employment by Industry and Country:
The manufacturing sector not only attracted the most investment but also accounted for the largest number of current employees, with 73,600 individuals employed in foreign-owned manufacturing firms. By country of origin, Ireland and Canada were significant contributors to employment, with 43,100 and 37,500 employees, respectively. This underscores the substantial presence of businesses from these nations within the U.S. economy.
State-Level Employment Impact:
Florida led the states in terms of current employment resulting from new foreign investment, with 32,700 employees. Texas followed with 18,200 employees, and New York with 14,200 employees. This data illustrates how FDI contributes to job markets across different regions of the United States.
Revisions to 2023 Data Highlight Volatility
The BEA’s release also included significant revisions to the 2023 FDI expenditure data. First-year expenditures for 2023 were revised upward from a previously published $148.8 billion to $176.0 billion, an increase of $27.2 billion. Planned total expenditures for 2023 were also revised upward substantially, from $175.9 billion to $218.8 billion. These revisions, particularly the upward adjustments in acquisitions, establishments, and expansions, suggest that the initial estimates for 2023 may have understated the actual level of foreign investment activity. The revised figures for 2023, coupled with the notable decline in 2024, paint a picture of a dynamic and potentially volatile FDI landscape.
These revisions highlight the preliminary nature of FDI statistics and the challenges in accurately capturing the full scope of investment in real-time. The BEA’s methodology for collecting and revising these figures aims to provide the most accurate picture possible, but fluctuations can occur as more comprehensive data becomes available.
Analysis and Implications
The decline in foreign direct investment in 2024, particularly in acquisition-driven activity, warrants careful observation. While the U.S. remains a highly attractive destination for global capital, a decrease in investment can have several implications:
- Economic Growth: Reduced FDI can potentially slow down economic growth by limiting capital infusion, job creation, and technology transfer.
- Competitiveness: A dip in foreign investment might signal a perception of diminished competitiveness or increased risk associated with investing in the U.S. market compared to other global destinations.
- Sectoral Impact: The concentration of investment in specific sectors like manufacturing and finance suggests that these areas are viewed as robust and resilient by foreign investors, even amidst a broader downturn.
- Geopolitical and Economic Factors: The decrease may reflect a global trend of cautious investment due to rising interest rates, inflation, and geopolitical tensions. Foreign investors might be re-evaluating their global portfolios and seeking more stable or higher-return opportunities elsewhere.
- Policy Considerations: Policymakers will likely monitor these trends closely. A sustained decline in FDI could prompt discussions about measures to enhance the attractiveness of the U.S. for foreign investors, such as streamlining regulatory processes, offering targeted incentives, or addressing economic headwinds.
The BEA’s detailed data tables, available through its Interactive Data Application and Supplemental Data Tables, provide granular insights into specific industries, countries, and states. This comprehensive data allows for deeper analysis of the factors driving these investment trends and their localized impacts. As the BEA continues to refine its data, future releases will offer a clearer understanding of the long-term trajectory of foreign direct investment in the United States. The current figures serve as an important indicator of the evolving global economic landscape and the United States’ position within it.


