

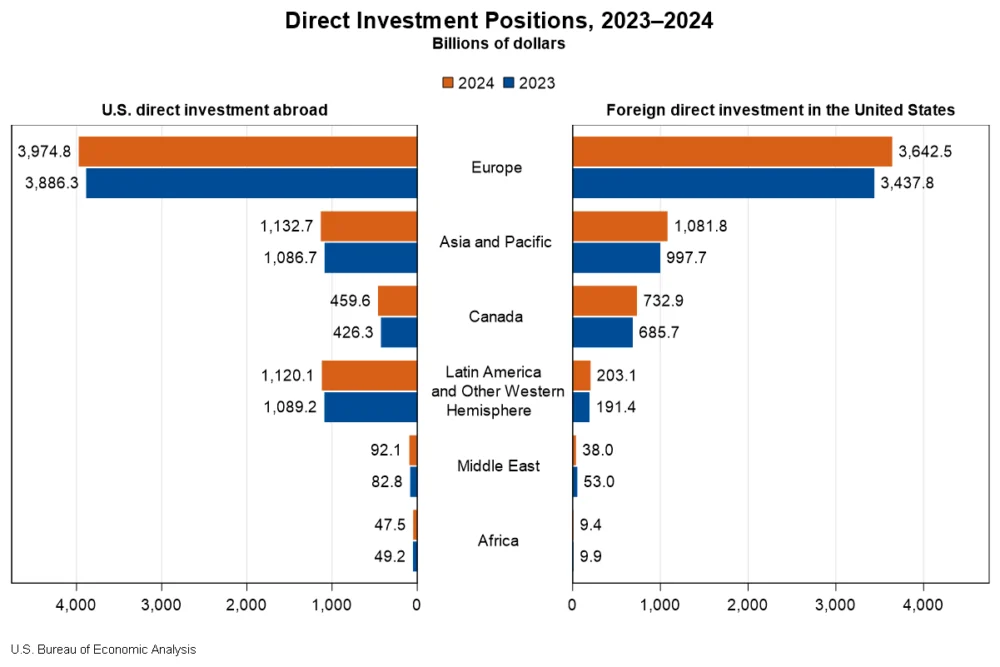
The cumulative level of U.S. direct investment abroad, a key indicator of American economic engagement with the global marketplace, saw a substantial increase of $206.3 billion, reaching a total of $6.83 trillion by the close of 2024. This growth trajectory, as detailed in newly released statistics from the U.S. Bureau of Economic Analysis (BEA), underscores a dynamic and expanding U.S. corporate footprint overseas. The surge was particularly pronounced in Europe, which contributed an additional $88.4 billion to the U.S. direct investment abroad position. Within Europe, Luxembourg and Germany emerged as primary destinations for this outward investment. On an industry basis, manufacturing affiliates reported the most significant gains, with the production of computers and electronic products spearheading this upward trend.
Concurrently, foreign direct investment (FDI) within the United States also demonstrated robust expansion, increasing by $332.1 billion to a total of $5.71 trillion at the end of 2024. This inflow of foreign capital into the U.S. economy was also heavily influenced by European investment, which accounted for an additional $204.7 billion. Notable contributions within Europe included a $52.9 billion increase from the United Kingdom and a $39.7 billion rise from Germany. Similar to U.S. outbound investment, manufacturing affiliates within the United States experienced the most significant growth in foreign investment.
Understanding Direct Investment: A Snapshot of Global Economic Ties
Direct investment, in essence, represents the establishment of a lasting interest and control of an enterprise resident in one economy by an entity resident in another economy. This typically involves the acquisition of 10 percent or more of the voting securities of an enterprise, or an equivalent ownership interest in an unincorporated enterprise. The BEA’s data provides a critical snapshot of these intricate economic interdependencies, reflecting not only capital flows but also the strategic decisions of multinational enterprises (MNEs) to expand their operations, market reach, and production capabilities across national borders.
The annual release of these statistics serves as a barometer for the health and direction of international economic integration, offering insights into global trade patterns, employment trends, and technological diffusion. The significant increases observed in 2024 signal a period of heightened cross-border corporate activity, potentially driven by a confluence of factors including global economic recovery, favorable investment climates in key regions, and strategic realignments by businesses seeking to optimize their global operations.
U.S. Direct Investment Abroad: European Hubs and Manufacturing Powerhouses
The expansion of U.S. direct investment abroad in 2024 was characterized by a significant concentration of capital in specific regions and industries. While U.S. multinational enterprises (MNEs) maintain a widespread global presence, a substantial portion of their investment abroad is channeled through a select group of countries. At the close of 2024, the top five destinations for U.S. direct investment abroad collectively accounted for over half of the total position. The United Kingdom led this group with a substantial $1,024.6 billion, followed closely by the Netherlands at $1,012.0 billion, and Luxembourg with $569.6 billion. Singapore ($467.6 billion) and Ireland ($466.8 billion) rounded out the top five, highlighting the strategic importance of these nations as conduits for U.S. global enterprise.
Industry-wise, holding companies emerged as the dominant sector for U.S. direct investment abroad, representing 47.3 percent of the total position in 2024. These entities often serve as central hubs for managing a company’s various international subsidiaries and assets. Manufacturing affiliates secured the second-largest share at 16.0 percent, underscoring the continued global reach of U.S. manufacturing operations. Finance and insurance affiliates followed, accounting for 14.2 percent of the outbound investment. When examining the investment by the U.S. parent company’s industry, manufacturing MNEs were the most significant investors abroad, contributing 50.9 percent of the total position. MNEs in the finance and insurance sectors were the next largest investors, at 15.1 percent.
The income generated from these overseas investments is a crucial component of the U.S. economy. In 2024, U.S. MNEs earned a considerable $601.9 billion on their cumulative investments abroad, marking a healthy 3.8 percent increase from the previous year. The finance and insurance sector experienced the most substantial income growth, with an increase of $12.0 billion, representing a significant 17.6 percent rise from 2023. This income directly contributes to the U.S. gross national product and influences corporate profitability and shareholder returns.
Foreign Direct Investment in the United States: European Influence and Manufacturing Dominance
The flow of foreign capital into the U.S. economy in 2024 mirrored some of the trends seen in outbound investment, with Europe playing a pivotal role. By country of the foreign parent, four nations were responsible for over half of the total FDI position in the United States by the end of the year. Japan stood as the leading investor, with a position of $754.1 billion, followed by the United Kingdom ($742.7 billion), Canada ($732.9 billion), and the Netherlands ($726.4 billion).
An analysis based on the ultimate beneficial owner (UBO)—the entity at the apex of the global ownership chain—provided further nuanced insights. On this basis, Japan remained the top investing country with $819.2 billion, followed by Canada ($811.7 billion) and Germany ($677.3 billion). The data also revealed that investment from the Netherlands and Luxembourg, when viewed through the UBO lens, was significantly lower than when measured by the country of the foreign parent. This suggests that a considerable portion of investment originating from these European nations is ultimately owned by investors based in other countries, highlighting complex international ownership structures.
The manufacturing sector within the United States was a primary beneficiary of foreign direct investment, attracting 42.3 percent of the total FDI position. This amounted to an impressive $2.42 trillion invested in U.S. manufacturing by foreign MNEs. Within manufacturing, chemical manufacturing stood out, accounting for a substantial one-third of this total, or $827.5 billion. Significant investments were also recorded in the U.S. finance and insurance sectors ($599.4 billion) and wholesale trade ($520.5 billion).
Foreign MNEs also saw considerable returns on their U.S. investments. In 2024, they earned $310.9 billion on their cumulative investments in the United States, a notable 13.1 percent increase compared to 2023. This inflow of income benefits foreign economies and reflects the continued attractiveness of the U.S. market for global businesses.
Historical Context and Revisions to Data
The BEA’s release also included revisions to previously published statistics for 2022 and 2023. These adjustments, a standard part of economic data collection, incorporate newly available and revised source data, ensuring the most accurate representation of economic activity. For instance, the U.S. direct investment abroad position for 2022 was revised from $6,313 billion to $6,245 billion, and for 2023, from $6,676 billion to $6,620 billion. Similarly, foreign direct investment in the United States for 2022 was revised from $5,167 billion to $5,124 billion, and for 2023, from $5,394 billion to $5,376 billion. These revisions are crucial for maintaining the integrity and comparability of economic time series.
Implications for the U.S. and Global Economy
The robust growth in both U.S. direct investment abroad and foreign direct investment in the United States in 2024 carries several implications. For the U.S. economy, the expansion of outbound investment signifies continued global competitiveness and the ability of American companies to capitalize on international growth opportunities. This can lead to increased exports, technological diffusion, and diversification of revenue streams. The significant inbound FDI highlights the enduring appeal of the U.S. market, characterized by its large consumer base, skilled workforce, and stable regulatory environment. This influx of foreign capital can stimulate job creation, spur innovation, and enhance productivity within the United States.
The strong performance of the manufacturing sector in both inbound and outbound investment trends suggests a resilient and globally integrated industrial landscape. The focus on areas like computer and electronic products, and chemicals, indicates ongoing strategic investments in sectors critical to modern economies. The role of holding companies in outbound investment further points to sophisticated global corporate structures designed for efficiency and strategic management.
From a broader economic perspective, these trends reflect a global economy that, despite geopolitical uncertainties and economic headwinds, continues to foster significant cross-border investment. The reliance on Europe as a key source and destination for direct investment underscores the persistent strength of transatlantic economic ties. However, the analysis of UBO data also hints at the increasing complexity of global capital flows, with investments often originating from entities with diverse international ownership.
The BEA’s commitment to providing detailed data tables, accessible through its Interactive Data Application, empowers economists, policymakers, and businesses to conduct in-depth analyses. This granular data allows for a deeper understanding of specific country and industry dynamics, enabling more informed strategic decisions and policy formulations. The discontinuation of certain detailed tables, while noted, is balanced by the continued availability of extensive data archives, ensuring historical continuity for researchers.
As the global economic landscape continues to evolve, the patterns of direct investment will remain a critical indicator of international economic cooperation, competitive positioning, and the long-term growth prospects of nations worldwide. The data released for 2024 provides a compelling narrative of robust engagement, with U.S. and foreign enterprises actively shaping the global economic architecture. The next release, anticipated in July 2026, will offer further insights into these evolving trends with the introduction of 2025 data.


