
 Candice Horbacz
Higher tax rates consistently incentivize tax avoidance, a fundamental principle observed across various markets. As taxes on specific goods escalate, both consumers and suppliers actively seek methods to circumvent these additional costs. In the context of cigarette markets, this phenomenon manifests in consumers engaging in cross-border shopping to states with lower tax rates, while illicit networks develop sophisticated black and gray markets to illegally sell products, often paying minimal or no tax whatsoever. The increasing disparity in cigarette tax levels across U.S. states, combined with substantial tax hikes, has transformed cigarette smuggling into both a pervasive national issue and a highly profitable criminal enterprise.
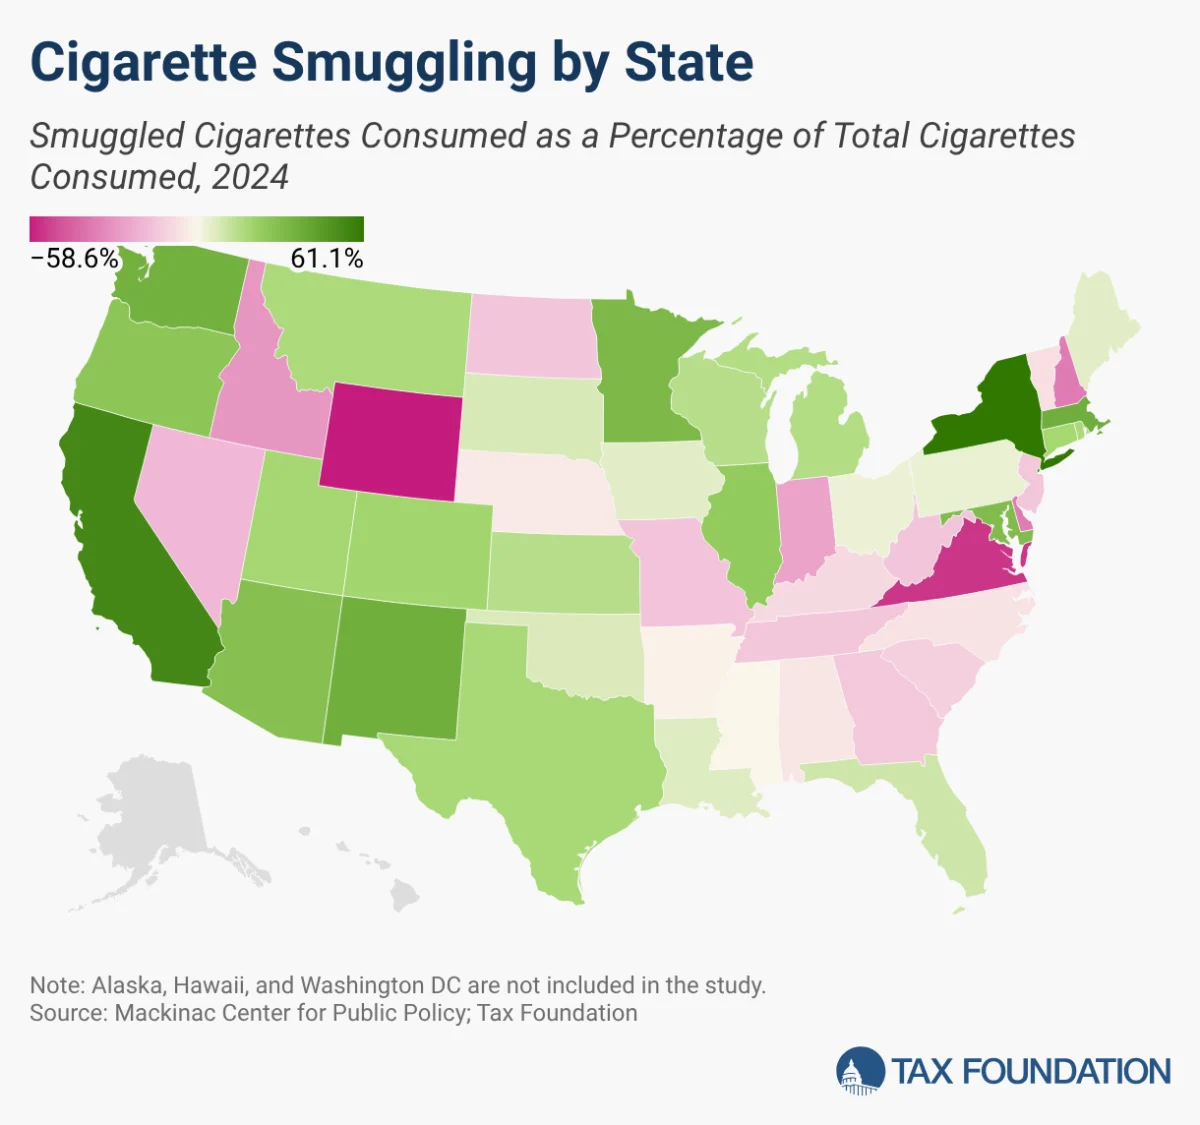
Each year, in a collaborative effort between the Tax Foundation and scholars at the Mackinac Center for Public Policy, estimates are produced for cigarette smuggling rates across the continental United States. The most recent comprehensive report, utilizing data from 2024, reaffirms a robust positive correlation between elevated cigarette tax rates and heightened smuggling activity nationwide. This consistent finding underscores the predictable economic response to aggressive taxation policies on a consumer good with relatively inelastic demand but significant price sensitivity across jurisdictions.
New York Reclaims Top Spot in Illicit Cigarette Trade
For 2024, New York has once again claimed the unenviable distinction of leading the nation in cigarette smuggling, a position it briefly ceded to California last year. A staggering 61.1 percent of all cigarettes consumed within New York are estimated to have been acquired through illicit channels, bypassing legal state purchases. This figure represents a significant challenge to the state’s public health objectives and its revenue collection efforts. California closely followed New York, with an estimated smuggling rate of 54.4 percent, indicating that over half of the cigarettes smoked in the Golden State are not purchased legally within its borders.
The financial ramifications of this illicit trade are substantial. New York alone is estimated to have forgone over $1.2 billion in potential excise tax revenue in 2024 due to smuggled cigarettes. California’s losses were even higher, nearing $1.4 billion, reflecting its higher state tax rate of $2.87 per pack compared to New York’s $5.35 per pack, applied to a larger overall consumption base. These figures highlight the immense fiscal strain placed on states that impose high excise taxes without adequately accounting for the corresponding rise in illicit market activity.
Outbound Smuggling: A Boon for Border States
Conversely, several states experience net outbound smuggling, where cigarettes are purchased legally within their borders but then transported and consumed elsewhere, typically in neighboring states with higher taxes. Wyoming and Virginia emerged as the top beneficiaries of this cross-border trade in 2024, reporting net outbound smuggling rates of 58.6 percent and 54.4 percent, respectively. These states, characterized by comparatively lower cigarette tax rates ($0.60 per pack in both Wyoming and Virginia), are strategically positioned to attract price-sensitive consumers from high-tax jurisdictions.
Wyoming’s favorable tax environment draws in consumers from states like Colorado, where the cigarette tax is $1.94 per pack, and other Western states. Similarly, Virginia benefits significantly from its proximity to the District of Columbia and states like Maryland, which boast much higher tax rates ($3.75 per pack in Maryland, and historically high rates in DC, though not included in this study’s continental scope). This phenomenon, while benefiting the exporting states’ revenue streams, exacerbates the smuggling problem for their higher-taxed neighbors, creating a complex inter-state economic dynamic. Virginia, for instance, was the largest net beneficiary of smuggling-related cigarette tax revenue, netting over $61 million in 2024, while Indiana followed with nearly $57 million.
The Economic Drivers of Illicit Trade: A Historical Context
The relationship between high excise taxes and illicit trade is not a novel concept. Throughout history, governments have grappled with the unintended consequences of "sin taxes" on products like alcohol and tobacco. The economic theory underpinning this phenomenon is straightforward: when the price differential for a product across two adjacent jurisdictions becomes sufficiently large, the incentive for arbitrage—buying in the cheaper market and selling in the more expensive one—grows proportionally. This incentive fuels both casual cross-border shopping by individual consumers and organized, large-scale smuggling operations.
In the United States, federal excise taxes on cigarettes have existed for over a century, but state-level taxes began to rise significantly in the latter half of the 20th century, accelerating into the 21st century as states sought new revenue streams and public health advocates pushed for higher taxes to deter smoking. As of 2024, state excise taxes range dramatically, from a mere $0.17 per pack in Missouri to $5.35 per pack in New York, creating immense price disparities that smugglers readily exploit. This long-standing trend of increasing tax differentials has consistently correlated with rising smuggling rates, as evidenced by years of research from the Tax Foundation and Mackinac Center. The 2024 findings merely reinforce this established pattern, with states like New York experiencing surges in smuggling parallel to their tax increases.
Beyond Taxes: The Role of Regulatory Bans
While high taxes are a primary driver, the report highlights that excessive regulations, particularly product bans, also significantly contribute to illicit market growth. States that have implemented menthol bans, such as California and Massachusetts, tend to exhibit particularly high rates of smuggling. The rationale is similar to tax avoidance: when a popular product is prohibited in one jurisdiction, consumers will seek it out in legal markets elsewhere or turn to illicit sources within their own state.
Massachusetts’s flavor ban, enacted in 2020, has demonstrably impacted the state’s tobacco revenue and fueled smuggling. Similarly, California’s flavor ban, implemented more recently, continues to cost the state hundreds of millions of dollars annually, as previously predicted by economic analyses. Despite these bans, overall smoking behavior in these states has largely remained unchanged, indicating that consumers are simply shifting their purchases to illicit channels rather than quitting. This void in legal sales is readily filled by illicit products, often of unknown origin and quality, posing additional public health risks.
This phenomenon echoes the era of alcohol prohibition in the 1920s, which demonstrated that consumers, faced with prohibitions, will often find ways to acquire desired products. Flavor bans, nicotine bans, or effective bans resulting from regulatory inaction burden legal businesses, deprive states of tax revenue, and impose higher enforcement costs, all while potentially exposing consumers to more dangerous, unregulated products.
The Dark Side of Illicit Trade: Public Safety and Health Risks
The consequences of widespread cigarette smuggling extend far beyond lost tax revenue. The proliferation of illicit markets for untaxed and unregulated products grants them a significant competitive advantage over legal businesses, which must comply with all tax obligations and regulatory standards. This creates an unfair playing field, undermining legitimate domestic enterprises.
Moreover, illicit markets introduce profound dangers for consumers. Smuggled cigarettes often include counterfeit products, which are typically manufactured with little to no oversight. Estimates suggest that some 400 billion counterfeit cigarettes are produced annually, with a significant portion originating from China. These counterfeit products frequently contain toxic heavy metals, contaminants, and higher levels of harmful chemicals than legally manufactured cigarettes, posing heightened public health risks.
The financial scale of cigarette smuggling is enormous, generating billions of dollars globally. This vast flow of illicit funds has been linked to sophisticated organized criminal enterprises, and disturbing reports have connected some of these funds to the financing of terrorist organizations. This underscores the serious national security implications of an unchecked illicit tobacco trade.
Enforcement Challenges and the Vaping Market Parallel
State enforcement agencies face immense burdens in attempting to combat these large-scale smuggling operations, often with limited success. While anti-smuggling task forces in various states conduct raids and seize hundreds of thousands of dollars’ worth of contraband cigarettes, these seizures often represent a minuscule fraction of the overall illicit market. For instance, a recent multi-agency investigation in New York led to a significant seizure of approximately 43,700 packs of untaxed cigarettes. Impressive as this bust was, it represented a mere 0.019 percent of the estimated annual smuggling activity in the state, illustrating the sheer scale of the challenge.
The lessons learned from cigarette taxation and prohibition are proving increasingly relevant to the burgeoning vaping market. Illicit markets for tax avoidance and smuggling are becoming a prominent issue in the vaping sector as well, driven by rapidly evolving regulations and varying tax rates across jurisdictions. Unfortunately, many states appear to be repeating the same pitfalls, implementing policies that inadvertently harm legal businesses, limit consumer choice, and undermine potential revenue generation from a regulated market.
Looking Ahead: Policy Considerations
The 2024 data unequivocally demonstrates the strong correlation between high cigarette taxes, restrictive product bans, and the growth of illicit markets. Policymakers are thus confronted with a critical dilemma: how to balance public health objectives and revenue generation with the predictable economic consequences of taxation and regulation.
To mitigate the negative impacts of illicit trade, policymakers should carefully consider the unintended, yet foreseeable, consequences of their decisions when determining tax rates and regulatory regimes for tobacco and nicotine products. Strategies could include:
- Harmonizing Tax Rates: Reducing extreme tax differentials between neighboring states could diminish the incentive for cross-border smuggling.
- Targeted Enforcement: While challenging, investing in more sophisticated enforcement mechanisms and inter-state cooperation could help disrupt organized smuggling networks.
- Rethinking Bans: Evaluating the effectiveness of product bans in achieving public health goals versus their role in fueling illicit markets is crucial. Alternative regulatory approaches that do not inadvertently empower criminal enterprises might be more effective.
- Comprehensive Approach to Nicotine Products: Applying lessons from cigarette smuggling to the vaping market, focusing on creating stable, regulated markets rather than driving consumers to illicit sources.
Ultimately, a nuanced and evidence-based approach to tobacco and nicotine policy is essential to protect state revenues, support legitimate businesses, ensure consumer safety, and uphold the rule of law. Ignoring the dynamics of the illicit market risks undermining public policy goals and empowering criminal elements.
State-by-State Smuggling Rates and Foregone Revenue, 2024
| State | State Tax (cents) | Smuggling Rate | Rank (Rate) | Smuggled Packs | Foregone Revenue |
|---|---|---|---|---|---|
| Alabama | 67.5 | -3.62% | 31 | (6,634,835) | (4,478,513) |
| Arizona | 200.0 | 29.60% | 8 | 53,825,279 | 107,650,558 |
| Arkansas | 115.0 | 0.13% | 29 | 140,889 | 162,023 |
| California | 287.0 | 54.38% | 2 | 474,932,197 | 1,363,055,406 |
| Colorado | 194.0 | 20.33% | 11 | 27,886,708 | 54,100,214 |
| Connecticut | 435.0 | 19.70% | 12 | 13,863,201 | 60,304,923 |
| Delaware | 210.0 | -35.66% | 45 | (10,750,073) | (22,575,153) |
| Florida | 133.9 | 11.40% | 20 | 77,618,766 | 103,931,527 |
| Georgia | 37.0 | -12.61% | 36 | (40,327,404) | (14,921,140) |
| Idaho | 57.0 | -27.90% | 44 | (10,361,451) | (5,906,027) |
| Illinois | 298.0 | 25.20% | 10 | 74,085,676 | 220,775,315 |
| Indiana | 99.5 | -24.33% | 43 | (57,193,142) | (56,907,177) |
| Iowa | 136.0 | 6.66% | 24 | 6,910,694 | 9,398,544 |
| Kansas | 129.0 | 16.27% | 18 | 14,204,544 | 18,323,861 |
| Kentucky | 110.0 | -7.82% | 34 | (18,151,584) | (19,966,742) |
| Louisiana | 108.0 | 7.62% | 23 | 14,203,042 | 15,339,285 |
| Maine | 200.0 | 6.57% | 25 | 3,534,415 | 7,068,830 |
| Maryland | 375.0 | 31.69% | 7 | 42,912,954 | 160,923,576 |
| Massachusetts | 351.0 | 37.86% | 3 | 54,293,836 | 190,571,364 |
| Michigan | 200.0 | 16.95% | 17 | 57,937,955 | 115,875,909 |
| Minnesota | 377.9 | 33.34% | 6 | 51,705,370 | 195,394,592 |
| Mississippi | 68.0 | 0.83% | 28 | 1,036,410 | 704,759 |
| Missouri | 17.0 | -14.13% | 41 | (43,762,518) | (7,439,628) |
| Montana | 170.0 | 18.28% | 16 | 6,554,132 | 11,142,025 |
| Nebraska | 64.0 | -2.74% | 30 | (2,220,326) | (1,421,009) |
| Nevada | 180.0 | -17.81% | 42 | (10,988,671) | (19,779,608) |
| New Hampshire | 178.0 | -35.89% | 46 | (23,108,713) | (41,133,509) |
| New Jersey | 270.0 | -13.26% | 37 | (18,120,099) | (48,924,268) |
| New Mexico | 200.0 | 37.61% | 4 | 20,376,690 | 40,753,381 |
| New York | 535.0 | 61.09% | 1 | 230,673,158 | 1,234,101,398 |
| North Carolina | 45.0 | -4.76% | 32 | (19,994,035) | (8,997,316) |
| North Dakota | 44.0 | -13.56% | 40 | (3,939,831) | (1,733,526) |
| Ohio | 160.0 | 4.30% | 27 | 18,245,440 | 29,192,704 |
| Oklahoma | 203.0 | 8.52% | 22 | 13,694,087 | 27,798,996 |
| Oregon | 333.0 | 27.74% | 9 | 34,158,475 | 113,747,723 |
| Pennsylvania | 260.0 | 4.91% | 26 | 17,739,657 | 46,123,108 |
| Rhode Island | 425.0 | 18.58% | 15 | 5,954,893 | 25,308,297 |
| South Carolina | 57.0 | -10.70% | 35 | (18,780,062) | (10,704,635) |
| South Dakota | 153.0 | 8.88% | 21 | 2,484,982 | 3,802,023 |
| Tennessee | 62.0 | -13.43% | 38 | (33,084,730) | (20,512,532) |
| Texas | 141.0 | 19.10% | 14 | 150,011,260 | 211,515,876 |
| Utah | 170.0 | 19.62% | 13 | 9,444,321 | 16,055,346 |
| Vermont | 308.0 | -5.91% | 33 | (876,569) | (2,699,834) |
| Virginia | 60.0 | -54.38% | 47 | (102,257,592) | (61,354,555) |
| Washington | 302.5 | 36.74% | 5 | 46,458,682 | 140,537,512 |
| West Virginia | 120.0 | -13.47% | 39 | (12,914,563) | (15,497,475) |
| Wisconsin | 252.0 | 16.04% | 19 | 30,874,512 | 77,803,770 |
| Wyoming | 60.0 | -58.57% | 48 | (7,091,686) | (4,255,012) |
Source: Mackinac Center for Public Policy; Tax Foundation. Note: Estimates based on differences in legal sales and reported smoking rates. Alaska, Hawaii, and Washington DC are not included in the study. Negative numbers indicate net inbound smuggling and net positive tax revenues from smuggling.