

 Lana Rhoades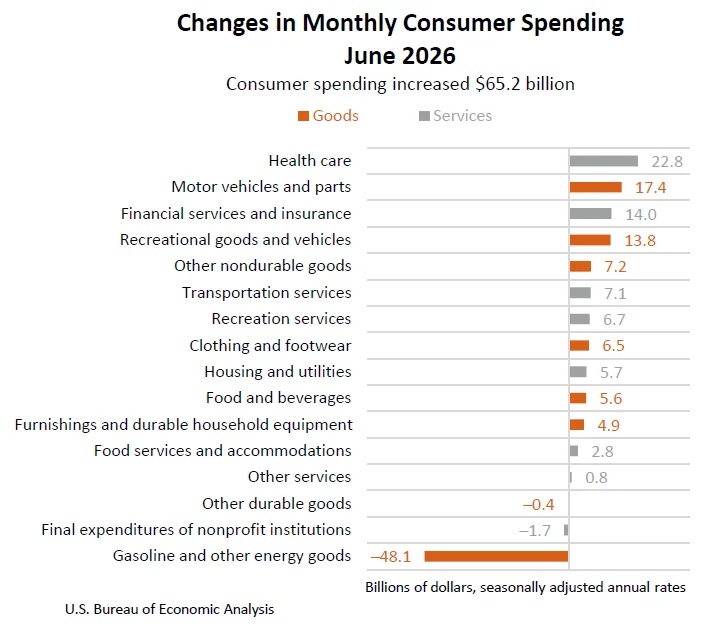
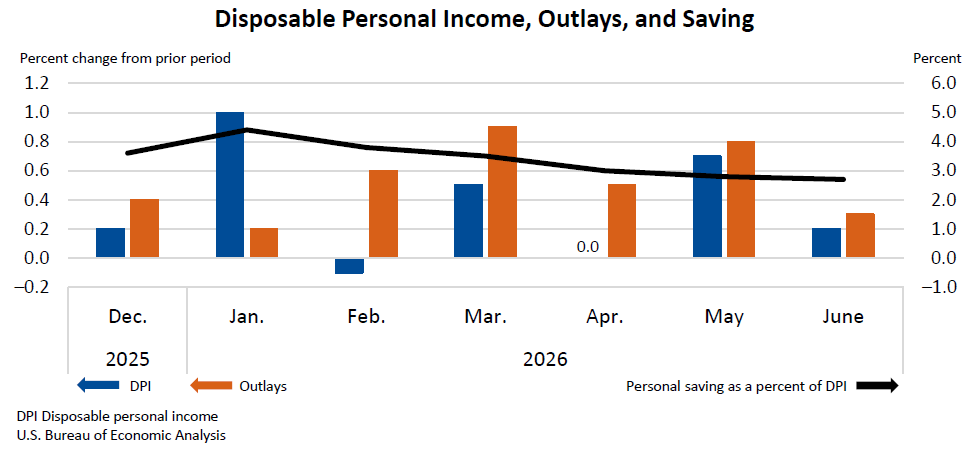
Personal income increased by $54.9 billion, or 0.2 percent at a monthly rate, in June, according to revised estimates released by the U.S. Bureau of Economic Analysis (BEA). This modest gain indicates a continued, albeit tempered, expansion in household earnings as the economy navigates various domestic and global economic pressures. Disposable personal income (DPI), representing the income available to individuals after taxes, also saw a similar increase of $48.3 billion, or 0.2 percent, reflecting the net effect of income gains and tax obligations. Concurrently, personal consumption expenditures (PCE), a key measure of consumer spending, rose by $65.2 billion, or 0.3 percent, suggesting that consumers, while cautious, continued to spend.
The BEA’s report, released on August 26, 2026, provides a crucial snapshot of the financial health of American households and their impact on the broader economic landscape. The figures for June follow a period of more robust growth in April and May, where current-dollar personal income and disposable personal income each increased by 0.7 percent. This deceleration in the rate of income growth warrants careful examination of the underlying components driving these trends.
Key Metrics and Their Movements
The comprehensive data released by the BEA breaks down personal income and its disposition into several critical components. Personal outlays, which encompass personal consumption expenditures, personal interest payments, and personal current transfer payments, climbed by $70.0 billion in June. This signifies a net increase in the total spending and financial obligations of households.
A closely watched metric, personal saving, stood at $646.1 billion in June. The personal saving rate, calculated as personal saving as a percentage of disposable personal income, registered at 2.7 percent. This rate has fluctuated in recent months, reflecting a delicate balance between income generation, tax liabilities, and consumer spending habits. In May, the personal saving rate was 3.0 percent, indicating a slight dip in the proportion of disposable income being saved.
Driving Forces Behind Income Growth
The primary drivers of the current-dollar personal income increase in June were notable gains in compensation, personal income receipts on assets, and government social benefits. Compensation, which includes wages and salaries, is a fundamental indicator of labor market health. An increase in compensation suggests either a rise in employment levels, higher wage rates, or a combination of both.
Personal income receipts on assets, encompassing income from dividends, interest, and rent, also contributed to the overall growth. This component can be sensitive to market performance and prevailing interest rate environments. Government social benefits, such as Social Security, Medicare, and unemployment benefits, played a significant role in bolstering household incomes. Recent revisions to estimates for April and May, particularly concerning government social benefits like Medicaid, were influenced by updated data from the Centers for Medicare & Medicaid Services and new Monthly Treasury Statement data, underscoring the dynamic nature of these government programs.
However, these positive contributions were partially offset by a decrease in farm proprietors’ income. This sector can be subject to volatility due to factors such as weather patterns, commodity prices, and global agricultural demand. The decline in farm income suggests that challenges in this specific sector may be tempering the broader income growth picture.
Consumer Spending Trends: Services Lead the Way
The $65.2 billion increase in current-dollar personal consumption expenditures (PCE) was a significant indicator of ongoing consumer activity. This rise was predominantly driven by an expansion in spending on services, which grew by $58.2 billion. The services sector, encompassing everything from healthcare and education to entertainment and travel, has been a key area of consumer spending, particularly as pandemic-related restrictions eased and behavioral patterns shifted.
Spending on goods also contributed to the overall PCE increase, albeit to a lesser extent, rising by $7.0 billion. This suggests that while the demand for physical goods remains, the growth momentum is more pronounced in the service-oriented economy.
Real vs. Nominal Growth: Understanding Purchasing Power
Beyond nominal dollar increases, the BEA also provides data on real PCE, which adjusts for inflation. Real PCE increased by $68.0 billion, or 0.4 percent at a monthly rate, in June. This figure is particularly important as it reflects the actual volume of goods and services purchased by consumers, taking into account changes in prices. The fact that real PCE grew at a slightly faster rate (0.4%) than nominal PCE (0.3%) suggests that the overall price level for consumer goods and services moderated in June.
Inflationary Landscape: A Mixed Picture
The PCE price index, a key inflation gauge closely watched by the Federal Reserve, presented a mixed picture for June. From the preceding month, the PCE price index decreased by 0.1 percent. This modest decline indicates a cooling of inflationary pressures in the short term.
Further dissecting this figure, the core PCE price index, which excludes volatile food and energy prices, increased by 0.1 percent in June. This measure is often considered a more stable indicator of underlying inflation trends. The slight uptick in core PCE suggests that while headline inflation eased, the underlying inflationary momentum in non-food and non-energy components remained.
Looking at the year-over-year trend, the PCE price index for June increased by 3.7 percent compared to the same month one year ago. This year-over-year increase reflects accumulated inflationary pressures over the past twelve months. The core PCE price index, excluding food and energy, rose by 3.3 percent from one year ago, indicating that inflationary pressures, while potentially moderating month-to-month, remain elevated on an annual basis. These figures provide context for the ongoing debate and policy decisions surrounding inflation management by the Federal Reserve.
A Look Back: Revisions and Historical Context
The BEA’s reports are subject to revisions as more complete data becomes available. For April and May, estimates for personal income were updated, incorporating revised Bureau of Labor Statistics (BLS) data. These revisions highlight the iterative nature of economic data collection and analysis. The adjustments to government social benefits, particularly Medicaid, underscore the complexity of tracking these large-scale programs and the reliance on detailed data from various government agencies.
The June data arrives amidst a backdrop of a dynamic global economic environment. Factors such as geopolitical uncertainties, ongoing supply chain adjustments, and shifts in consumer behavior continue to shape the economic outlook. The Federal Reserve has been actively managing monetary policy to address inflation while seeking to maintain economic stability. The recent interest rate decisions and forward guidance from the Fed are designed to influence borrowing costs, investment, and consumer spending, with the aim of achieving price stability without triggering a significant economic downturn.
Broader Economic Implications and Outlook
The modest increase in personal income and the continued, though somewhat decelerated, growth in consumer spending suggest a resilient, yet cautious, U.S. economy. The BEA’s data provides essential inputs for policymakers, businesses, and investors to gauge the strength of domestic demand and the overall health of the economy.
The divergence between nominal and real PCE growth, coupled with the mixed inflation signals, suggests that consumers are facing a complex economic environment. While nominal incomes are rising, the real purchasing power of those incomes is influenced by the rate of inflation. The personal saving rate’s position at 2.7 percent indicates that a significant portion of disposable income is being channeled into consumption, but the room for increased savings or discretionary spending may be constrained for some households.
The BEA’s report also serves as a precursor to future economic analyses. The upcoming Annual Update of the National and Regional Economic Accounts, scheduled for September 30, 2026, will incorporate comprehensive revisions to national, industry, and regional data. This annual update is a critical event that refines historical economic statistics and provides a more accurate picture of economic performance.
Looking Ahead: The Next Data Release
The next release of Personal Income and Outlays data, covering July 2026, is scheduled for August 26, 2026, at 8:30 a.m. EDT. This forthcoming report will offer updated insights into consumer behavior and income trends, providing further clarity on the trajectory of the U.S. economy in the summer months. Analysts will be particularly keen to observe whether the trends observed in June – the modest income growth, the continued but moderated spending, and the mixed inflation picture – persist or evolve.
In conclusion, the June data from the BEA paints a picture of an economy characterized by steady, albeit not explosive, growth in personal income and consumer spending. The interplay of rising compensation, asset income, and government benefits, counterbalanced by a dip in farm income, highlights the diverse factors influencing household finances. As the nation navigates a complex economic landscape, these detailed metrics from the Bureau of Economic Analysis remain indispensable for understanding the pulse of the American consumer and the broader economic environment. The ongoing updates and detailed breakdowns provided by the BEA are crucial for informed economic decision-making and analysis.








