
 Lana Rhoades
The U.S. Bureau of Economic Analysis (BEA) has released its latest comprehensive report on the outdoor recreation economy, painting a vivid picture of its substantial and growing influence on national and state-level economic output. The findings, detailing the economic contributions for the nation, all 50 states, and the District of Columbia, underscore the sector’s resilience and dynamism, highlighting its role as a significant driver of employment, compensation, and overall gross domestic product (GDP).
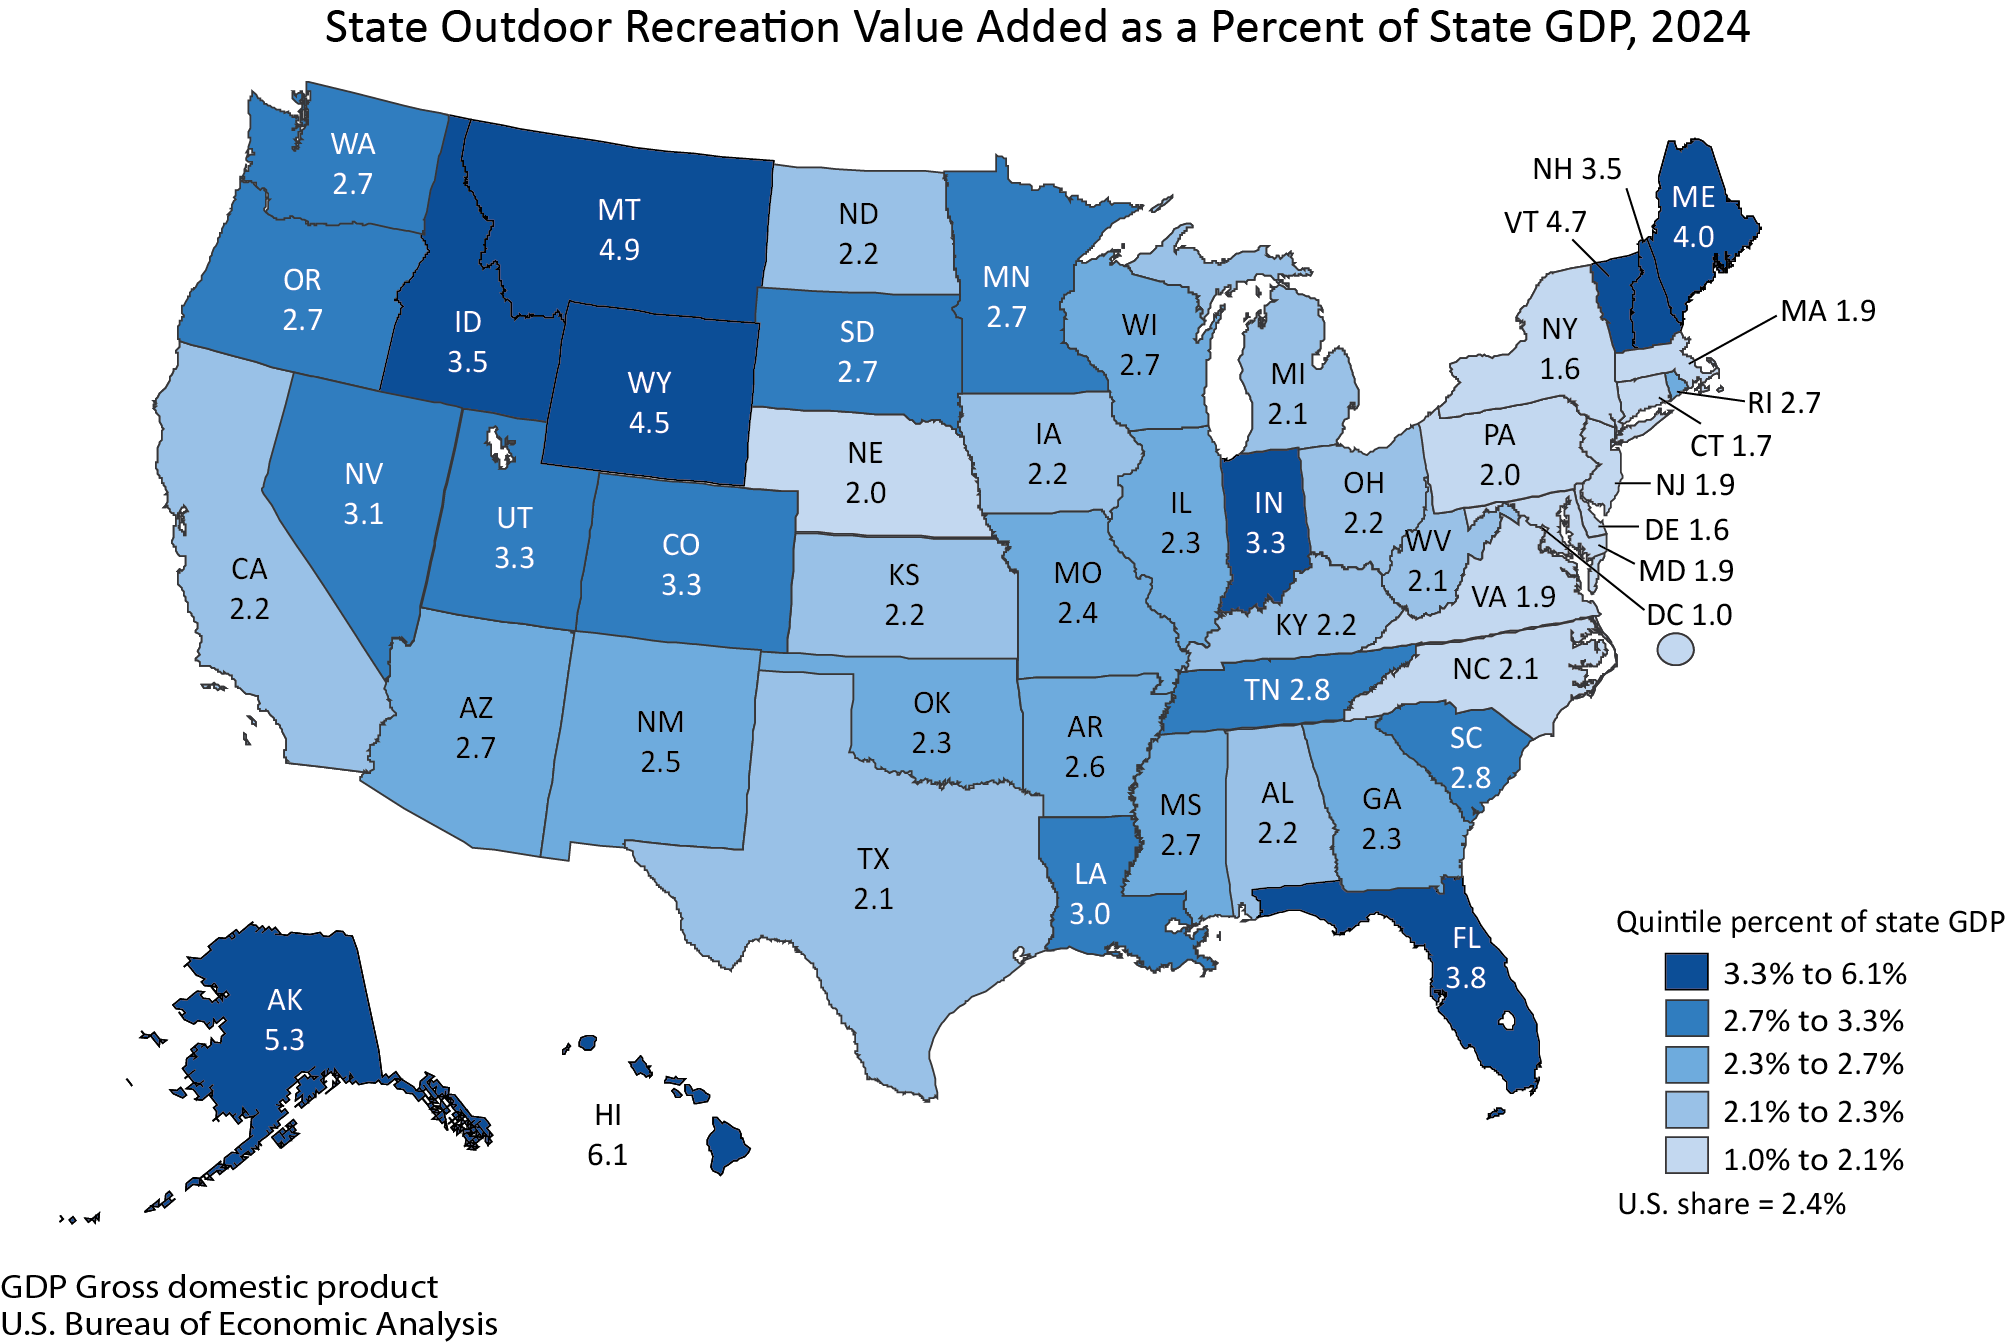
In 2024, the outdoor recreation economy accounted for an impressive 2.4 percent of the nation’s current-dollar GDP, translating to a staggering $696.7 billion. This figure, presented in national table 2 of the report, demonstrates the sector’s robust presence within the broader American economic landscape. While this national average provides a broad overview, the BEA data also reveals considerable variation at the state level. The value added by outdoor recreation as a share of state GDP ranged from a commanding 6.1 percent in Hawaii, a state heavily reliant on its natural beauty and tourism, to a more modest 1.0 percent in the District of Columbia, where the economic landscape is dominated by federal government and service industries. This disparity highlights the localized impact and unique economic structures that characterize outdoor recreation across the United States.
A Deeper Dive into Economic Growth and Trends
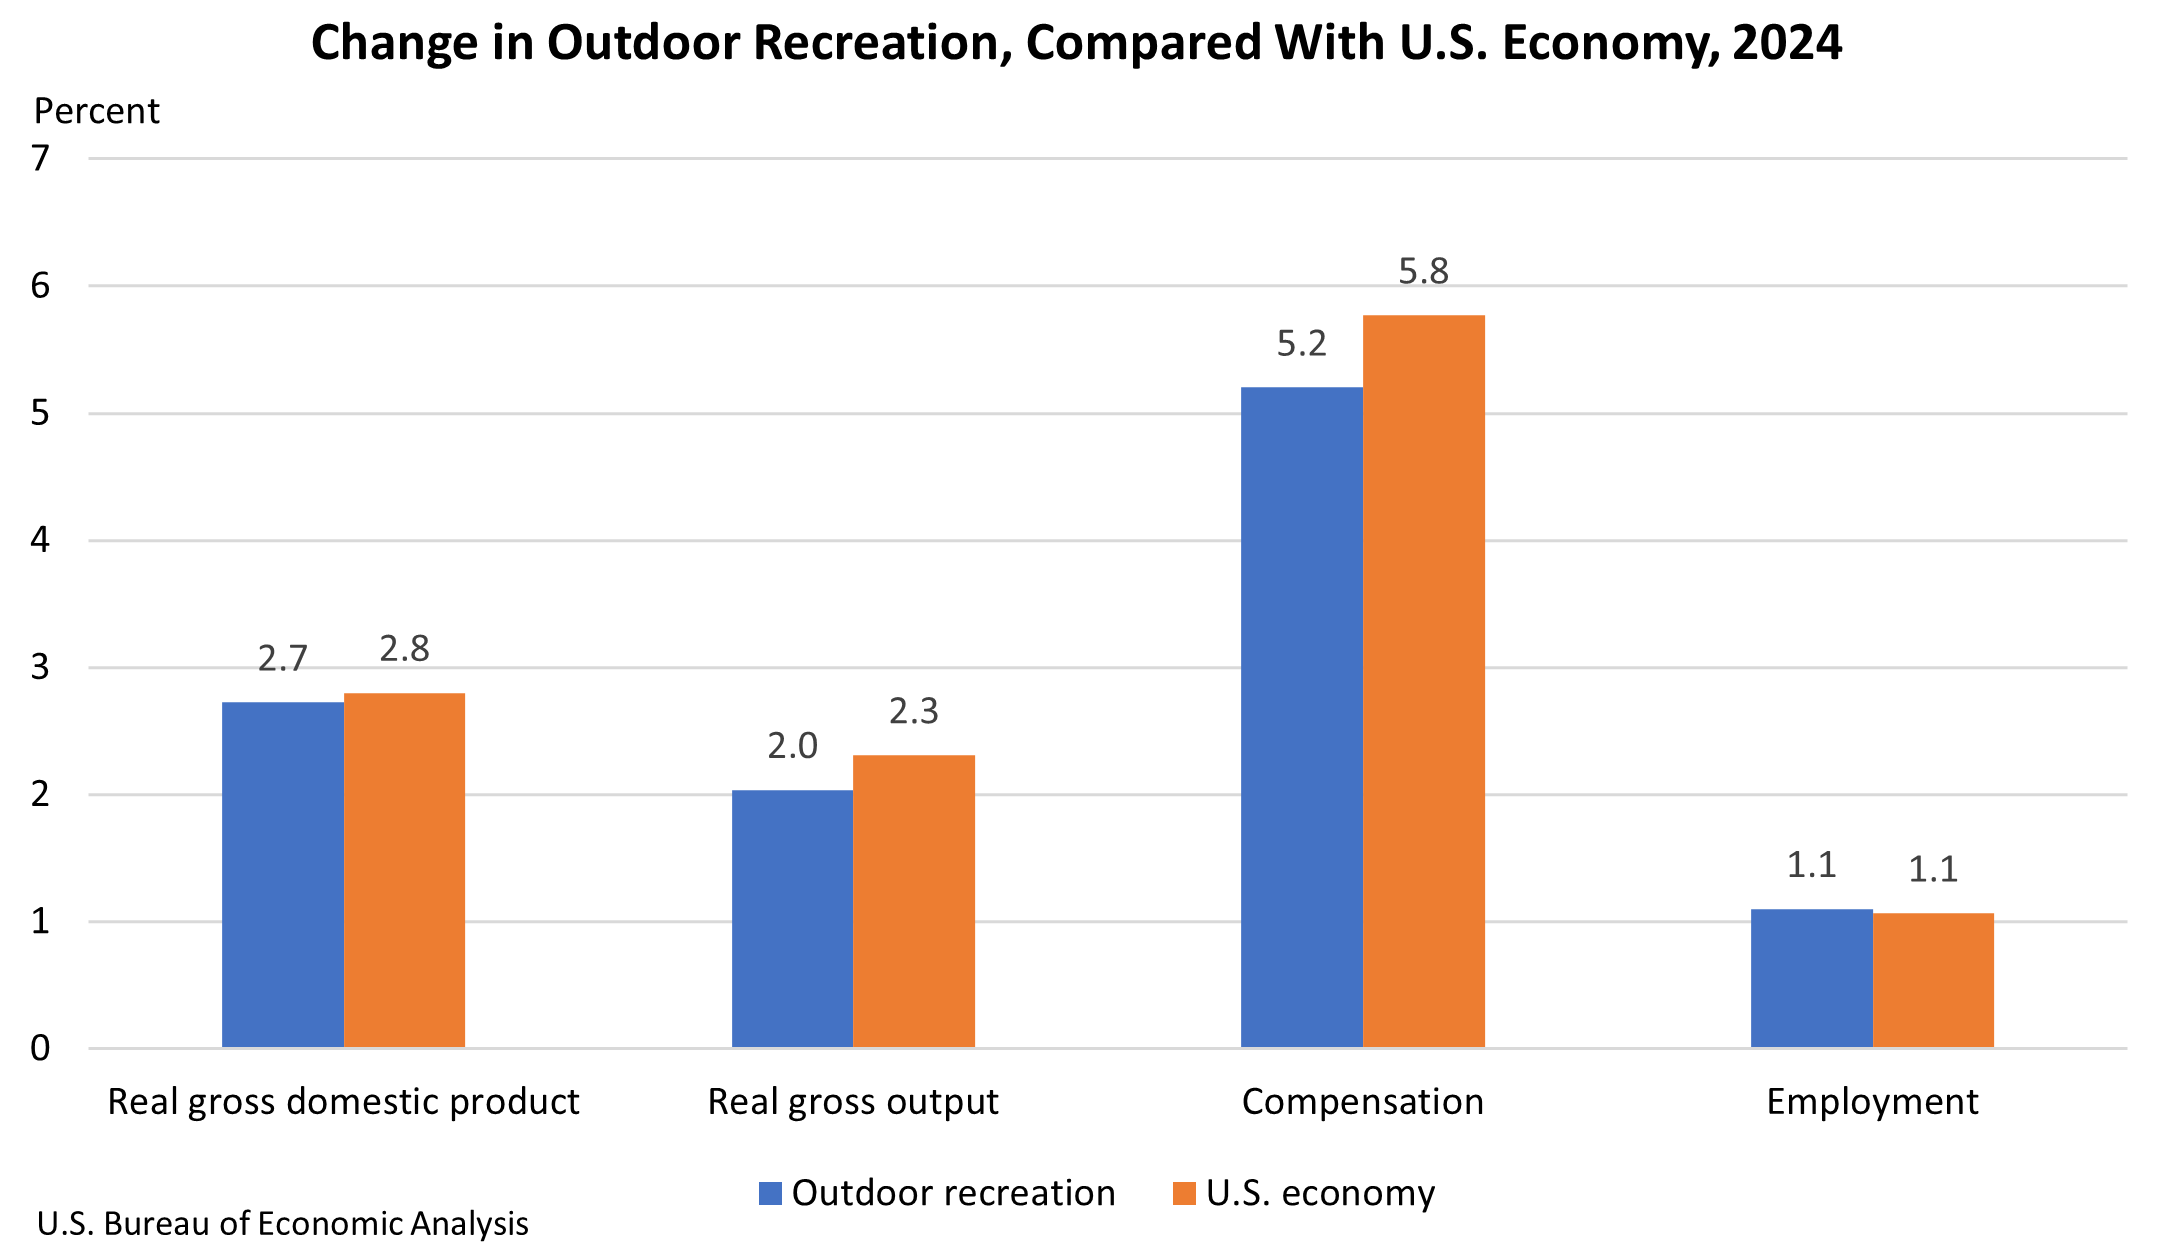
Beyond the headline GDP figures, the report offers crucial insights into the sector’s growth trajectory. Inflation-adjusted, or "real," GDP for the outdoor recreation economy saw an increase of 2.7 percent in 2024. This growth, while slightly trailing the overall U.S. economy’s 2.8 percent increase for the same period, represents a notable deceleration from the robust 5.3 percent surge experienced in 2023, as detailed in national table 1. This shift suggests a return to more sustainable growth patterns following a period of exceptional expansion.
The sector’s overall economic output, measured by real gross output, also showed positive momentum, increasing by 2.0 percent. Furthermore, compensation within the outdoor recreation industry experienced a substantial rise of 5.2 percent, and employment within the sector grew by 1.1 percent, according to national table 9. These figures indicate that while the pace of expansion may be moderating, the outdoor recreation economy continues to generate valuable employment opportunities and contribute to worker earnings.
Employment Dynamics Across the States
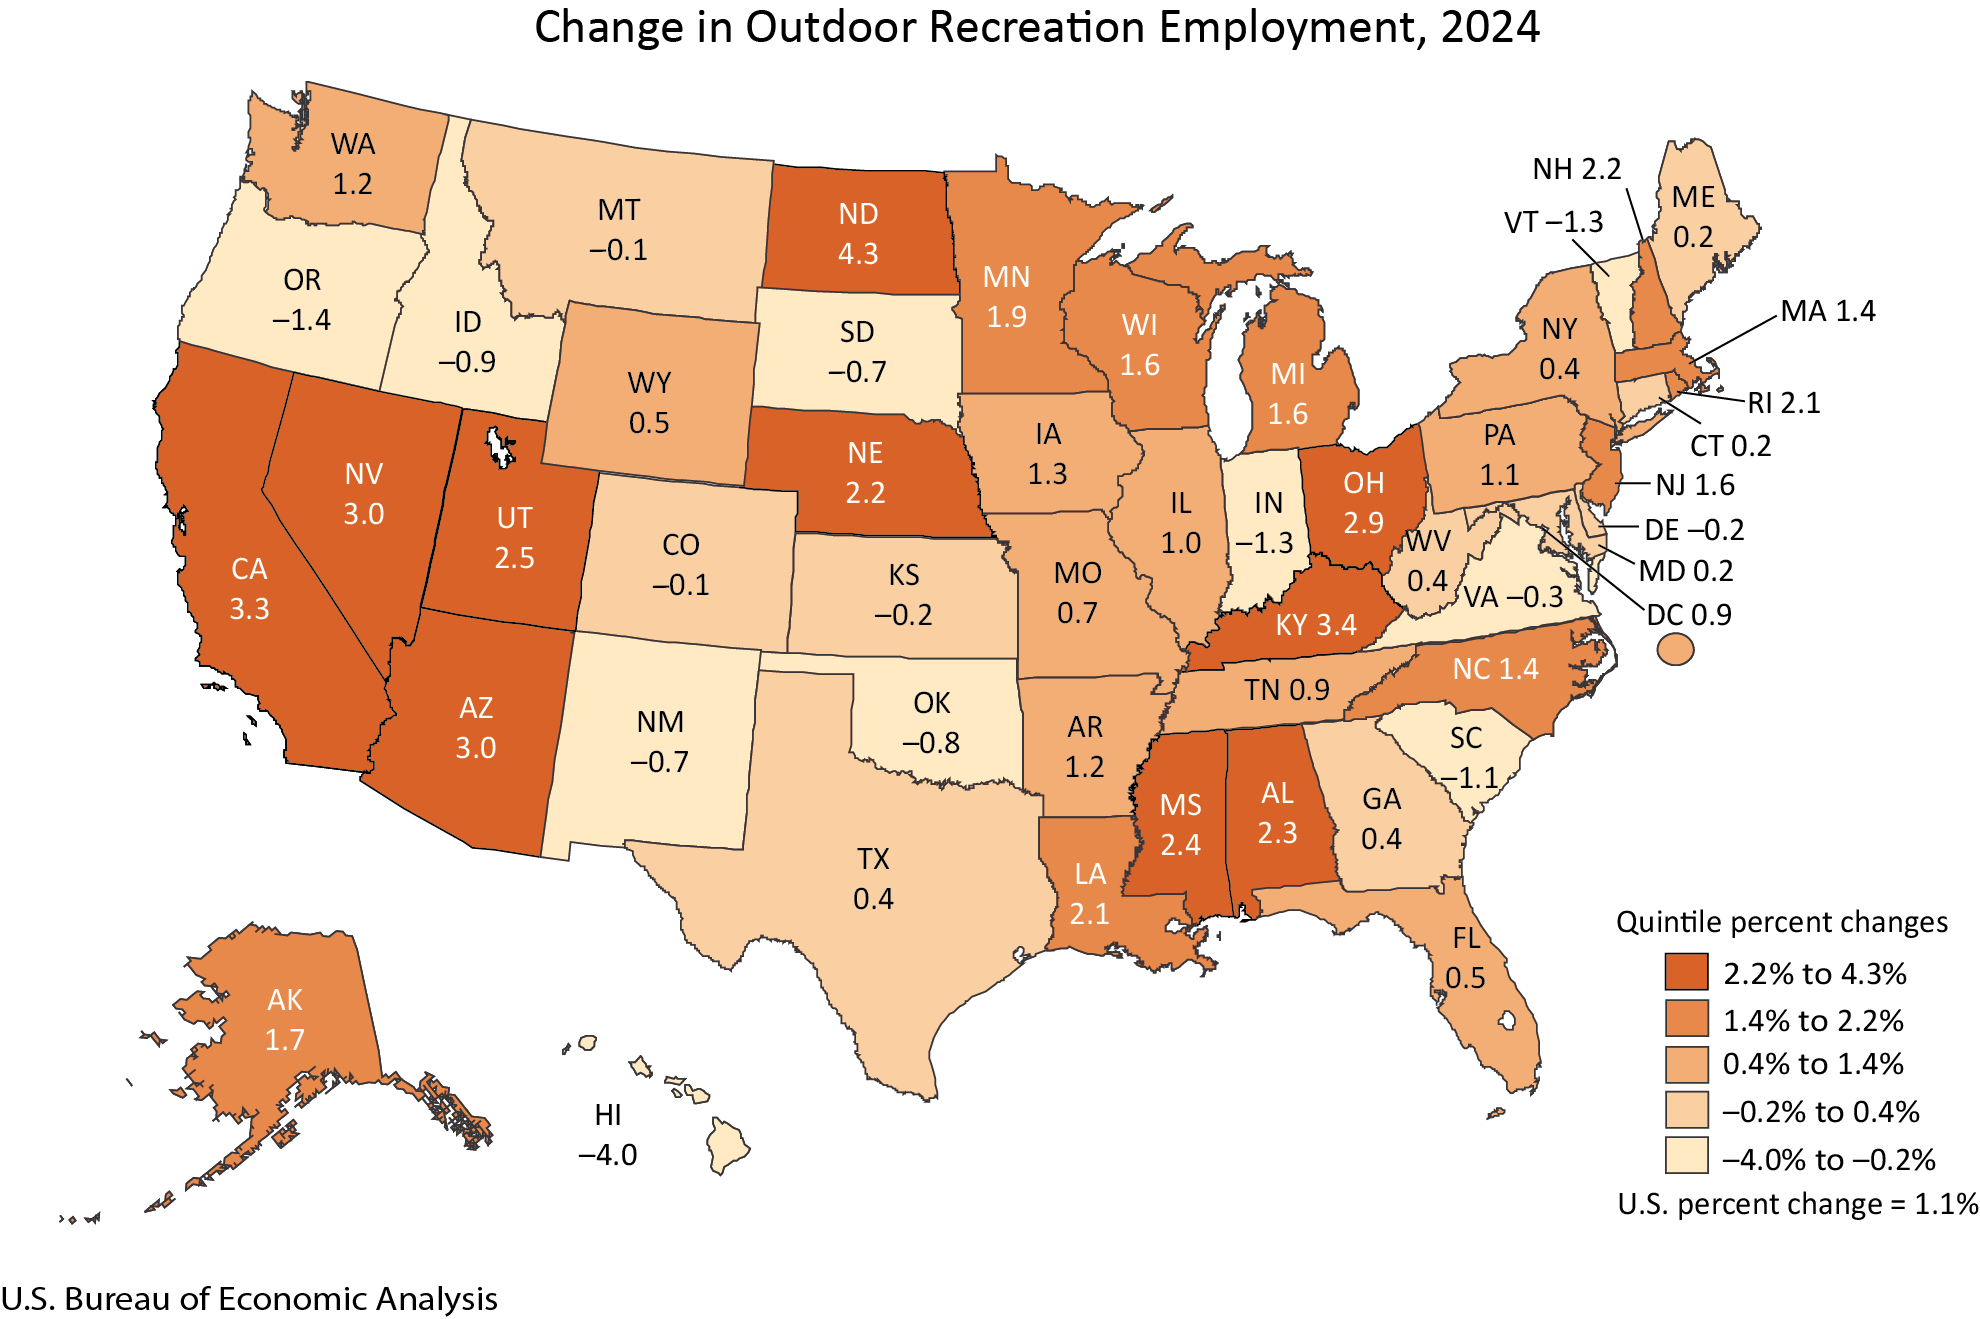
The BEA’s data also sheds light on the geographical distribution of job growth within the outdoor recreation sector. In 2024, outdoor recreation employment saw an increase in 36 states and the District of Columbia. The percentage change in outdoor recreation employment varied significantly across these regions, ranging from a remarkable 4.3 percent increase in North Dakota to a contraction of 4.0 percent in Hawaii. These figures, accessible through the BEA’s interactive tables, underscore the diverse economic conditions and specific industry dynamics that influence job creation in outdoor recreation from one state to another. North Dakota’s strong performance, for instance, could be attributed to specific local initiatives or a burgeoning interest in outdoor activities within the state, while Hawaii’s decline might reflect a recalibration after post-pandemic tourism booms or shifts in visitor preferences.
Categorizing the Outdoor Recreation Experience
The BEA categorizes outdoor recreation activities into three broad groups to provide a more granular understanding of the sector’s composition:
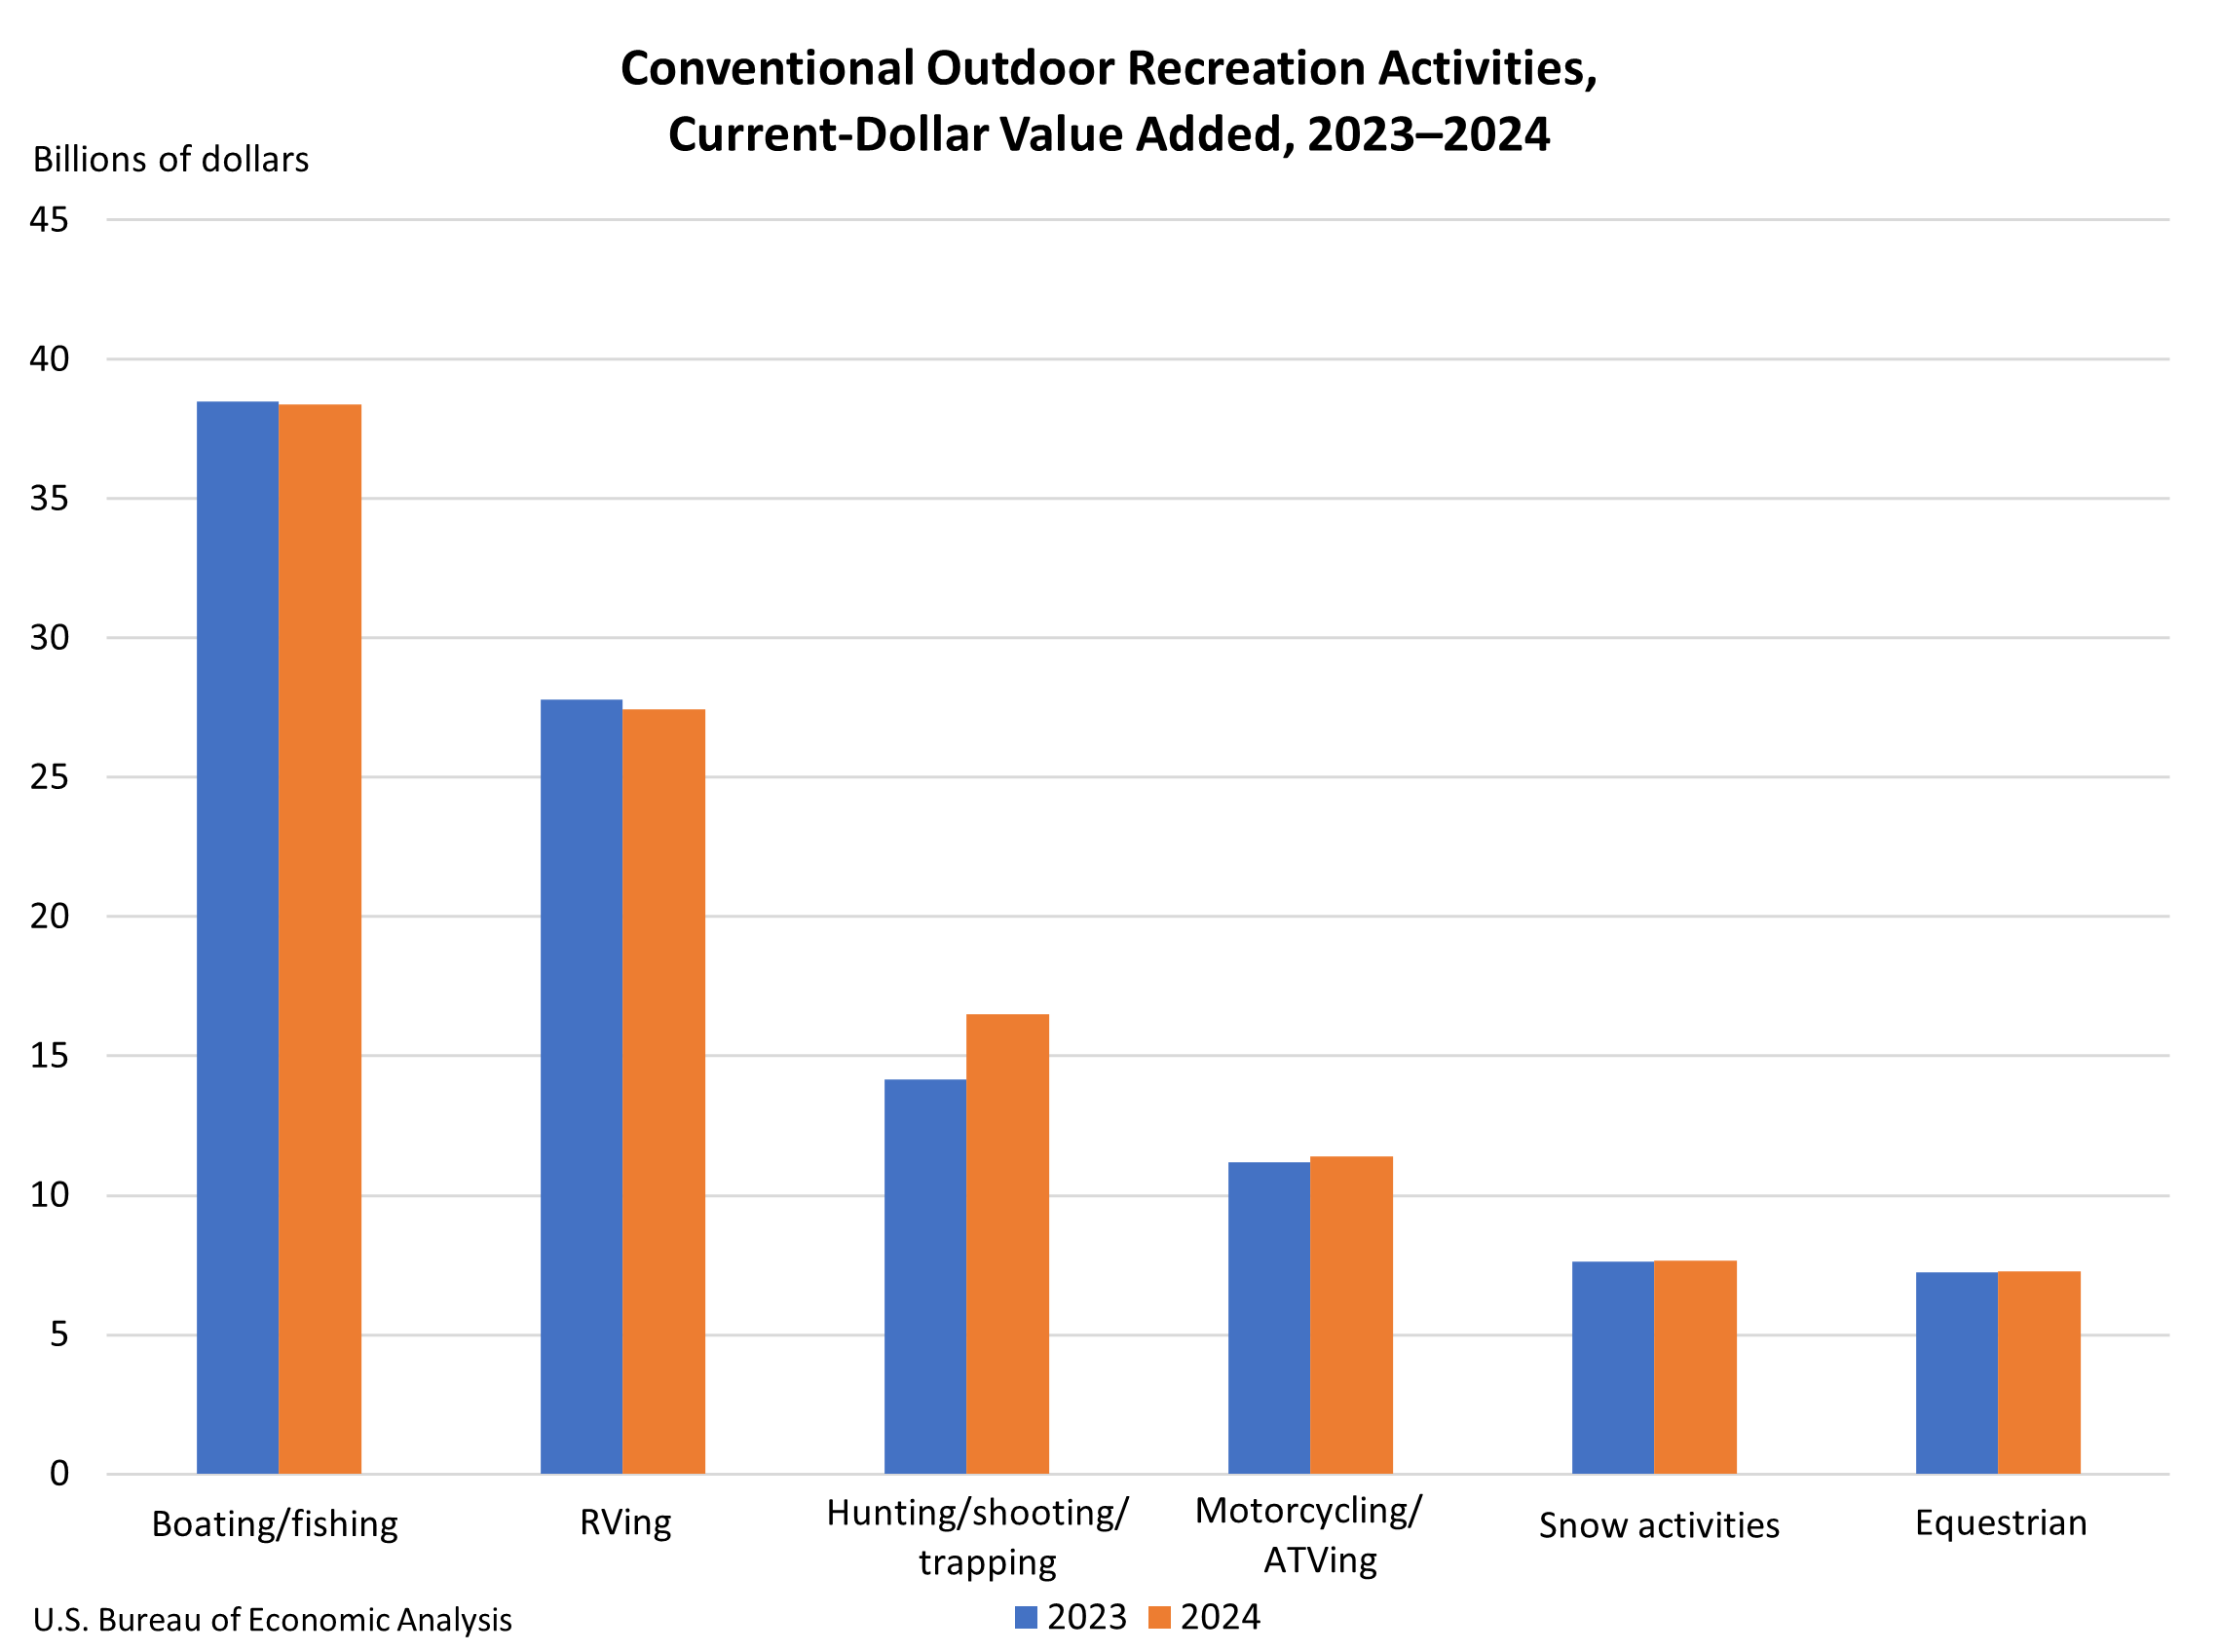
- Conventional Activities: This category encompasses traditional outdoor pursuits such as bicycling, boating, hiking, hunting, fishing, camping, and sports like golf and tennis. These activities often form the core of many people’s engagement with the outdoors.
- Other Activities: This group includes a wider array of leisure pursuits that take place outdoors but may not be as physically demanding or traditionally defined as "sports." Examples include gardening, outdoor concerts, festivals, and nature observation.
- Supporting Activities: This crucial category underpins the entire outdoor recreation ecosystem. It includes industries that facilitate outdoor experiences, such as construction (of trails, parks, and recreational facilities), travel and tourism (transportation, lodging, and food services), local trips and transportation, and government expenditures on public lands and recreation management.
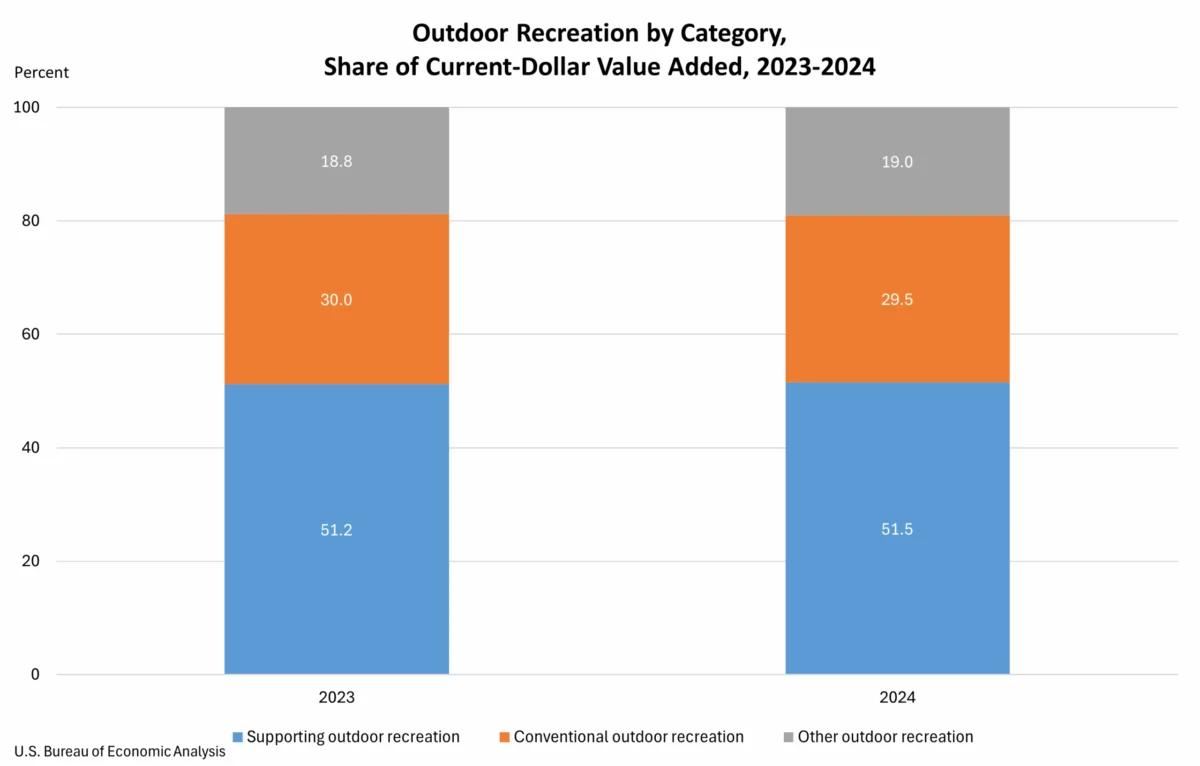
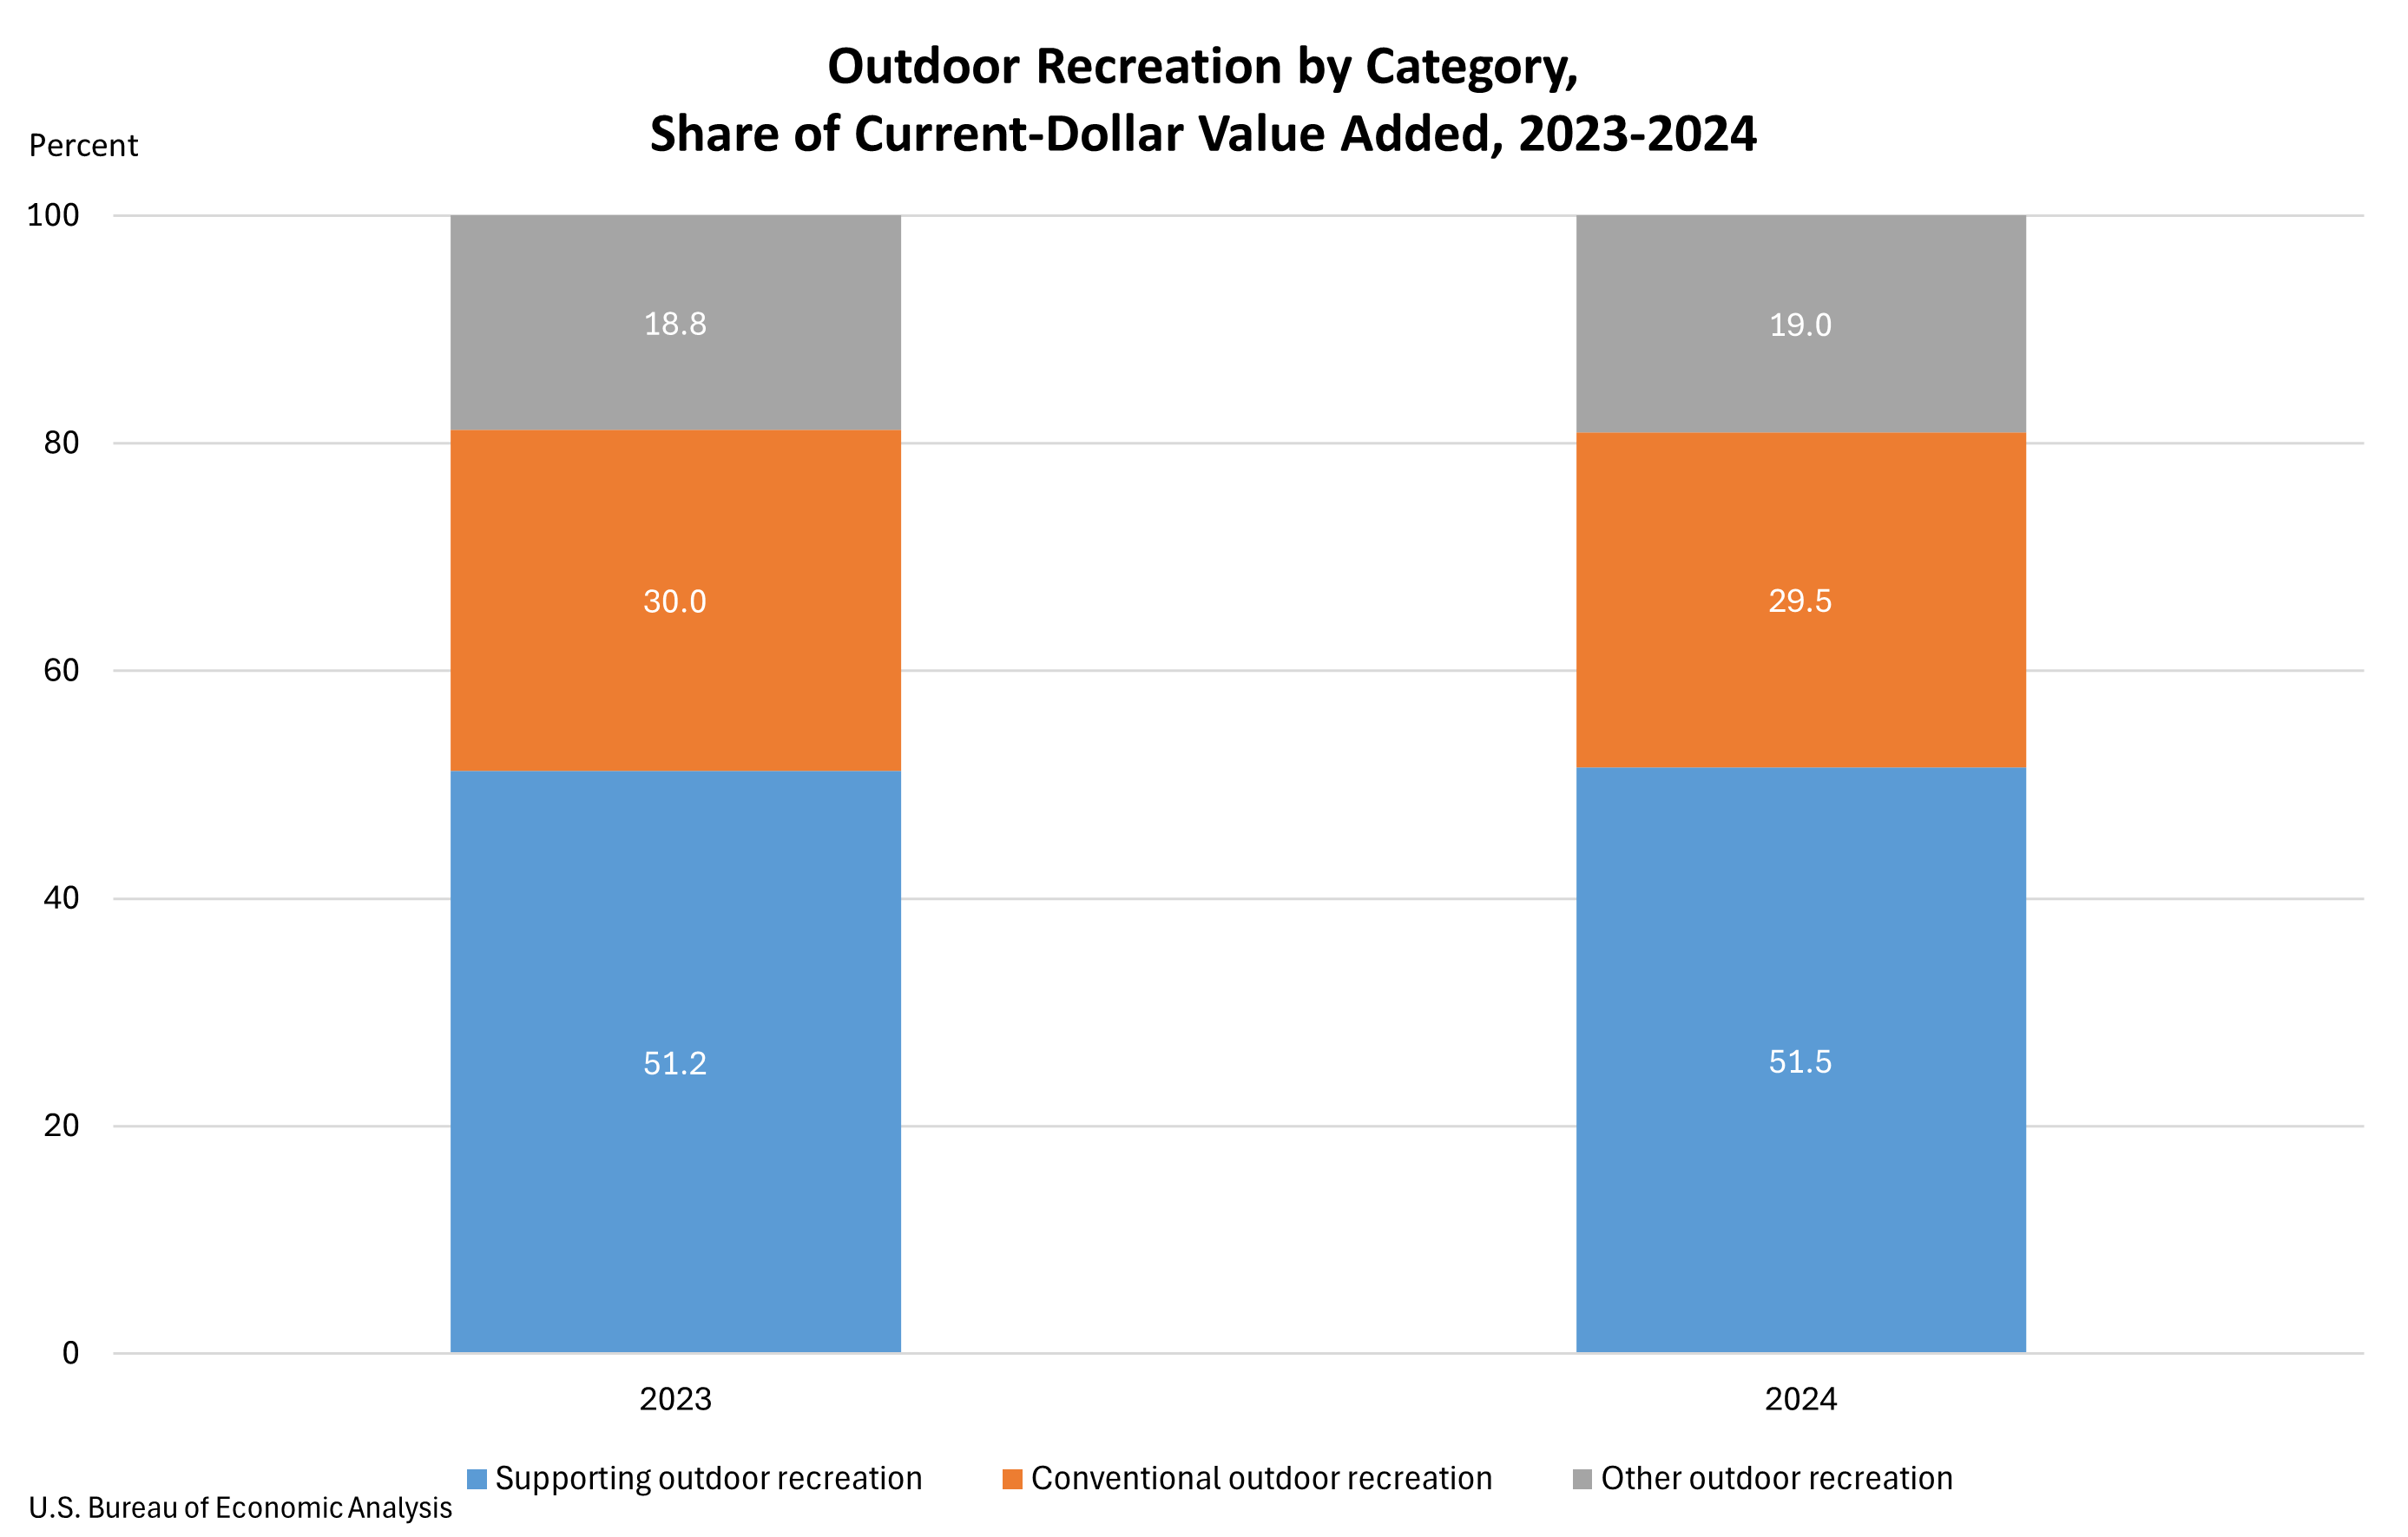
In 2024, conventional outdoor recreation activities accounted for 29.5 percent of the U.S. outdoor recreation value added, a slight decrease from 30.0 percent in 2023. "Other outdoor recreation" saw a marginal increase, representing 19.0 percent of value added compared to 18.8 percent in the previous year. The largest share, however, continues to be held by supporting activities, which constituted 51.5 percent of value added in 2024, up from 51.2 percent in 2023. The growth within supporting activities was primarily driven by the travel and tourism subsector, which benefited from increased spending on transportation, hotels, and restaurants. This trend indicates that while direct participation in conventional outdoor activities remains vital, the economic infrastructure that enables and enhances these experiences is becoming an increasingly dominant economic force.
Industry Contributions to the Outdoor Recreation Economy
The BEA’s analysis also breaks down the outdoor recreation economy by industry, revealing which sectors are most instrumental in its success.
Arts, Entertainment, Recreation, Accommodation, and Food Services: This industry group emerged as the largest contributor to the U.S. outdoor recreation value added in 2024, accounting for $174.4 billion, or 25.0 percent of the total. At the state level, this sector was the leading contributor to outdoor recreation value added in 23 states and the District of Columbia. California, Florida, and New York led the nation in this category, with contributions of $24.1 billion, $22.7 billion, and $11.8 billion, respectively. This highlights the integral role of hospitality and leisure services in facilitating and capitalizing on outdoor recreation demand.
Retail Trade: As the second-largest industry contributor nationwide, retail trade generated $169.1 billion, representing 24.3 percent of the outdoor recreation value added. This sector was the primary driver of outdoor recreation value added in 24 states. California ($19.3 billion), Texas ($14.4 billion), and Florida ($13.4 billion) were the top states in this sector. This underscores the significant role of retail in providing the gear, apparel, and equipment necessary for outdoor pursuits.
Manufacturing: The manufacturing sector ranked third nationally, contributing $91.3 billion, or 13.1 percent of value added. This industry was the largest contributor to outdoor recreation value added in two states: Indiana and Louisiana. Texas ($13.1 billion), California ($11.6 billion), and Indiana ($9.1 billion) were the leading states in manufacturing’s contribution to the outdoor recreation economy. This segment likely includes the production of recreational vehicles, boats, camping equipment, and other outdoor-related goods.
Context and Significance of the Annual Update
This release represents the annual update of the BEA’s outdoor recreation economic statistics, incorporating revised data from previous years and newly available source information. The estimates for 2020 through 2023 have been updated to reflect the results of the 2025 annual update of the National Economic Accounts, which includes the National Income and Product Accounts and the Industry Economic Accounts. This comprehensive revision ensures that the reported figures are as accurate and reflective of the current economic reality as possible. The state-level statistics have also been updated to incorporate these revised national data, as well as the 2025 annual update of the Regional Economic Accounts and newly available regional source data. This meticulous process of data collection and revision is crucial for providing policymakers, businesses, and the public with reliable insights into the economic performance of this vital sector.
Implications for Economic Policy and Future Growth
The sustained and significant contribution of the outdoor recreation economy to the U.S. GDP carries several important implications. Firstly, it reinforces the economic importance of public lands and natural resources. Investments in conservation, park infrastructure, and sustainable tourism practices can yield substantial economic returns, not only through direct spending but also through job creation and local economic development.
Secondly, the data highlights the interconnectedness of various industries within the outdoor recreation ecosystem. The strong performance of supporting activities, particularly travel and tourism, suggests that efforts to enhance accessibility, infrastructure, and visitor experiences can have a ripple effect across the entire sector.
Thirdly, the variations in state-level contributions underscore the need for tailored economic development strategies. States with a higher dependence on outdoor recreation may focus on expanding recreational opportunities and marketing their natural assets, while those with a lower contribution might explore ways to leverage their existing resources to tap into this growing market.
The BEA’s commitment to providing these detailed annual updates ensures that stakeholders have the most current and accurate information to inform their decisions. As the outdoor recreation economy continues to evolve, these statistics will be invaluable for understanding its trajectory, identifying emerging trends, and fostering its sustainable growth for years to come. The next release of Outdoor Recreation Economic Statistics for the U.S. and States, covering 2025, is anticipated in the Fall of 2026, promising further insights into this dynamic and increasingly vital segment of the American economy.