Lana Rhoades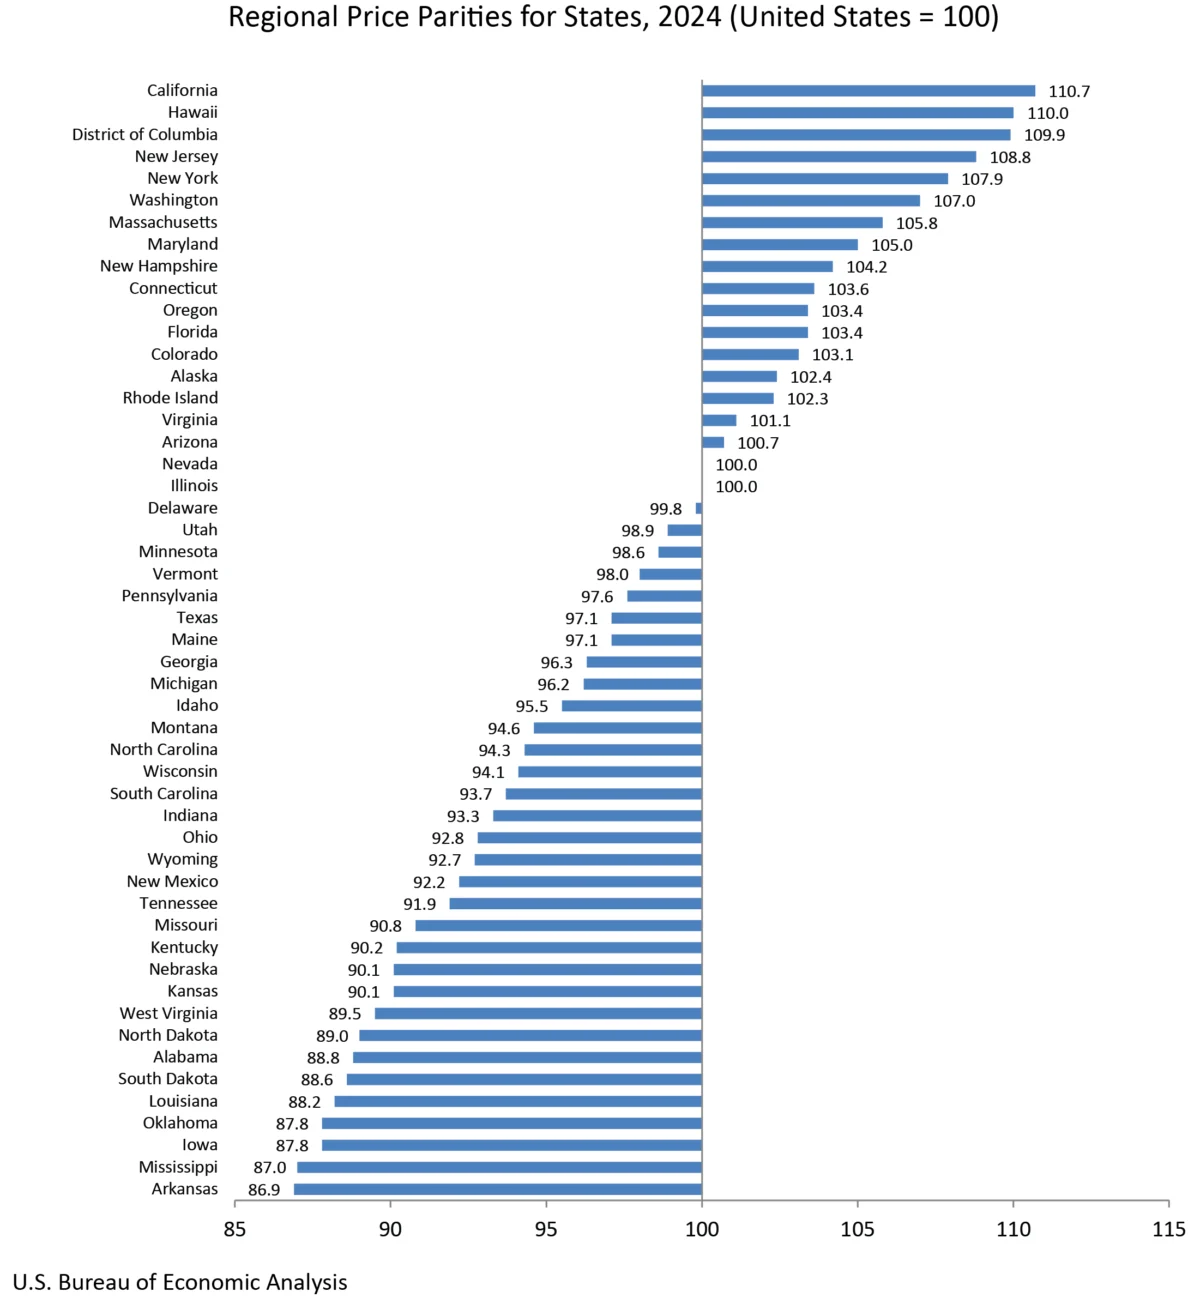
Washington D.C. – The U.S. Bureau of Economic Analysis (BEA) today unveiled its comprehensive annual statistics for 2024, offering a detailed look at real personal consumption expenditures (PCE), real personal income, and regional price parities (RPPs) across all 50 states and the District of Columbia. This release provides crucial insights into the economic health and disparities at the state level, highlighting the varying trajectories of consumer spending and income growth throughout the nation.
Key Findings in Real Personal Consumption Expenditures (PCE)
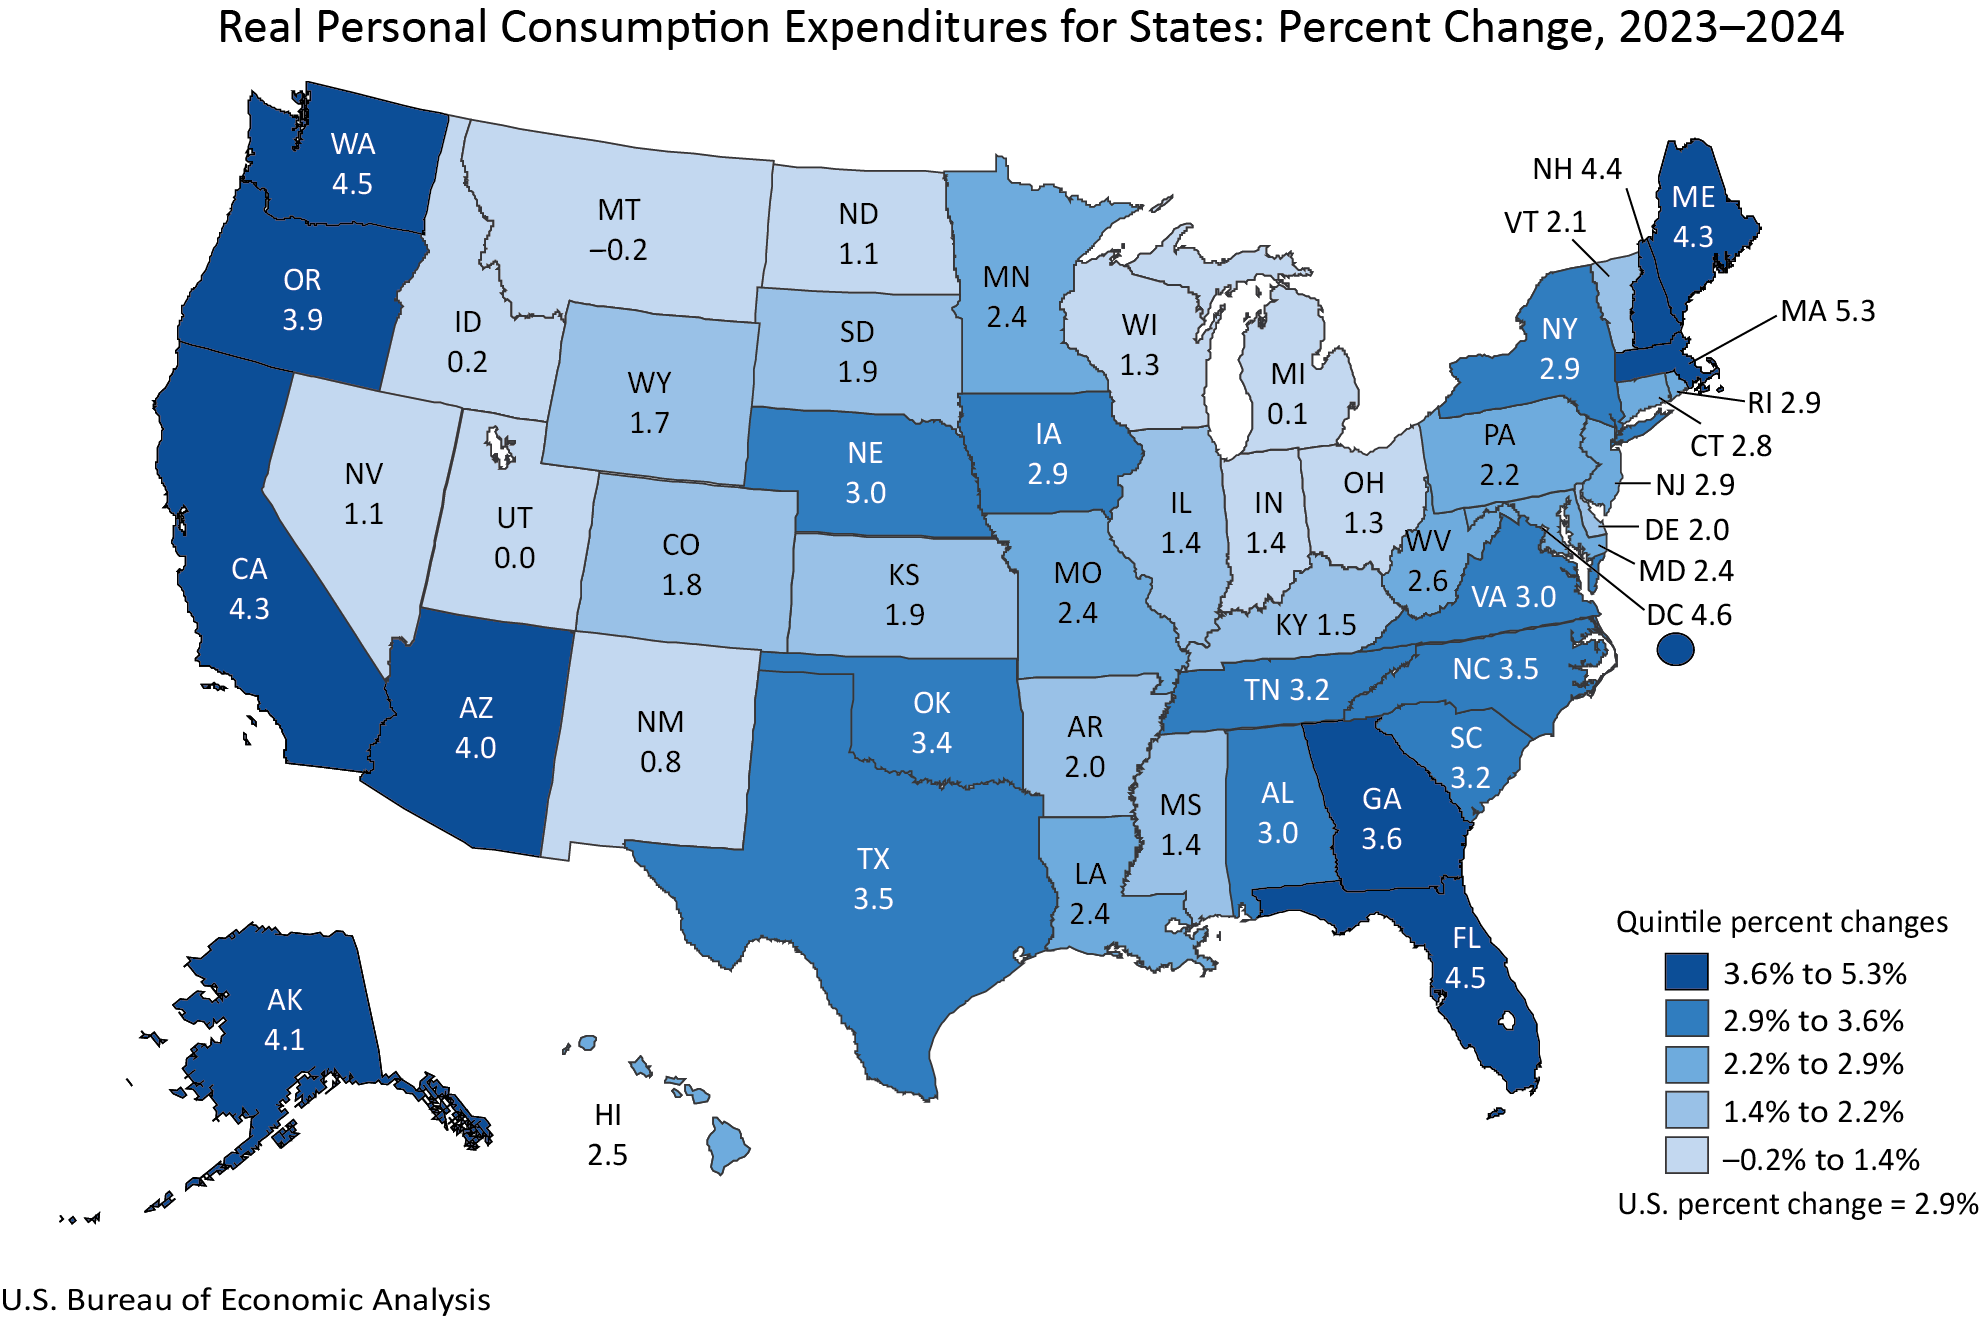
The data reveals a broad-based increase in real personal consumption expenditures, a key indicator of consumer demand and economic activity. In 2024, 48 states and the District of Columbia experienced growth in real PCE. The rate of this growth varied significantly, with Massachusetts leading the nation at a robust 5.3 percent increase. Conversely, Montana saw a slight contraction, reporting a -0.2 percent change.
Nationally, real PCE increased by 2.9 percent in 2024. This figure is particularly noteworthy when compared to the current-dollar PCE, which surged by 5.6 percent. The discrepancy between current-dollar and real PCE underscores the impact of inflation. The national PCE price index, a measure of inflation for consumer goods and services, stood at 2.6 percent for the year. The fact that current-dollar PCE grew at more than double the rate of inflation suggests that a substantial portion of the nominal increase in consumer spending was driven by price hikes rather than an actual increase in the volume of goods and services consumed.
The BEA’s methodology for calculating real PCE involves adjusting current-dollar estimates by both the regional price parity (RPP) and the national PCE price index. RPPs are essential for accurately comparing price levels across different regions, accounting for variations in the cost of living. By adjusting for these regional price differences, the BEA provides a more accurate picture of the real purchasing power of consumers in each state.
Leading and Lagging States in Consumer Spending
While Massachusetts showcased impressive growth in real PCE, other states also demonstrated strong consumer spending momentum. Detailed breakdowns, available through BEA’s interactive data application, allow for a granular analysis of these trends. The disparity in growth rates suggests differing economic engines and consumer confidence levels across the country. Factors such as employment rates, wage growth, and the prevalence of high-demand industries likely contribute to these variations. For instance, states with burgeoning technology sectors or robust tourism industries might naturally see higher rates of consumer spending growth.
Conversely, states experiencing economic headwinds, such as those heavily reliant on industries facing global competition or experiencing structural shifts, may exhibit slower or even negative growth in real PCE. Montana’s slight decline, while modest, could indicate localized economic challenges or a post-pandemic normalization of spending patterns.
Real Personal Income Trends: A Mixed Economic Landscape
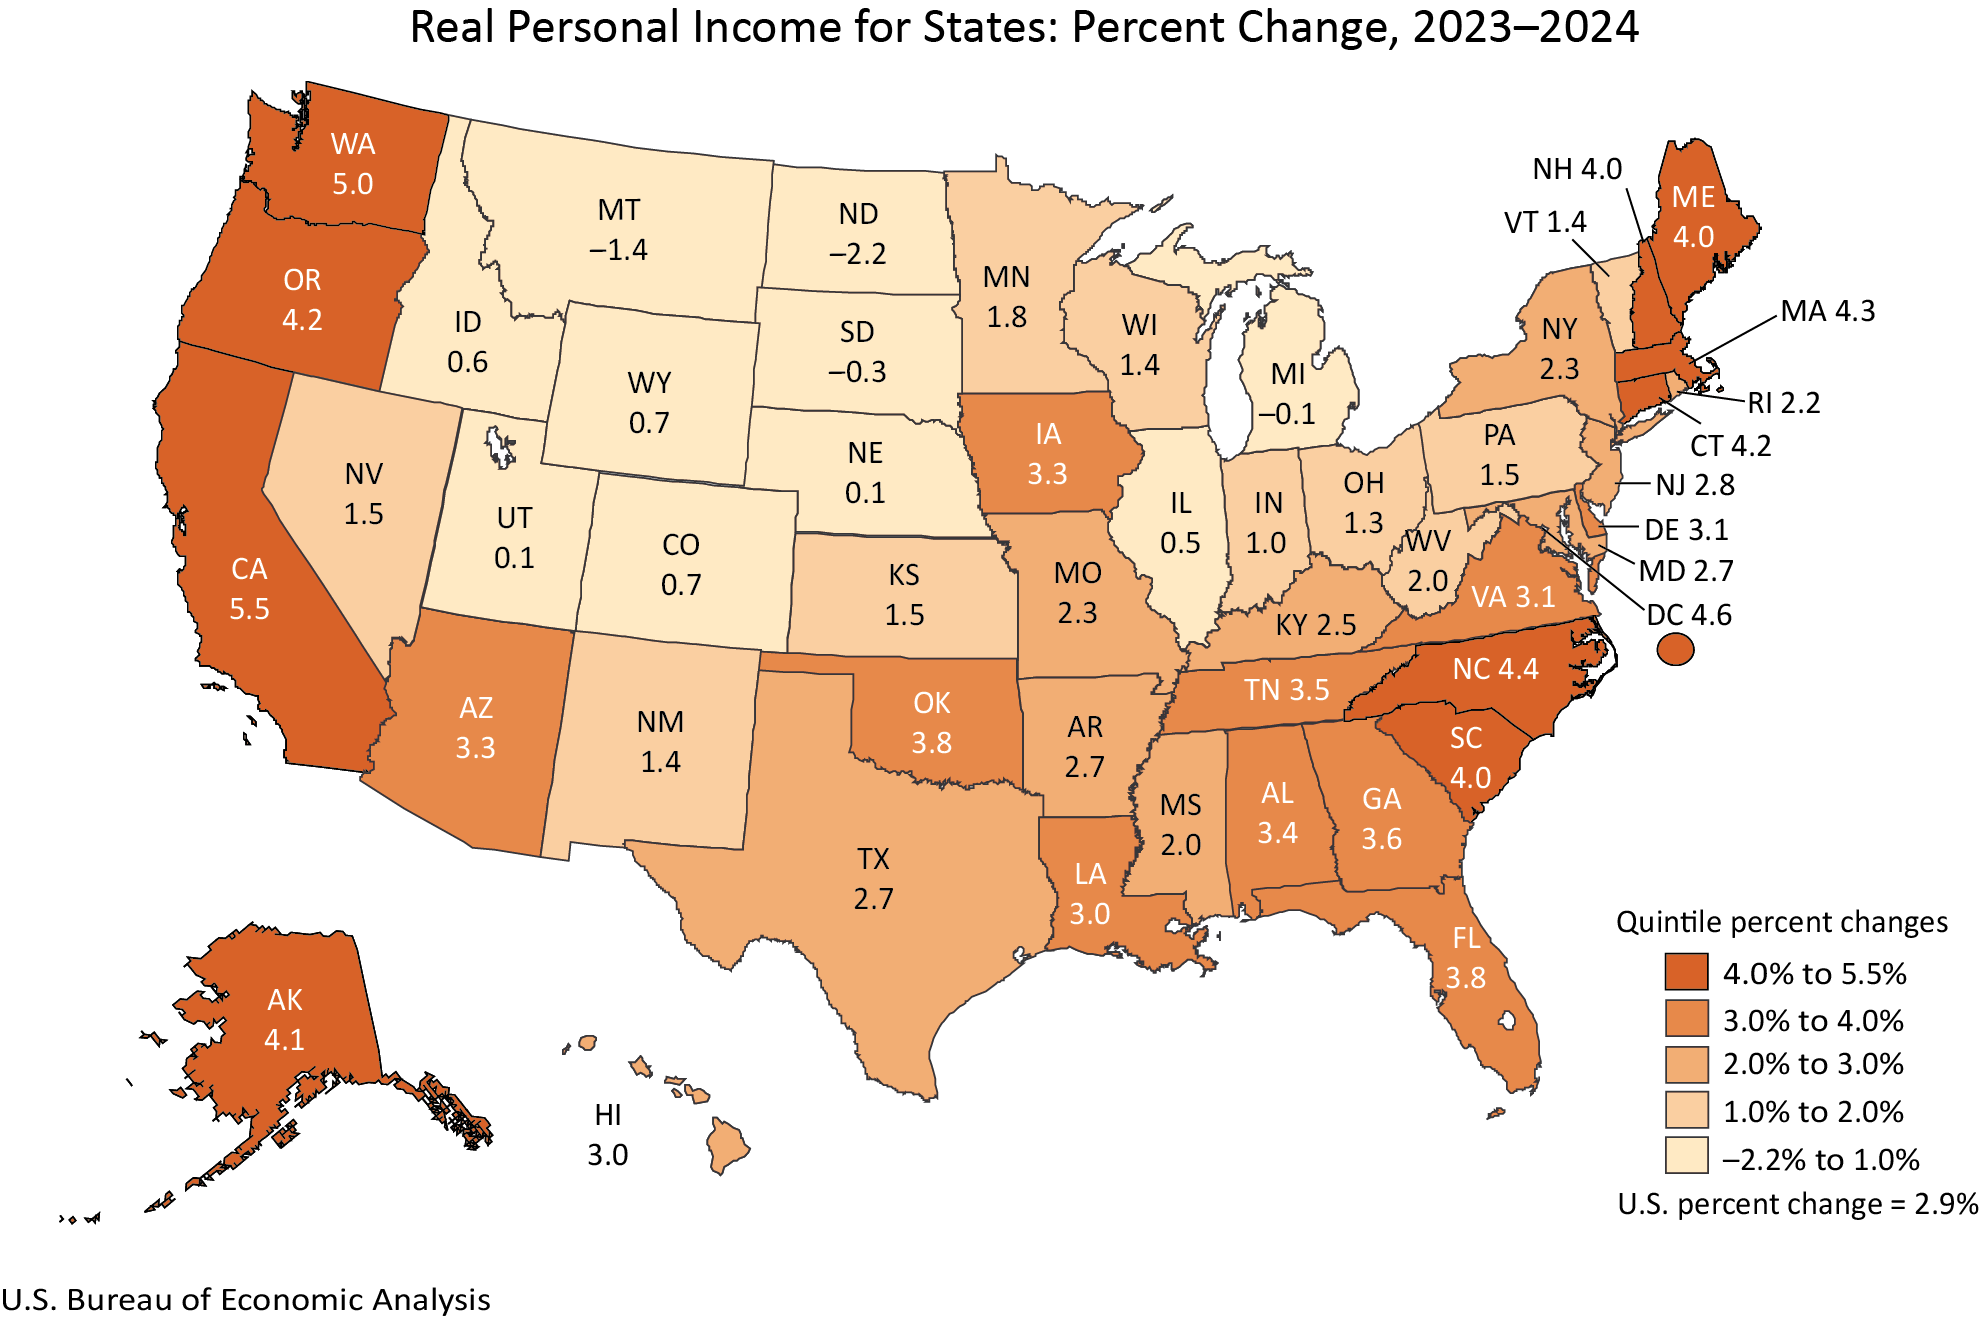
The data on real personal income paints a similarly dynamic picture, with growth observed in 46 states and the District of Columbia. California emerged as the leader in real personal income growth, posting an impressive 5.5 percent increase. North Dakota, however, recorded the largest decline, with real personal income falling by 2.2 percent.
Similar to PCE, real personal income is adjusted for inflation and regional price differences. Nationally, real personal income grew by 2.9 percent in 2024. Current-dollar personal income saw a more substantial increase of 5.6 percent, again outpacing the national PCE price index of 2.6 percent. This suggests that while incomes have risen, the real purchasing power of those incomes has been partially eroded by inflation.
The BEA’s calculation of real personal income involves adjusting current-dollar personal income by the national PCE price index and the state’s corresponding regional price parity. This ensures that comparisons of income are made on a comparable basis, reflecting both the inflation rate and the cost of living in each state.
California’s Economic Outperformance and North Dakota’s Challenges
California’s strong performance in real personal income growth can be attributed to several factors, including its large and diverse economy, particularly its thriving technology and entertainment sectors, which often command high salaries. The state’s robust job market and venture capital investments likely contribute to this upward trend.
North Dakota’s decline in real personal income, while potentially concerning, needs to be considered within its specific economic context. The state’s economy is heavily influenced by the energy sector, which can be subject to significant price volatility and global demand fluctuations. A downturn in oil prices or production could lead to reduced income for a substantial portion of the state’s workforce. Additionally, other factors such as out-migration or shifts in employment composition could also play a role.
Understanding Regional Price Parities (RPPs)
Regional Price Parities are a critical component of the BEA’s analysis, providing a measure of the price level differences across states. These parities are expressed as a percentage of the national price level, allowing for direct comparisons of the cost of living. The "all items RPP" encompasses all consumption goods and services, with housing rents being a significant driver of price variations.
For instance, states with high housing costs, such as those in major metropolitan areas or popular coastal regions, tend to have higher RPPs. This means that a dollar in these states will purchase fewer goods and services compared to a dollar in a state with a lower cost of living. Conversely, states with more affordable housing markets will generally have lower RPPs.
The BEA also releases metropolitan area RPP statistics, offering even more localized insights into price differentials. These detailed RPPs are crucial for understanding the nuances of consumer purchasing power within different urban and rural settings.
Housing’s Dominant Role in Price Disparities
The BEA’s emphasis on housing rents as a primary driver of RPP differences is consistent with broader economic observations. Housing costs represent a significant portion of household budgets, and the dramatic variations in real estate values and rental markets across the United States directly impact the cost of living. States with high demand for housing, limited supply, or significant investment in real estate often see RPPs elevated due to these costs. Conversely, regions with ample land and lower demand typically experience more affordable housing, leading to lower RPPs.
Revisions and Data Updates
This release also includes significant revisions to annual estimates of real PCE and real personal income by state, dating back to 2008. These revisions incorporate newly available and updated source data, ensuring greater accuracy and completeness. This aligns the state-level data with the broader annual updates of the National Income and Product Accounts (NIPAs) and gross domestic product (GDP) by industry statistics, which were released on September 25, 2025, and GDP, personal income, and PCE by state statistics released on September 26, 2025.
Furthermore, the BEA has released new estimates for real per capita PCE and real per capita personal income for 2024. These per capita figures are calculated using population data from the U.S. Census Bureau, providing an average measure of economic well-being per person. The data for 2020 through 2024 has been updated with the latest population estimates.
Changes in Data Presentation and Discontinuation of Metropolitan Area Statistics
A notable change accompanying this release is the discontinuation of publication for statistics specifically for metropolitan statistical areas and their metropolitan and nonmetropolitan portions. While real PCE and real personal income will continue to be published at the state level, and RPPs will still be available for states and local areas, the granular breakdown for individual metropolitan areas within states is being phased out. The BEA cites efficiency and a focus on providing the most comprehensive data through its online Interactive Data Application as reasons for this shift. Users seeking detailed metropolitan-level data are encouraged to utilize the BEA’s online tools, which offer customizable tables downloadable in various formats.
The presentation of tables within the news release has also been updated. Data previously presented in static tables within the news release is now directly accessible through links to the BEA’s Interactive Data Application. This move aims to reduce duplication and enhance user experience by directing users to a more dynamic and flexible platform for data exploration. These online tables provide full time series and can be customized and downloaded.
Broader Economic Implications and Future Outlook
The data released today offers a snapshot of the U.S. economy at a critical juncture. The divergence in growth rates across states underscores the complex and varied economic conditions that individuals and businesses are navigating. For policymakers, these statistics provide essential information for understanding regional economic disparities and formulating targeted interventions.
For consumers, the interplay between income growth, inflation, and the cost of living, as illuminated by the RPP data, directly impacts their purchasing power and financial well-being. A strong increase in nominal income might be significantly diminished if the cost of goods and services, particularly housing, rises at a comparable or faster rate.
The BEA’s commitment to revising and updating its data ensures that economic analysis remains as accurate and relevant as possible. The upcoming release on December 10, 2026, which will supersede the 2024 data with the 2025 figures, will provide further insights into the evolving economic landscape. The ongoing availability of historical data through the BEA’s Data Archive ensures that researchers and analysts can track long-term trends and understand the cyclical nature of economic performance at the state level.
The discontinuation of metropolitan area-specific data, while a shift in presentation, reflects the BEA’s strategic focus on leveraging digital platforms for data dissemination. This move is expected to streamline access to comprehensive datasets for users who are adept at navigating online tools.
In conclusion, the 2024 state-level economic data from the BEA provides a vital resource for understanding the diverse economic realities across the United States. The detailed insights into consumer spending, personal income, and price levels offer a nuanced perspective on economic growth, inflation, and regional disparities, informing both policy decisions and individual financial planning.