Lana Rhoades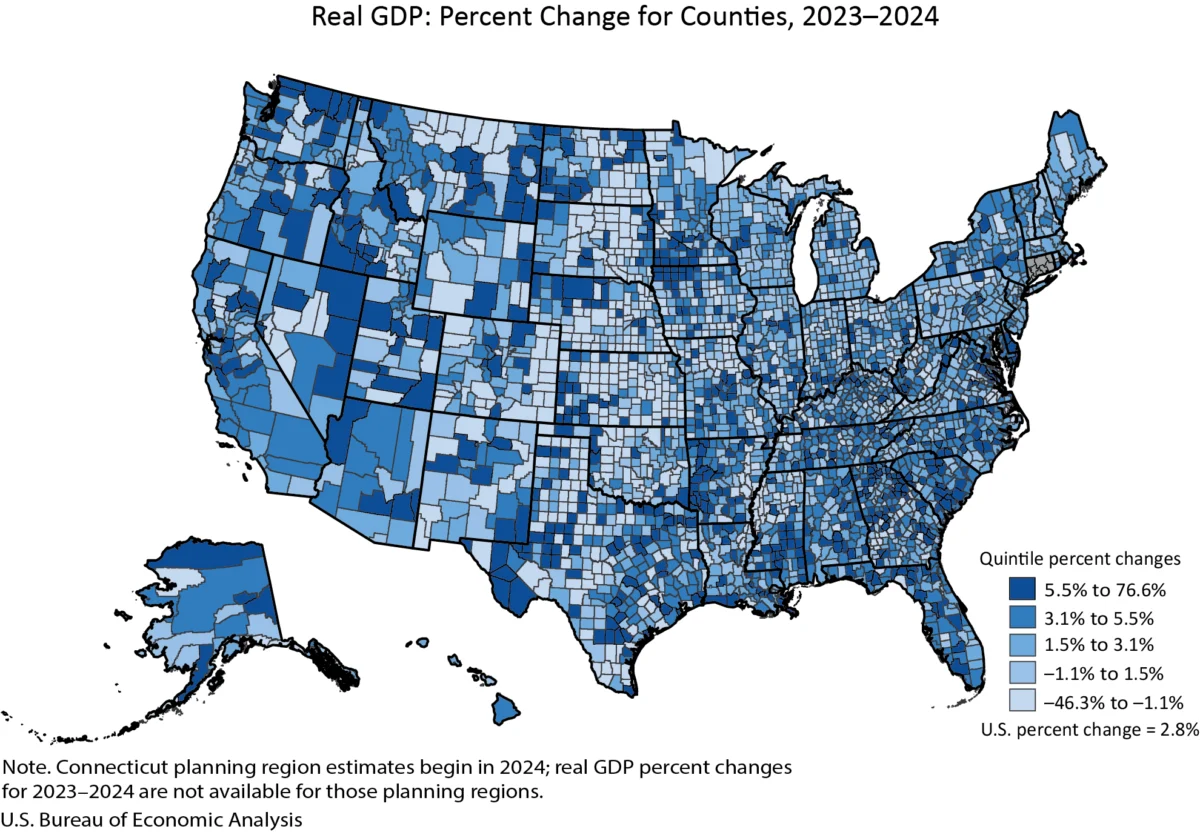
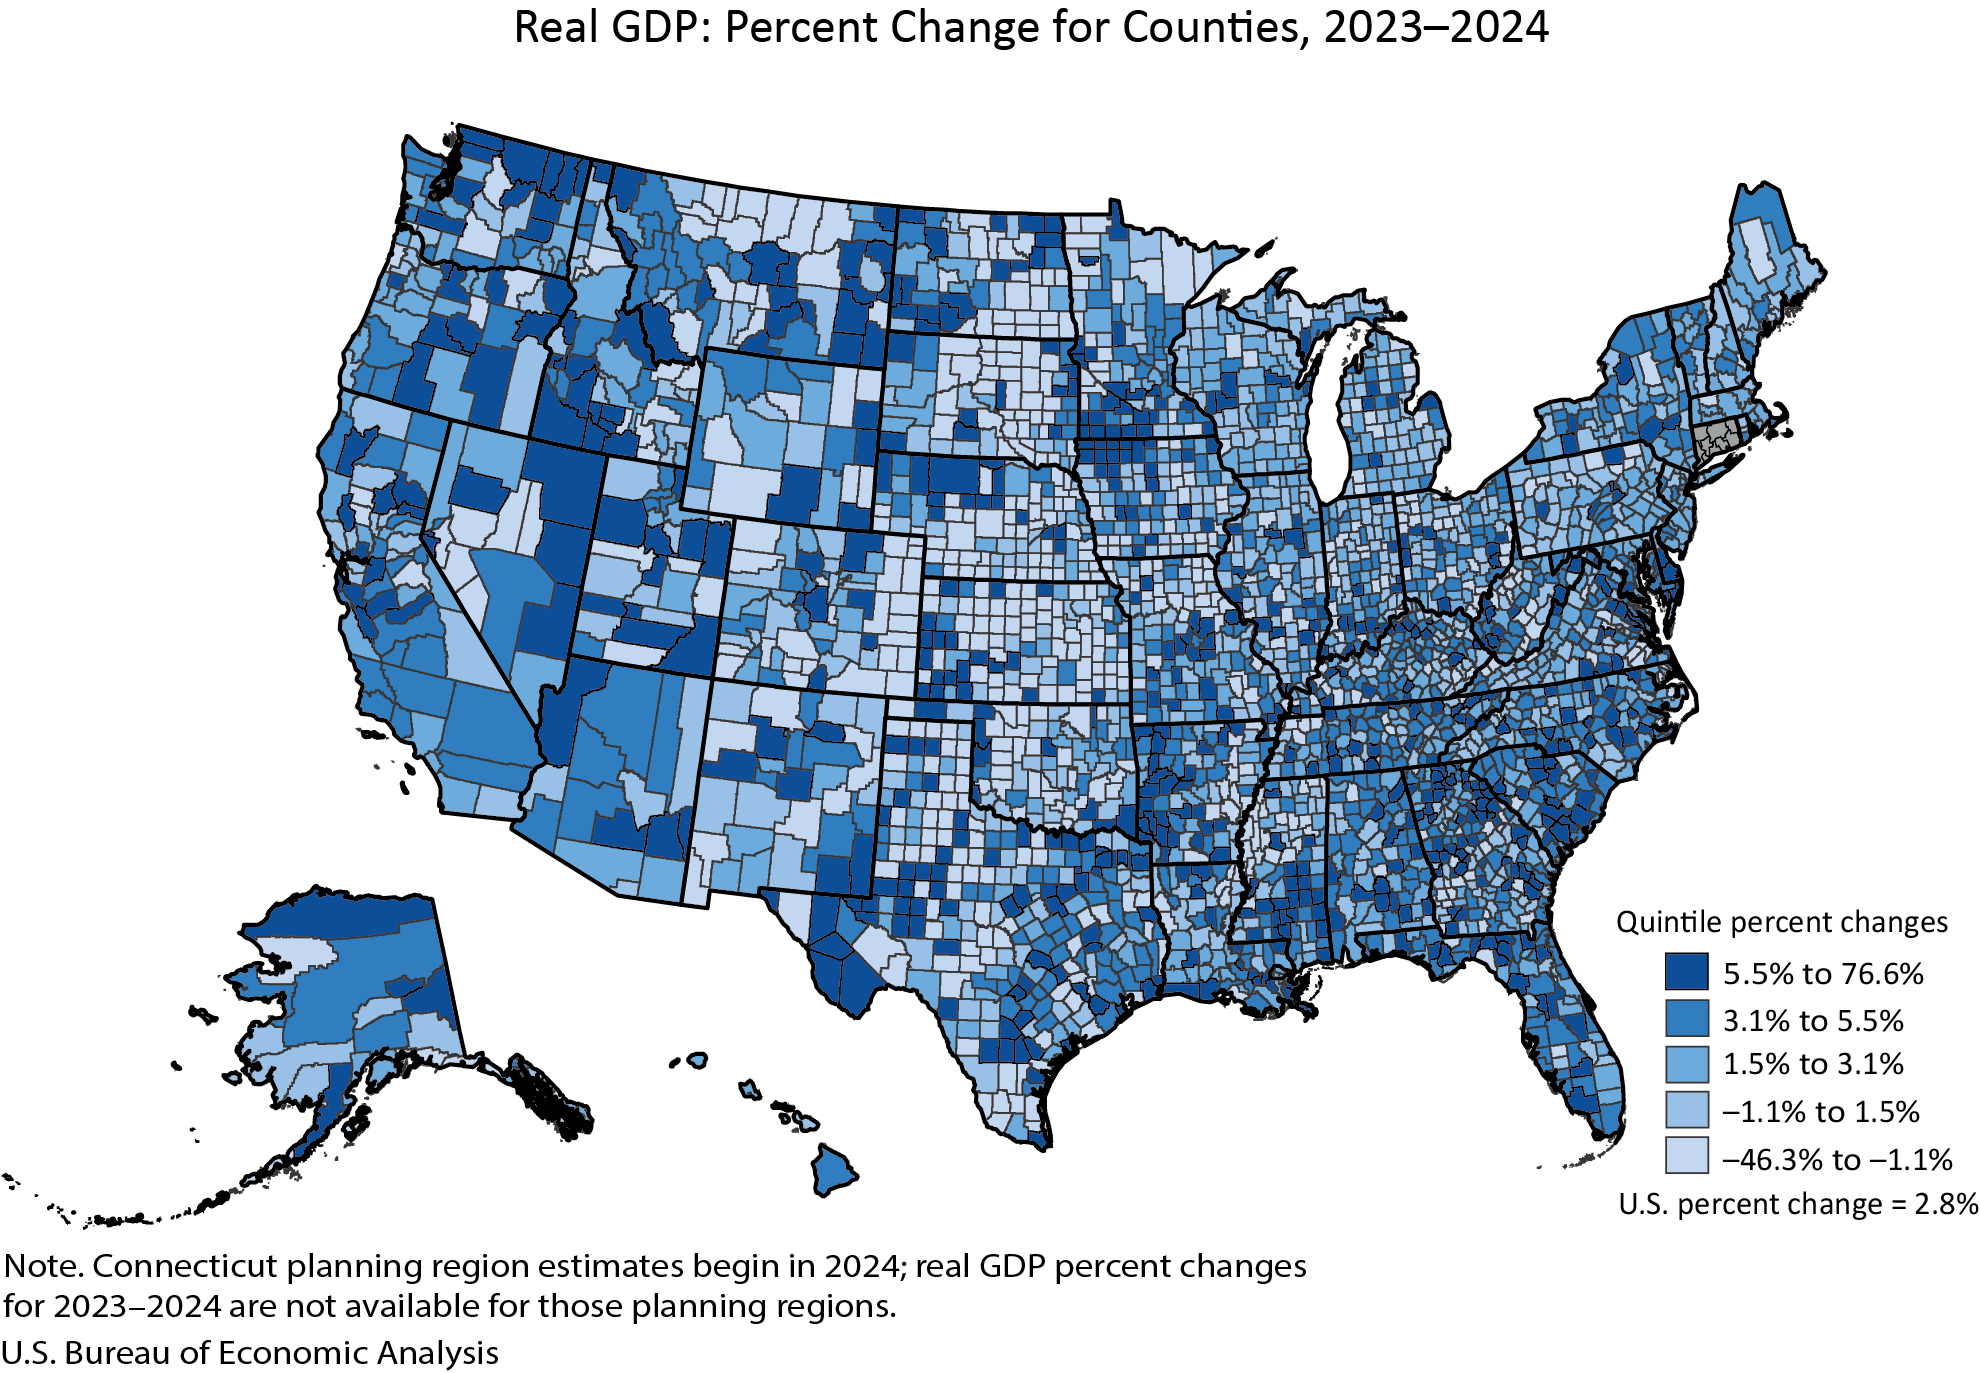
The economic landscape of the United States in 2024 presented a complex and varied picture at the county level, with a significant majority of counties experiencing growth in real Gross Domestic Product (GDP), while personal income saw an even broader increase across local economies. According to the latest estimates released by the U.S. Bureau of Economic Analysis (BEA), 2,273 counties recorded an increase in real GDP, compared to 809 counties where it declined and 24 that remained unchanged. This data, a critical indicator of the economic output of a region, paints a nuanced portrait of recovery and localized economic shifts following periods of national economic recalibration.
The disparities in economic performance are stark, highlighting the uneven nature of growth across the nation. The BEA’s comprehensive county-level data reveals that the percent change in real GDP ranged dramatically from a remarkable 76.6 percent surge in Carter County, Montana, to a substantial 46.3 percent contraction in Baca County, Colorado. These outliers underscore the localized factors – such as industry-specific booms or busts, natural resource fluctuations, or demographic shifts – that significantly influence economic vitality at the sub-state level. The accompanying map visually represents this divergence, with clusters of growth and decline visible across different regions of the country.
Understanding County-Level Economic Metrics
Real GDP, the inflation-adjusted value of all goods and services produced within a county, serves as a primary measure of its economic size and output. The BEA’s release for 2024 offers a granular view of these economic engines. In terms of absolute economic scale, the disparities are equally profound. New York County, New York, a global financial hub, boasted the largest real GDP at $813.7 billion. In stark contrast, Issaquena County, Mississippi, a rural county with a significantly smaller population and economic base, registered a real GDP of just $15.7 million. This vast difference in economic magnitude between counties emphasizes the varied economic structures and opportunities present throughout the United States.
Economic Trends Across County Size Classifications
The BEA’s analysis further segments economic performance by county population size, providing crucial insights into how different types of communities are faring. This breakdown reveals distinct patterns and challenges faced by large metropolitan areas, mid-sized urban centers, and smaller, often rural, communities.
Large Counties (Population > 500,000)
In 2024, large counties, those with populations exceeding 500,000, showed a robust trend. Of these, 145 counties experienced real GDP growth, while none registered a decline, and only one reported no appreciable change. The range of growth within this group was considerable, with Pinal County, Arizona, leading at a 10.7 percent increase. Johnson County, Kansas, represented the upper end of the spectrum for this category with a 0.0 percent change, indicating stability. The economic powerhouses within this group are exemplified by New York County, NY, with its staggering $813.7 billion GDP, and Pinal County, AZ, which, despite its significant growth, had a real GDP of $12.7 billion, demonstrating a wide range of economic scales even within this populous category.
Medium Counties (Population 100,000 to 500,000)
Medium-sized counties, defined as those with populations between 100,000 and 500,000, also demonstrated a generally positive economic trajectory. The data indicates that 451 of these counties saw their real GDP increase, while 20 experienced a decline, and 3 remained unchanged. Jefferson County, Texas, reported the highest growth rate at 12.4 percent. On the other end of the spectrum, Black Hawk County, Iowa, saw a decline of 2.6 percent. The economic scale of these counties varies, with Mercer County, New Jersey, holding a substantial $46.6 billion GDP, and Liberty County, Texas, representing a smaller, yet still significant, economic footprint at $2.6 billion.
Small Counties (Population < 100,000)
Small counties, those with populations under 100,000, presented the most varied economic performance. This category encompasses a vast number of counties, and thus a wider range of outcomes. A total of 1,677 small counties experienced real GDP growth, but this was counterbalanced by 789 counties reporting a decline and 20 showing no significant change. This segment of the economy is home to the most extreme fluctuations. As noted earlier, Carter County, Montana, led the nation with a 76.6 percent GDP increase, while Baca County, Colorado, experienced the steepest decline at 46.3 percent. The economic size of small counties also spans a wide spectrum, from Martin County, Texas, with a $15.1 billion GDP, to the aforementioned Issaquena County, Mississippi, with its $15.7 million GDP. This highlights the significant influence of specific industries or local economic drivers in these smaller communities.
Personal Income Trends Show Broad-Based Gains
While GDP measures the production of goods and services, personal income offers a perspective on the earnings of individuals within a county. In 2024, personal income showed an even more widespread pattern of growth than GDP. A total of 2,768 counties saw an increase in personal income, with only 331 experiencing a decrease and 7 remaining unchanged. This indicates that, on average, individuals across a larger swath of the country saw their earnings rise.
The percent change in personal income ranged from a healthy 22.6 percent increase in Harding County, South Dakota, to a notable 23.3 percent decline in Issaquena County, Mississippi. The latter county appears consistently at the lower end of economic performance metrics across both GDP and personal income, underscoring significant local economic challenges.
Levels of Personal Income Across Counties
Similar to GDP, personal income levels vary considerably by county. Los Angeles County, California, a massive economic and demographic center, reported the highest total personal income at $818.5 billion. At the other end of the scale, Loving County, Texas, a small, oil-rich county, had a personal income of $10.6 million. These figures reflect the diverse economic opportunities and earning potentials available to residents across the United States.
Personal Income by County Size Classification
The BEA’s analysis by population size also provides insights into personal income trends:
Large Counties (Population > 500,000)
In large counties, 146 reported an increase in personal income, with no declines or unchanged figures noted. San Joaquin County, California, experienced the highest growth at 9.7 percent, while Philadelphia County, Pennsylvania, saw a 2.7 percent increase. The economic scale is immense, with Los Angeles County, CA, leading at $818.5 billion and Pinal County, AZ, at $26.1 billion.
Medium Counties (Population 100,000 to 500,000)
Medium counties exhibited strong personal income growth, with 474 counties reporting increases. Merced County, California, saw a substantial 10.9 percent rise, and Genesee County, Michigan, reported 1.6 percent growth. Collier County, Florida, stands out with a $62.5 billion personal income, while Floyd County, Georgia, represents a smaller scale at $4.9 billion.
Small Counties (Population < 100,000)
Small counties, while diverse, also showed significant personal income gains, with 2,148 counties experiencing growth. Harding County, South Dakota, recorded the highest percentage increase at 22.6 percent. Conversely, Issaquena County, Mississippi, faced a significant decline of 23.3 percent. Teton County, Wyoming, demonstrated a substantial personal income of $12.4 billion, contrasting with Loving County, Texas, at $10.6 million.
Methodological Updates and Data Revisions
This latest release from the BEA incorporates significant updates and revisions to county-level economic statistics. The estimates for 2024 are based on the BEA’s annual updates to GDP and personal income by county, which also include revised data for the years 2020 through 2023. These revisions are crucial for ensuring the accuracy and completeness of the data, as they integrate new and improved source information. The updates align county data with broader national economic accounts, including the National Income and Product Accounts (NIPA) and state-level GDP and personal income statistics, which were released in late September 2025. This coordinated approach enhances the consistency and comparability of economic data across different levels of government reporting.
A notable change in the presentation of data for Connecticut is the adoption of its planning region geographic definitions, replacing traditional county boundaries. This shift, specific to Connecticut’s 2024 estimates, means that percentage change calculations for this state do not appear in the national trend ranges provided in the release, as comparable county-level historical data is not available for these new regions.
Furthermore, the BEA utilized U.S. Census Bureau population figures to calculate per capita personal income estimates for the period from 2020 through 2024, providing an essential metric for understanding income levels relative to population size.
Innovations in Data Dissemination
In a significant move towards greater efficiency and a more holistic presentation of economic data, the BEA has consolidated its county-level releases. For the first time, annual GDP and personal income by county are published in a single, combined news release. This initiative aims to provide a more comprehensive overview of county economies and replaces the previous practice of issuing two separate news releases on different dates. This unified approach simplifies data access for users and offers a clearer, more integrated picture of local economic conditions.
Discontinuation of Metropolitan Area Statistics
Concurrently with the enhanced focus on county-level data, the BEA has announced the discontinuation of publication for statistics related to metropolitan statistical areas (MSAs), micropolitan statistical areas, metropolitan divisions, combined statistical areas (CSAs), and their metropolitan and nonmetropolitan portions. This decision, effective with the 2024 county statistics release, means that GDP and personal income estimates will now be exclusively published by county. This strategic shift underscores the BEA’s commitment to providing the most granular and relevant economic data, with counties serving as the primary geographic unit of analysis. Users seeking information on metropolitan areas are directed to a frequently asked questions (FAQ) document for further clarification.
Evolution of Data Presentation: Interactive Tables
In line with modern data accessibility trends, the BEA has transitioned its presentation of detailed statistical tables. These tables, previously embedded within news releases, are now exclusively available through the BEA’s online Interactive Data Application. This change aims to reduce duplication, enhance efficiency, and direct users to the most comprehensive and flexible data resources. The interactive platform allows for customization, access to full time series, and the ability to download data in various formats, including PDF, Excel, and CSV. Users can access these detailed tables, including GDP and personal income summaries by county, through direct links provided within the news release, ensuring they are directed to the most up-to-date and customizable datasets.
Future Releases and Data Archiving
The BEA has also outlined its schedule for future data releases. The next update for GDP and personal income by county is scheduled for December 2, 2026, at 8:30 a.m. EST, covering the 2025 data. Following this release, the 2024 data will be superseded and archived. The original data featured in the 2024 release will then be accessible through BEA’s Data Archive, ensuring historical data remains available for research and analysis. This practice ensures that users always have access to the most current official statistics while maintaining a comprehensive record of past economic data.
The BEA’s commitment to providing detailed and accessible economic data at the county level continues to be a cornerstone of its mission, offering invaluable insights for policymakers, researchers, businesses, and the public alike as they navigate the evolving economic landscape of the United States. The divergence in GDP and personal income trends across counties in 2024 highlights the multifaceted nature of economic growth and the critical importance of localized data analysis.