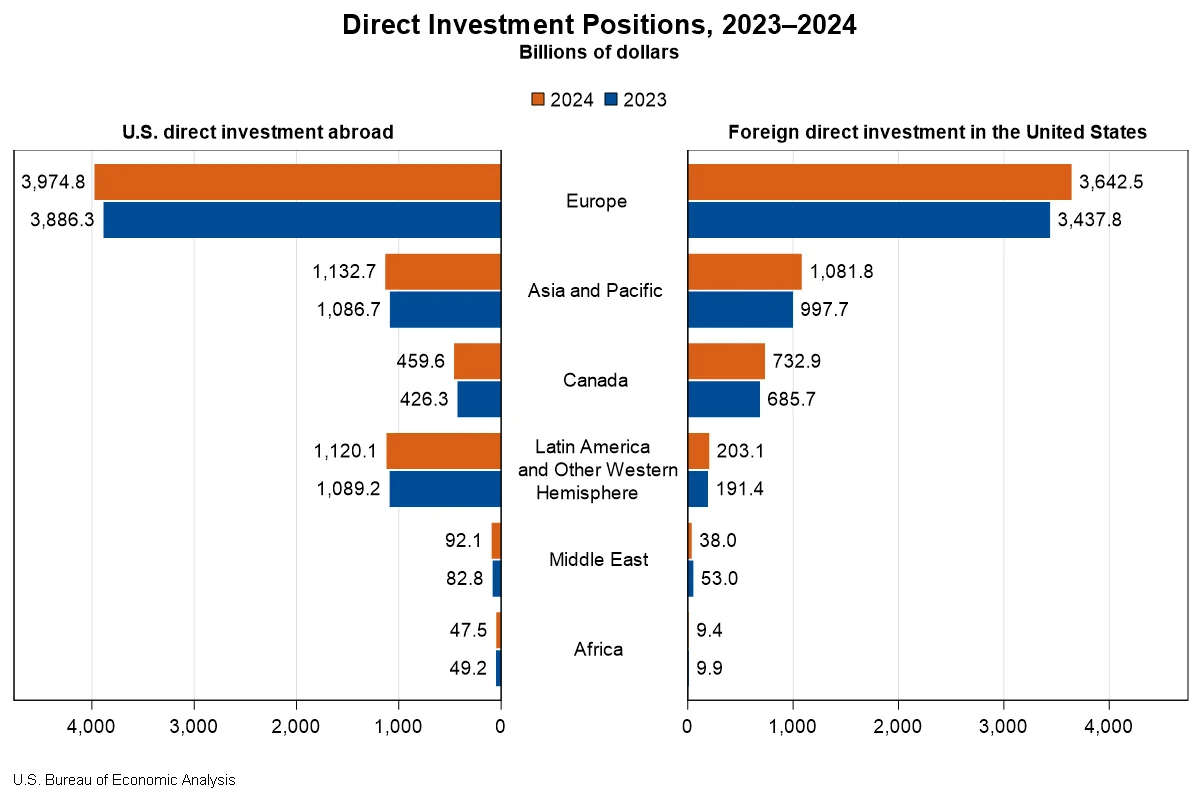
The cumulative level of U.S. direct investment abroad, a key indicator of American economic engagement with the global marketplace, experienced a substantial increase of $206.3 billion, reaching a new high of $6.83 trillion by the close of 2024. This growth, as detailed in statistics released by the U.S. Bureau of Economic Analysis (BEA), was notably propelled by a $88.4 billion expansion in investment within Europe, with Luxembourg and Germany emerging as primary destinations for these U.S. capital outflows. Manufacturing affiliates, particularly those involved in the production of computers and electronic products, spearheaded the surge in this sector.
Concurrently, foreign direct investment (FDI) within the United States also demonstrated robust momentum, with its cumulative position climbing by $332.1 billion to $5.71 trillion at the end of 2024. Europe was once again a significant contributor to this inflow, accounting for an $204.7 billion increase. Within Europe, the United Kingdom and Germany were prominent, with the former contributing a $52.9 billion rise and the latter adding $39.7 billion to the U.S. FDI stock. The manufacturing sector in the United States also saw the most substantial gains in foreign investment, underscoring its continued importance as a magnet for international capital.
A Deeper Dive into Global Capital Flows
These figures from the BEA paint a dynamic picture of international economic interconnectedness, illustrating the ongoing flow of capital across borders. The U.S. direct investment abroad position represents the cumulative value of foreign direct investment in enterprises abroad that are owned or controlled by U.S. persons. Conversely, the foreign direct investment in the United States position reflects the cumulative value of direct investment in the U.S. by foreign persons.
U.S. Direct Investment Abroad: Key Destinations and Industries
American multinational enterprises (MNEs) maintain a broad global footprint, with investments extending to nearly every nation. However, a significant portion of the total U.S. direct investment abroad is concentrated in a select few countries. At the close of 2024, the United Kingdom held the top spot as the largest recipient of U.S. direct investment, with a substantial position of $1,024.6 billion. The Netherlands followed closely with $1,012.0 billion, and Luxembourg registered $569.6 billion. Rounding out the top five were Singapore ($467.6 billion) and Ireland ($466.8 billion).
By industry, holding companies were the primary recipients of U.S. direct investment abroad, commanding 47.3 percent of the total position. Manufacturing affiliates secured the second-largest share at 16.0 percent, while finance and insurance affiliates accounted for 14.2 percent. When examining the investment by the industry of the U.S. parent company, manufacturing MNEs were the most significant investors, contributing 50.9 percent of the total position. This was followed by MNEs in the finance and insurance sector, which accounted for 15.1 percent.
The income generated from these overseas investments also saw a healthy uptick. In 2024, U.S. MNEs earned a total of $601.9 billion on their cumulative investments abroad, marking a 3.8 percent increase from the previous year. The finance and insurance sector demonstrated particularly strong growth in income, with an increase of $12.0 billion, representing a significant 17.6 percent rise from 2023. This suggests a robust performance of U.S.-owned assets and operations in key global financial markets.
Foreign Direct Investment in the United States: Leading Investors and Sectors
The United States continues to be an attractive destination for foreign capital. By country of the foreign parent, four nations accounted for over half of the total FDI position in the U.S. at the end of 2024. Japan led the pack as the top investing country, with a substantial position of $754.1 billion. The United Kingdom followed with $742.7 billion, trailed by Canada at $732.9 billion, and the Netherlands at $726.4 billion.
When considering the ultimate beneficial owner (UBO) – the entity at the apex of the global ownership chain – Japan remained the leading investing country with a position of $819.2 billion. Canada secured the second spot with $811.7 billion, and Germany ranked third with $677.3 billion. Notably, the UBO data revealed that investment from the Netherlands and Luxembourg, when viewed through the lens of ultimate ownership, was considerably lower than when assessed by the country of the foreign parent. This indicates that a significant portion of investment channeled through these European nations ultimately originates from investors in other countries, highlighting complex international investment structures.
The U.S. manufacturing sector was a primary beneficiary of foreign direct investment, attracting 42.3 percent of the total FDI position. The $2.42 trillion investment in U.S. manufacturing was significantly driven by chemical manufacturing, which alone accounted for a third of this total, or $827.5 billion. Other key sectors drawing substantial foreign investment included finance and insurance ($599.4 billion) and wholesale trade ($520.5 billion).
Foreign MNEs generated considerable income from their U.S. investments, earning $310.9 billion in 2024. This represented a significant 13.1 percent increase compared to 2023, signaling a strong return on foreign capital deployed within the American economy.
Revisions and Data Continuity
The BEA also provided updated figures for previous years, reflecting the incorporation of newly available and revised source data. For 2022, the U.S. direct investment abroad position was revised to $6,245 billion from a previously published $6,313 billion. Similarly, the foreign direct investment in the United States for 2022 was revised to $5,124 billion from $5,167 billion. For 2023, U.S. direct investment abroad was revised to $6,620 billion from $6,676 billion, and foreign direct investment in the United States was revised to $5,376 billion from $5,394 billion. These revisions underscore the dynamic nature of economic data collection and the BEA’s commitment to providing the most accurate statistics.
Accessing Detailed Data
The BEA has transitioned to providing detailed data tables through its Interactive Data Application and supplemental data tables, rather than including them directly in the news release. This approach allows for greater accessibility and user-driven analysis of the extensive datasets. Specific tables are available for U.S. direct investment abroad and foreign direct investment in the United States, offering granular insights into country and industry breakdowns, financial transactions, and income flows.
These detailed tables are crucial for researchers, policymakers, and businesses seeking to understand the nuances of international investment patterns. For instance, the "Position on a Historical-Cost Basis, Country by Industry of Foreign Affiliate" table for U.S. direct investment abroad provides a comprehensive view of where and in what sectors U.S. companies are deploying their capital globally. Similarly, the "Position on a Historical-Cost Basis, Country by Industry of U.S. Affiliate" for FDI in the U.S. details the landscape of foreign investment within the American economy.
The BEA also offers data categorized by the "Ultimate Beneficial Owner" (UBO), which provides a more accurate picture of the true origin of investment by tracing ownership structures to their ultimate source. This is particularly important in understanding the flow of capital through intermediary countries and identifying the ultimate drivers of global investment.
Broader Economic Implications
The reported increases in both U.S. direct investment abroad and foreign direct investment in the United States signify a healthy and active global economic environment in 2024. For the United States, strong FDI inflows contribute to job creation, technological advancement, and overall economic growth. Foreign companies establishing or expanding operations within the U.S. often bring new technologies, management expertise, and access to international markets.
Conversely, the robust U.S. direct investment abroad reflects the competitiveness and global reach of American corporations. These investments can lead to increased efficiency, access to new markets and resources, and higher returns for U.S. investors, which can ultimately benefit the U.S. economy through repatriated profits and enhanced corporate valuations.
The prominence of manufacturing in both inbound and outbound investment flows underscores its continued importance in the global economy, even amidst discussions of reshoring and supply chain diversification. The significant role of financial and insurance sectors highlights their interconnectedness with global capital markets and their function as conduits for investment.
The BEA’s commitment to data revision and the provision of detailed, accessible data tables are vital for informed economic analysis and policy-making. As global economic conditions continue to evolve, tracking these direct investment flows remains essential for understanding the intricate web of international commerce and its impact on national economies. The data released for 2024 provides a snapshot of a vibrant global investment landscape, characterized by significant cross-border capital movement and a continued reliance on key sectors and geographic regions for both outward and inward investment.