

The United States experienced a widening of its goods and services deficit in February, reaching $57.3 billion, an increase of $2.7 billion from the revised January figure of $54.7 billion. This latest report from the U.S. Census Bureau and the U.S. Bureau of Economic Analysis indicates a shift in the nation’s trade balance, driven by a more substantial rise in import values compared to export growth during the month.
February Trade Dynamics: A Closer Look at the Numbers
In February, U.S. exports of goods and services totaled $314.8 billion, marking an increase of $12.6 billion from the previous month. This positive momentum in exports was, however, outpaced by a more significant surge in imports. Imports of goods and services climbed to $372.1 billion in February, an increase of $15.2 billion from January. This divergence in growth rates directly contributed to the larger trade deficit.
Breaking down the components of the deficit, the goods deficit saw a notable expansion, growing by $2.5 billion to reach $84.6 billion. Conversely, the surplus in services narrowed slightly, decreasing by $0.2 billion to $27.3 billion. This suggests that the primary driver of the overall deficit increase was the trade balance in goods.
The data also provides a look at the real goods deficit, adjusted for inflation and measured in 2017 dollars. On a Census basis, the real goods deficit increased by $0.5 billion, or 0.6 percent, to $83.5 billion in February. This contrasts with a larger 3.2 percent increase in the nominal goods deficit, suggesting that while the value of goods traded increased, a portion of that rise was due to price changes rather than a greater volume of goods.
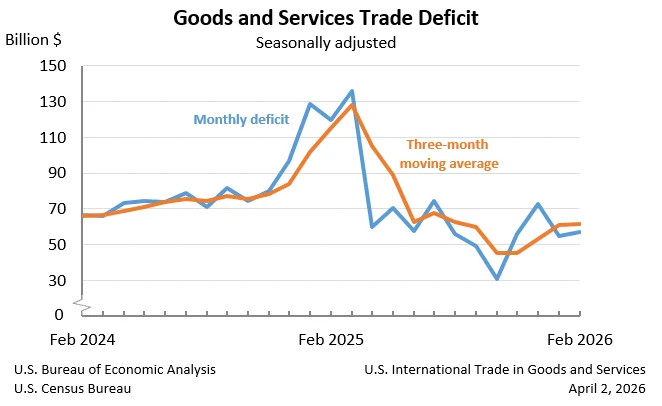
Three-Month Moving Averages Show Persistent Deficit
Examining trade flows through a three-month moving average provides a smoother perspective, mitigating the impact of short-term fluctuations. For the three months ending in February, the average goods and services deficit rose to $61.6 billion, an increase of $0.4 billion. This indicates a sustained, albeit modest, expansion in the deficit when viewed over a slightly longer period.
Year-over-year, the trend for the three-month average deficit shows a significant improvement. For the three months ending in February 2026, the average deficit decreased by $53.4 billion compared to the same period in 2025. This substantial reduction in the year-over-year average deficit is a key takeaway, suggesting that despite the monthly uptick, the broader trade picture has seen considerable improvement over the past year.
Export Performance: Broad-Based Growth Across Goods and Services
Exports of goods demonstrated robust growth in February, increasing by $11.5 billion to reach $206.9 billion. This growth was reported on a Census basis, with net balance of payments adjustments contributing less than $0.1 billion to this figure. The increase in goods exports reflects the overall demand for American-made products in international markets.
In parallel, exports of services also exhibited positive momentum, rising by $1.1 billion to $107.9 billion in February. This indicates continued strength in sectors such as travel, transportation, financial services, and intellectual property. The combined growth in both goods and services exports underscores a healthy demand for U.S. offerings abroad.
Import Surge: Demand for Foreign Goods and Services
The substantial increase in imports in February was driven by both goods and services. Imports of goods climbed by $14.0 billion to $291.5 billion. On a Census basis, imports of goods increased by $14.1 billion, with net balance of payments adjustments showing a slight decrease of $0.1 billion. This surge in goods imports points to strong domestic demand for a variety of foreign-produced items.
Imports of services also saw an increase, growing by $1.3 billion to $80.6 billion in February. This suggests a rise in spending by U.S. residents on foreign services, such as international travel and other service-related expenditures abroad.
Trade Balance by Country: Mixed Performance
The monthly report also provides a snapshot of the U.S. trade balance with key trading partners. In February, the United States recorded trade surpluses with a number of countries, including Switzerland ($7.8 billion), the Netherlands ($6.8 billion), Hong Kong ($6.6 billion), the United Kingdom ($5.6 billion), and South and Central America ($3.8 billion). Surpluses were also noted with Singapore ($2.9 billion), Brazil ($1.4 billion), Australia ($0.9 billion), Belgium ($0.8 billion), and Saudi Arabia ($0.2 billion).
Conversely, significant deficits were registered with several major economies. Taiwan led the list with a deficit of $21.1 billion, followed by Mexico ($16.8 billion), Vietnam ($16.5 billion), China ($13.1 billion), and South Korea ($7.6 billion). The European Union as a whole represented a deficit of $5.1 billion. Other countries with notable deficits included Japan ($4.7 billion), Malaysia ($4.0 billion), India ($3.5 billion), Germany ($3.3 billion), Ireland ($2.8 billion), France ($2.2 billion), Italy ($1.8 billion), Israel ($0.8 billion), and Canada ($0.7 billion). This breakdown highlights the complex web of trade relationships and the varying economic dynamics at play.
Background and Context: The Role of Trade in the U.S. Economy
The U.S. international trade in goods and services is a critical component of the nation’s economic activity. The balance of trade, represented by the difference between exports and imports, offers insights into the flow of capital and goods across borders. A deficit indicates that a country is importing more than it is exporting, which can have implications for domestic industries, employment, and the national debt. Conversely, a surplus suggests that a country is exporting more than it is importing, potentially leading to economic growth and job creation.
The U.S. has historically experienced a goods deficit, often offset by a services surplus. However, the overall trade balance is a dynamic figure, influenced by a multitude of factors including global economic conditions, exchange rates, trade policies, and domestic consumer demand. Fluctuations in the trade deficit are closely watched by policymakers, economists, and businesses as indicators of economic health and competitiveness.
Looking Ahead: Upcoming Revisions and Data Releases
The U.S. Census Bureau and the Bureau of Economic Analysis regularly update their trade statistics to ensure accuracy and reflect evolving economic landscapes. A significant update is scheduled for June 9, 2026, with the release of the "U.S. International Trade in Goods and Services" report (FT-900) and its accompanying Annual Revision. This update will incorporate revisions to trade in goods, on both Census and balance of payments (BOP) bases, dating back to 2021. Additionally, trade in services data will be revised beginning with 1999.
These revised statistics will also be integrated into other key BEA reports, including the "U.S. International Transactions and Investment Position, 1st Quarter 2026 and Annual Update," to be released by BEA on June 24, 2026. A preview of BEA’s 2026 annual update of the International Transactions Accounts is expected to be available in the Survey of Current Business later in April 2026. These comprehensive revisions are crucial for maintaining the integrity and comparability of trade data over time.
The next release of the U.S. International Trade in Goods and Services report, covering March 2026 data, is scheduled for May 5, 2026. This upcoming report will provide further insights into the evolving trade landscape.
Broader Economic Implications and Analysis
The widening of the trade deficit in February, while a monthly concern, should be viewed within the context of broader economic trends. The year-to-date data, which shows a substantial decrease in the goods and services deficit, suggests that the longer-term trajectory might be more positive. The reported year-to-date decrease of $136.1 billion, or 54.8 percent, from the same period in 2025, driven by a significant increase in exports and a decrease in imports, paints a different picture than the single month’s figures. This indicates that the February data might represent a temporary deviation rather than a sustained shift in the overall trade balance.
Economists often analyze trade deficits in conjunction with other economic indicators, such as GDP growth, inflation, and consumer spending. A widening deficit can, in some circumstances, signal robust domestic demand that outstrips domestic production, leading to increased imports. However, if driven by a decline in exports or an unsustainable increase in borrowing to finance imports, it can raise concerns about economic competitiveness and long-term financial stability.
The specific drivers of the February increase – the rise in the goods deficit and the slight decrease in the services surplus – warrant continued monitoring. The strength of U.S. manufacturing and its ability to compete internationally, as well as the ongoing demand for U.S. services abroad, will be key factors shaping future trade balances.
The U.S. Census Bureau and the Bureau of Economic Analysis provide detailed data and analysis to support informed understanding of these complex economic relationships. For those seeking further information, the full release and supplementary data can be accessed via the provided links on their respective websites.


