Lana Rhoades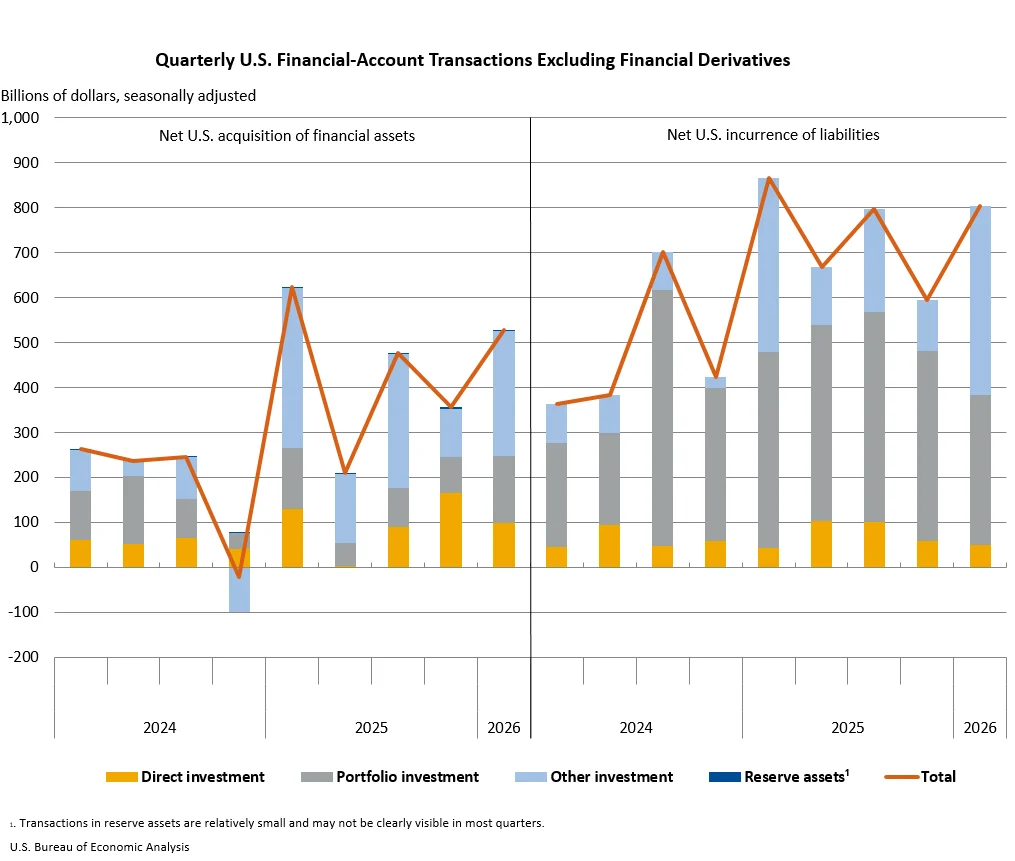
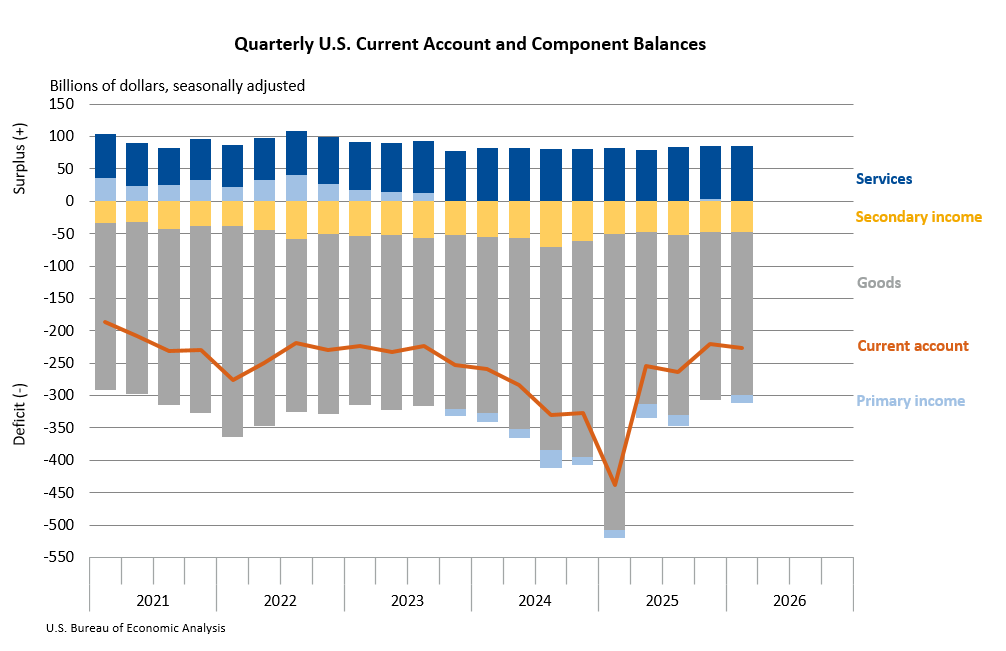
The U.S. current-account deficit, a key measure of a nation’s international economic transactions, expanded by $5.8 billion, or 2.6 percent, to reach $226.8 billion in the first quarter of 2026. This widening, detailed in statistics released by the U.S. Bureau of Economic Analysis (BEA), signals a notable shift in the nation’s balance with the rest of the world. The deficit was previously reported at $221.1 billion in the revised fourth quarter of 2025. This latest figure represents 2.9 percent of current-dollar gross domestic product (GDP), a slight uptick from the 2.8 percent recorded in the preceding quarter, underscoring the growing economic relationship between the U.S. and international markets.
The primary driver behind this expansion in the current-account deficit was a significant swing in the balance on primary income. After experiencing a surplus in the fourth quarter of 2025, this component of the current account moved into deficit territory in the first quarter of 2026. This shift was partially counterbalanced by a reduction in the deficit recorded for goods trade. The interplay between these factors highlights the dynamic nature of the U.S. economy’s engagement with global trade and investment flows.
Errata Clarification: Financial Transactions Data
It is important to note that a typographical error affected a single data point within the original release. Net financial transactions for the first quarter of 2026 were reported as -$209.0 billion. This figure was subsequently corrected on June 30, 2026, to accurately reflect a negative sign, indicating net borrowing by U.S. residents from foreign entities. This specific correction was confined to this single numerical value and did not impact the integrity of the overall analysis or other data points presented in the release. Crucially, the corrected figure was consistently available through the BEA’s Interactive Data Application and Application Programming Interface, ensuring that users with direct access to BEA’s data platforms were not affected by this minor discrepancy in the initial news release.
Deeper Dive into the First Quarter’s Economic Dynamics
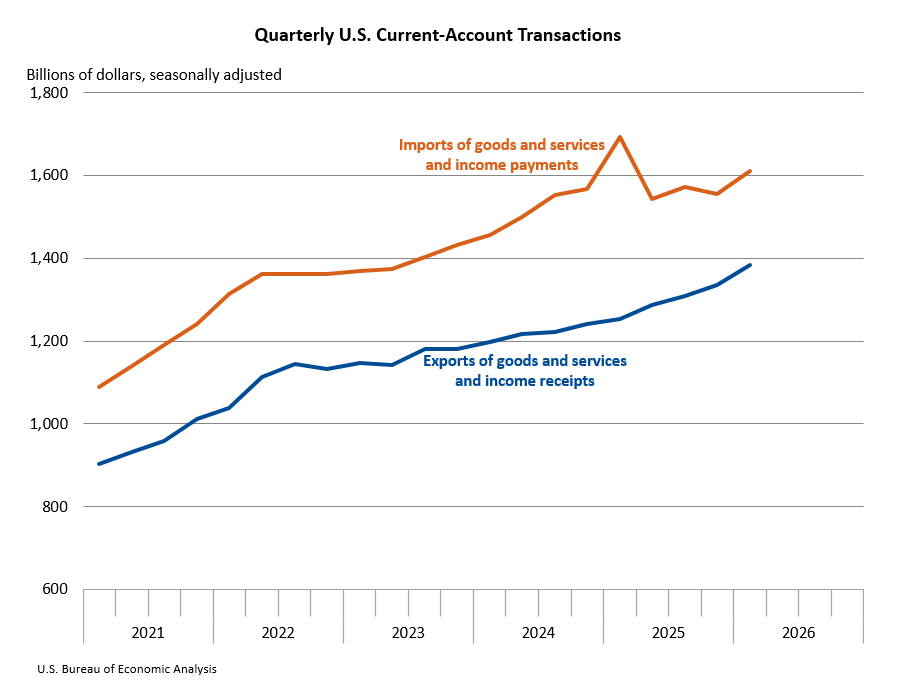
The widening of the current-account deficit in the first quarter of 2026 is a composite outcome of several interconnected international transactions. Exports of goods and services to, and income received from, foreign residents saw a notable increase of $50.0 billion, bringing the total to $1.38 trillion. This growth was primarily fueled by an expansion in goods exports. However, this positive trend was partially tempered by a decrease in primary (earned) income receipts from abroad.
Conversely, imports of goods and services from, and income paid to, foreign residents experienced a more substantial rise of $55.8 billion, reaching $1.61 trillion. This increase was driven by higher import volumes of goods and a parallel escalation in primary income payments made to foreign residents. The differential in the growth rates between exports and imports, particularly the more pronounced increase in imports and income outflows, directly contributed to the widening current-account deficit.
Shifts in Income and Trade Balances
The transition of the primary income balance from a surplus to a deficit is a critical development. Primary income includes earnings on foreign direct investment, portfolio investment, and other investments. A shift to a deficit in this category suggests that U.S. residents earned less income from their foreign assets or paid out more income on foreign-held assets within the U.S. than in the previous quarter. This could be influenced by various factors, including changes in corporate profitability abroad, shifts in interest rates, or fluctuations in dividend payments.
The simultaneous reduction in the deficit on goods trade provided a partial offset. This improvement in the goods balance could stem from a variety of factors, such as an increase in the value of U.S. goods exports relative to imports, or a decrease in the cost of imported goods. Understanding the specific components driving these changes in goods trade—whether it’s increased demand for U.S. manufactured goods or a decrease in the price of imported oil, for example—is crucial for a comprehensive economic assessment.
Capital Transfers and Financial Account Activity
Beyond the current account, capital-transfer receipts saw a significant increase of $3.3 billion, totaling $3.4 billion in the first quarter. Conversely, capital-transfer payments experienced a decrease of $0.9 billion, settling at $2.0 billion. Capital transfers represent a one-sided movement of assets without a corresponding return, such as foreign aid or inheritance. While these are not typically as large as current-account transactions, their movements can provide insights into specific international financial flows.
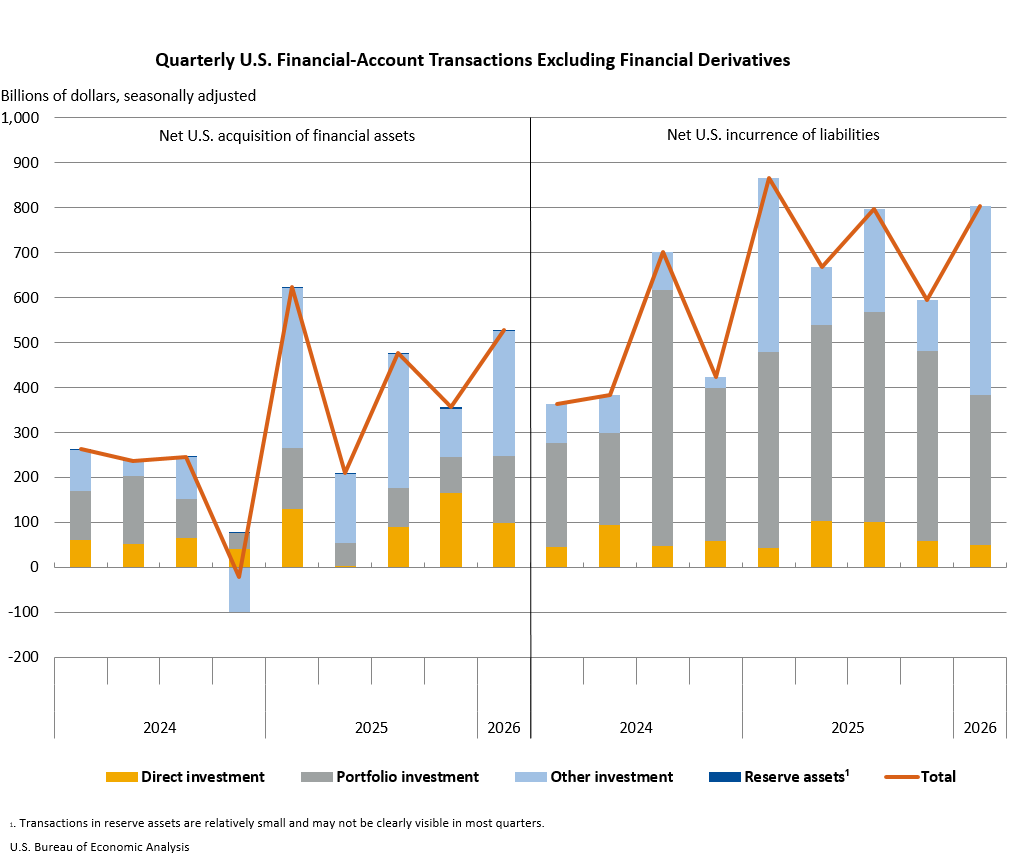
The net financial-account transactions for the first quarter of 2026 were recorded at -$209.0 billion. This figure signifies net U.S. borrowing from foreign residents, meaning that foreign entities invested more in the U.S. than U.S. residents invested abroad. During this period, U.S. residents increased their holdings of foreign financial assets by $527.3 billion. Simultaneously, U.S. liabilities to foreign residents, representing foreign investment in the U.S., increased by a larger margin of $803.7 billion. This imbalance in financial flows is a direct counterpart to the current-account deficit, as a country must finance its current-account deficit through borrowing or by selling assets.
U.S. Net International Investment Position at Quarter’s End
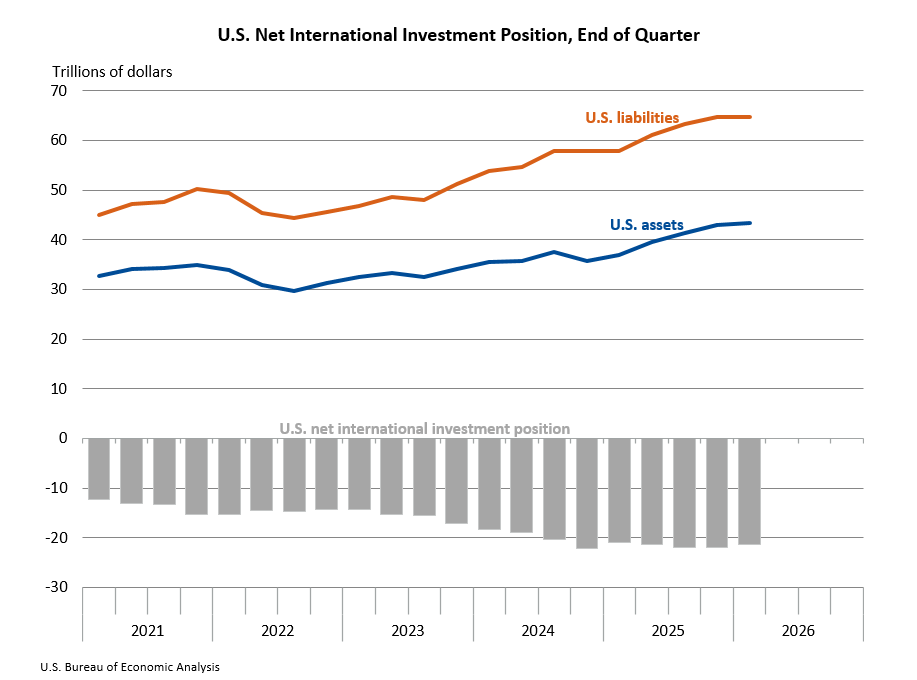
The U.S. net international investment position, which represents the difference between U.S. residents’ foreign financial assets and liabilities, stood at -$21.27 trillion at the close of the first quarter of 2026. This figure indicates that U.S. liabilities to foreigners exceeded its assets abroad by a substantial margin. U.S. assets abroad totaled $43.37 trillion, while liabilities to foreign residents amounted to $64.64 trillion. This position was a revision from the preliminary estimate of -$21.87 trillion at the end of the fourth quarter of 2025, suggesting a slight improvement in the net position due to valuation changes or shifts in asset and liability flows.
The composition of this net investment position is dynamic. U.S. assets abroad increased by $462.9 billion in the first quarter. This growth was broadly distributed across major investment categories, with the exception of direct investment. The financial transactions of $527.3 billion contributing to asset growth were significantly offset by unfavorable exchange-rate changes, which reduced the value of foreign assets by $357.1 billion when translated back into U.S. dollars.
Conversely, U.S. liabilities to foreign residents decreased by $140.4 billion during the first quarter. This decrease was primarily driven by a contraction in portfolio investment liabilities, although this was partially counteracted by increases in other major investment categories. The overall reduction in liabilities was predominantly influenced by significant price changes, which led to a decline in the value of foreign-held U.S. assets by $1.18 trillion. This was, in turn, partially offset by the $803.7 billion in financial transactions that increased U.S. liabilities.
Annual Updates and Data Revisions
The statistics released for the first quarter of 2026 are part of the BEA’s annual updates to the U.S. International Transactions Accounts (ITAs) and the International Investment Position (IIP) Accounts. These annual updates are critical for incorporating a broader range of source data, refining methodologies, and ensuring the accuracy and comprehensiveness of the nation’s international economic statistics.
The annual updates involve significant data integration from various sources, including surveys conducted by the BEA itself and data provided by other government agencies. For instance, the BEA’s benchmark and quarterly insurance services surveys, quarterly international services surveys, and benchmark, annual, and quarterly direct investment surveys all contribute to the data compilation, covering periods up to 2025. The U.S. Census Bureau provides revised source data for Census-basis goods, and the U.S. Department of the Treasury contributes data from annual, quarterly, and monthly portfolio and other investment surveys. These comprehensive data collection efforts allow for a more accurate reflection of complex international financial flows and positions.
These updates also incorporate recalculated seasonal and trading-day adjustments, beginning with statistics for 1999. This ensures that the data is presented in a manner that allows for meaningful comparisons over time by smoothing out predictable, short-term variations.
Timeline of Data Revisions and Future Releases
The BEA’s commitment to data accuracy is demonstrated through its regular revision cycles. The current release reflects the annual updates, with a preview of these changes available in the "Survey of Current Business." Further detailed analysis and updates will be published in the Survey of Current Business in July 2026. The comprehensive document "U.S. International Economic Accounts: Concepts and Methods" will also be updated in September 2026 to reflect these methodological enhancements.
The BEA also utilizes a revised disclosure avoidance method, employing techniques such as coarsening, rounding, and the use of ranges. This approach aims to publish a greater volume of data while maintaining the confidentiality of survey respondents, balancing transparency with privacy.
The next release of International Transactions and Investment Position statistics, covering the second quarter of 2026, is scheduled for September 24, 2026, at 8:30 a.m. EDT. Following this release, the first-quarter data will be superseded, with historical data accessible through the BEA’s Data Archive.
Broader Implications and Economic Context
The widening current-account deficit and the net borrowing reflected in the financial account underscore the United States’ ongoing reliance on foreign capital to finance its domestic investments and consumption. While a current-account deficit is not inherently negative and can reflect a healthy economy attracting foreign investment, a persistent and growing deficit warrants careful monitoring. It can signal potential vulnerabilities, such as increased external debt burdens and sensitivity to changes in global investor sentiment.
The interplay between trade in goods and services, income flows, and financial transactions highlights the interconnectedness of the global economy. Shifts in global economic conditions, such as changes in interest rates in major economies, fluctuations in commodity prices, or geopolitical events, can have ripple effects on a nation’s current-account balance and investment position. For the U.S., understanding these dynamics is crucial for formulating effective economic and trade policies. The data from the BEA serves as an indispensable tool for policymakers, businesses, and researchers to navigate the complexities of international economic engagement.
Analysis of Financial Account Movements
The significant increase in U.S. liabilities to foreign residents in the first quarter of 2026, exceeding the increase in U.S. assets abroad, is a key factor driving the net borrowing. This could be attributed to various factors, including increased foreign direct investment in U.S. companies, greater foreign purchases of U.S. Treasury securities, or other portfolio investments. The magnitude of these flows suggests strong international investor confidence in U.S. assets, even as the nation’s current account balance deteriorates.
The substantial impact of exchange-rate changes on both U.S. assets and liabilities is also noteworthy. Fluctuations in currency values can significantly alter the reported value of international investments when converted back to the domestic currency. This highlights the importance of considering valuation effects alongside transactional flows when assessing the overall health of a nation’s international financial standing.
The BEA’s meticulous reporting and regular updates provide a vital window into the intricate web of global economic interactions. As the U.S. economy continues to evolve within a dynamic global landscape, these statistics will remain essential for informed decision-making and strategic planning.